- The paper presents the VVV survey’s early near-IR findings by constructing high-precision light curves of variable stars, including standard candles like RR Lyrae.
- It employs a dual-phase approach combining initial multicolor mapping with intensive Kₛ-band monitoring and novel Rσ statistics for variability detection.
- Preliminary results indicate a 1–2% variable star fraction, offering refined Galactic structure mapping and improved constraints on stellar evolution.
Early Characterization of Stellar Variability in the VISTA Variables in the Via Lactea Survey
Introduction
The VISTA Variables in the Via Lactea (VVV) project constitutes a large-scale, ESO public near-infrared variability survey employing the VIRCAM instrument on the VISTA telescope. Targeting both the Galactic bulge and a contiguous region of the southern mid-plane, VVV is intended to circumvent extinction effects that hinder optical surveys by utilizing the ZYJHKs filter set. Its principal aims are the construction of an unprecedentedly deep near-IR atlas and the assembly of a Ks-band time-series database for approximately 109 point sources, with over one million expected variables. A primary scientific outcome of the survey is the provision of high-precision light curves for standard candles—most notably RR Lyrae stars—and the consequent refinement of the Galactic three-dimensional structure.
Survey Design and Photometric Strategy
VVV’s multi-pronged observation plan consists of an initial phase of multicolor mapping merged with an ongoing temporal monitoring campaign. While the first survey year emphasized global color-mapping, the subsequent years focus on dense Ks-band time coverage, with a final target of ∼100 epochs per source over five years. The survey’s preeminent strength lies in its ability to probe fainter magnitudes—up to four magnitudes deeper than 2MASS, reaching Ks=18m under favorable conditions—allowing distance measurements using RR Lyrae stars well beyond the Galactic center and a considerable extension of the observable disk for G dwarfs.
Temporal sampling is designed to be nearly random to robustly sample stellar phases for short- and long-period variables. For select survey fields, intensive high-cadence observations are scheduled (10–40 per night), targeting rapid variables and transient phenomena not adequately sampled by standard cadence strategies. Each sky position is observed using six dithered exposures (“pawprints”) per epoch, which enables contiguous coverage and redundancy necessary for robust photometric error estimation.
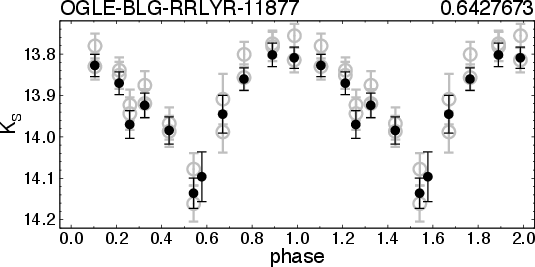
Figure 1: Example of a phase-folded Ks light curve for a known RRab Lyrae star, revealing the survey's ability to recover periodic variability in heavily extincted sightlines.
Data Reduction and Calibration
All image products are processed via the VISTA Data Flow System (VDFS), incorporating dark and flat corrections, astrometric solution, aperture photometry, and calibration tied to secondary 2MASS standards. Enhanced processing modules under development—PSF photometry, image subtraction, and automated light curve classification—promise to further improve completeness and variable recovery, especially in crowded fields. The processed catalogs are housed in a synoptic relational database accessible through the ESO data archives, facilitating cross-survey scientific exploitation.
Early Assessment of Time Series Quality
Initial ∼1.5 year results, covering up to 13 epochs per source, enable preliminary evaluation of photometric stability and variable identification effectiveness. These metrics are vital given the high crowding towards the inner bulge, which challenges aperture photometry due to blending and variable seeing. The distribution of photometric scatter for point sources in a crowded bulge field is illustrated in (Figure 2). A comparative analysis in a less crowded disk field is provided in (Figure 3), underscoring the impact of crowding on detection thresholds and attainable photometric precision.
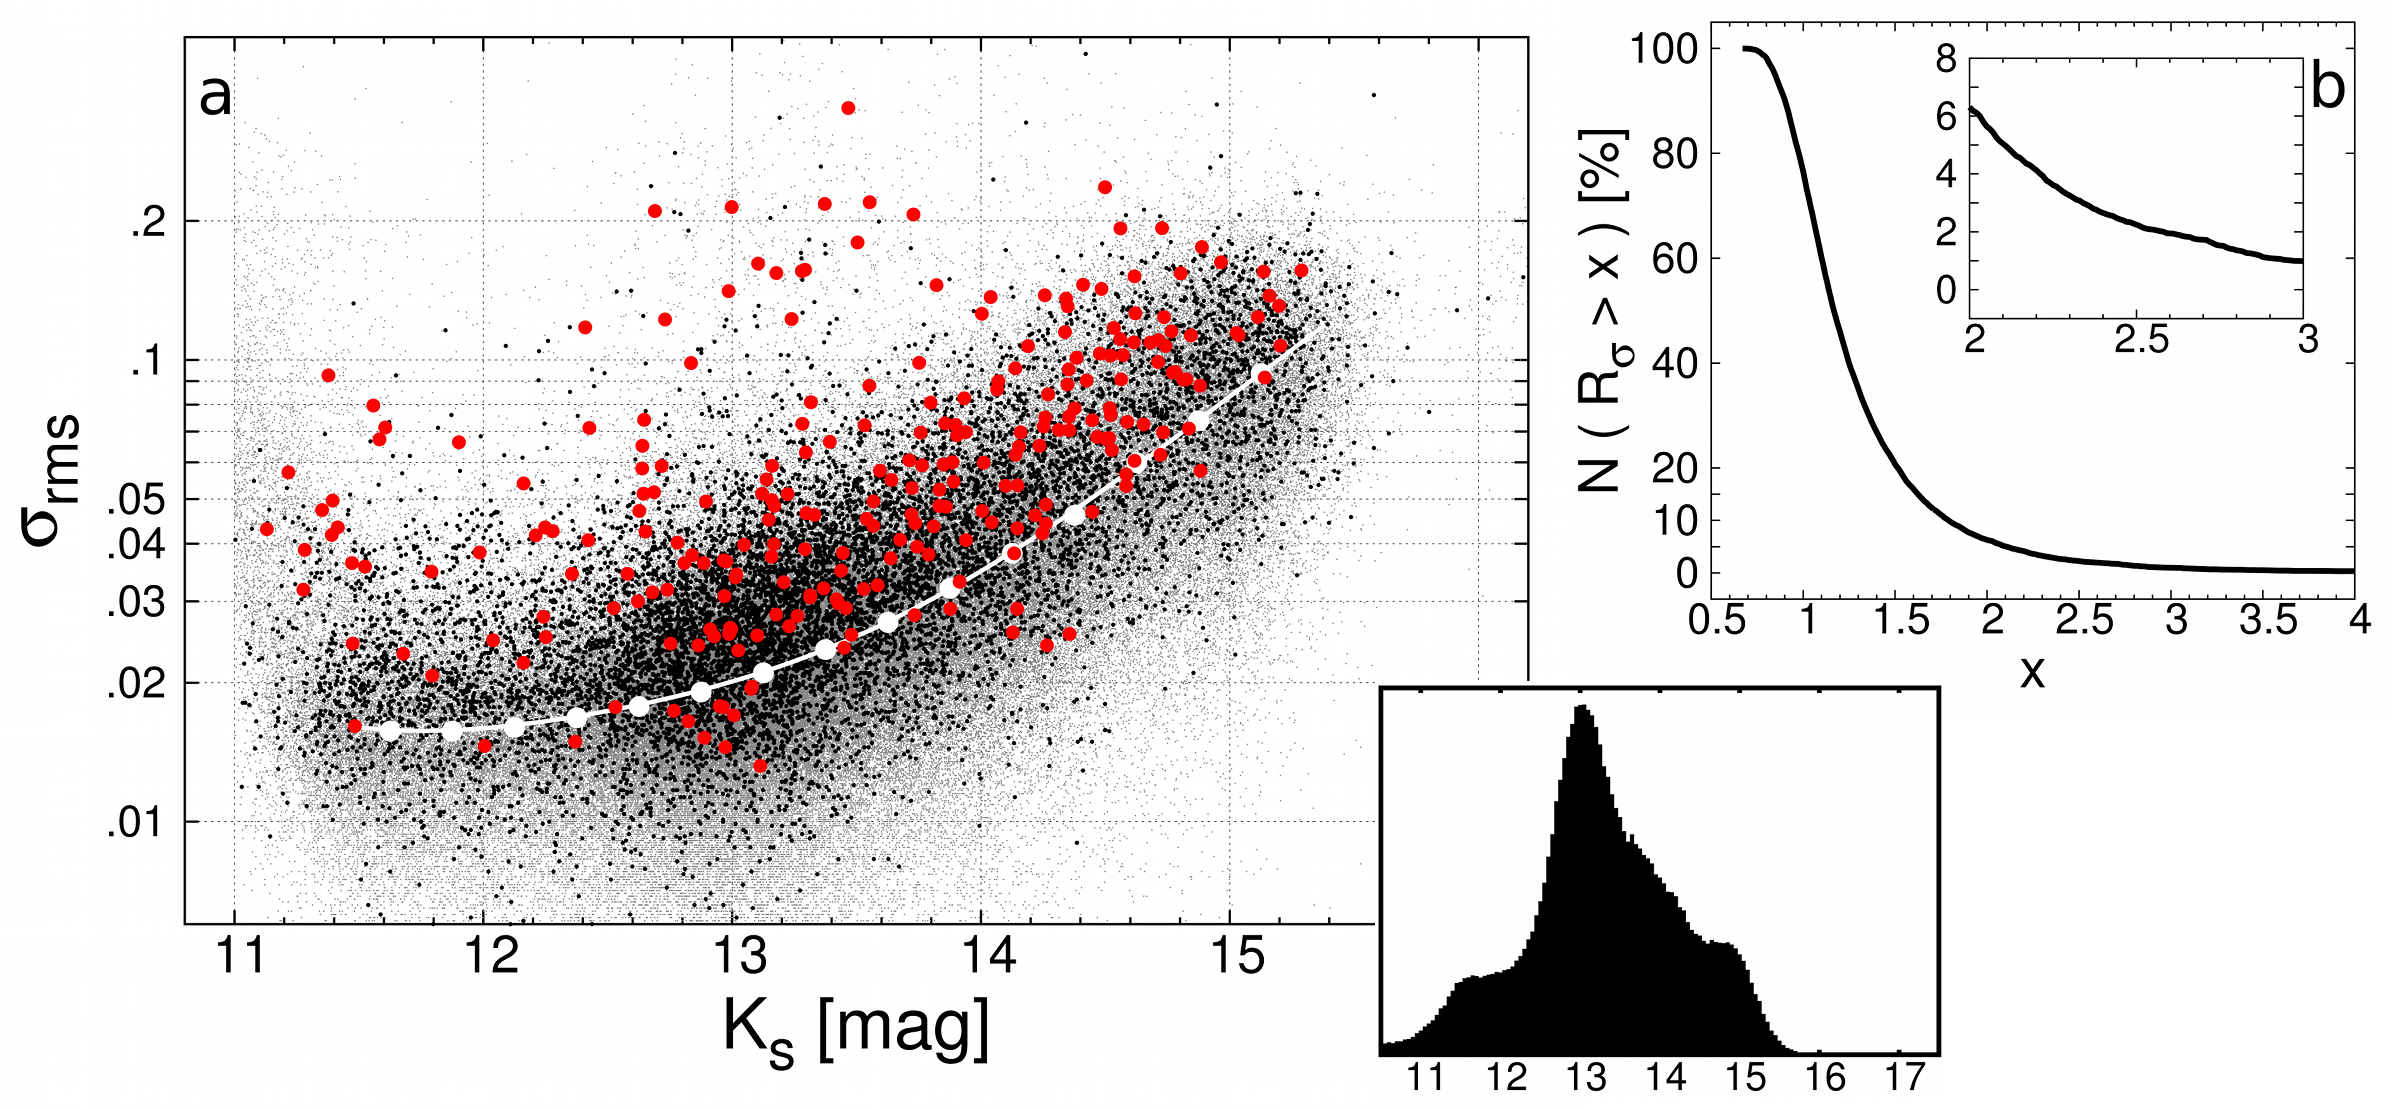
Figure 2: Scatter plot of bulge point sources with overlaid variability selections, along with the cumulative distribution of the Rσ statistic identifying candidate variables.
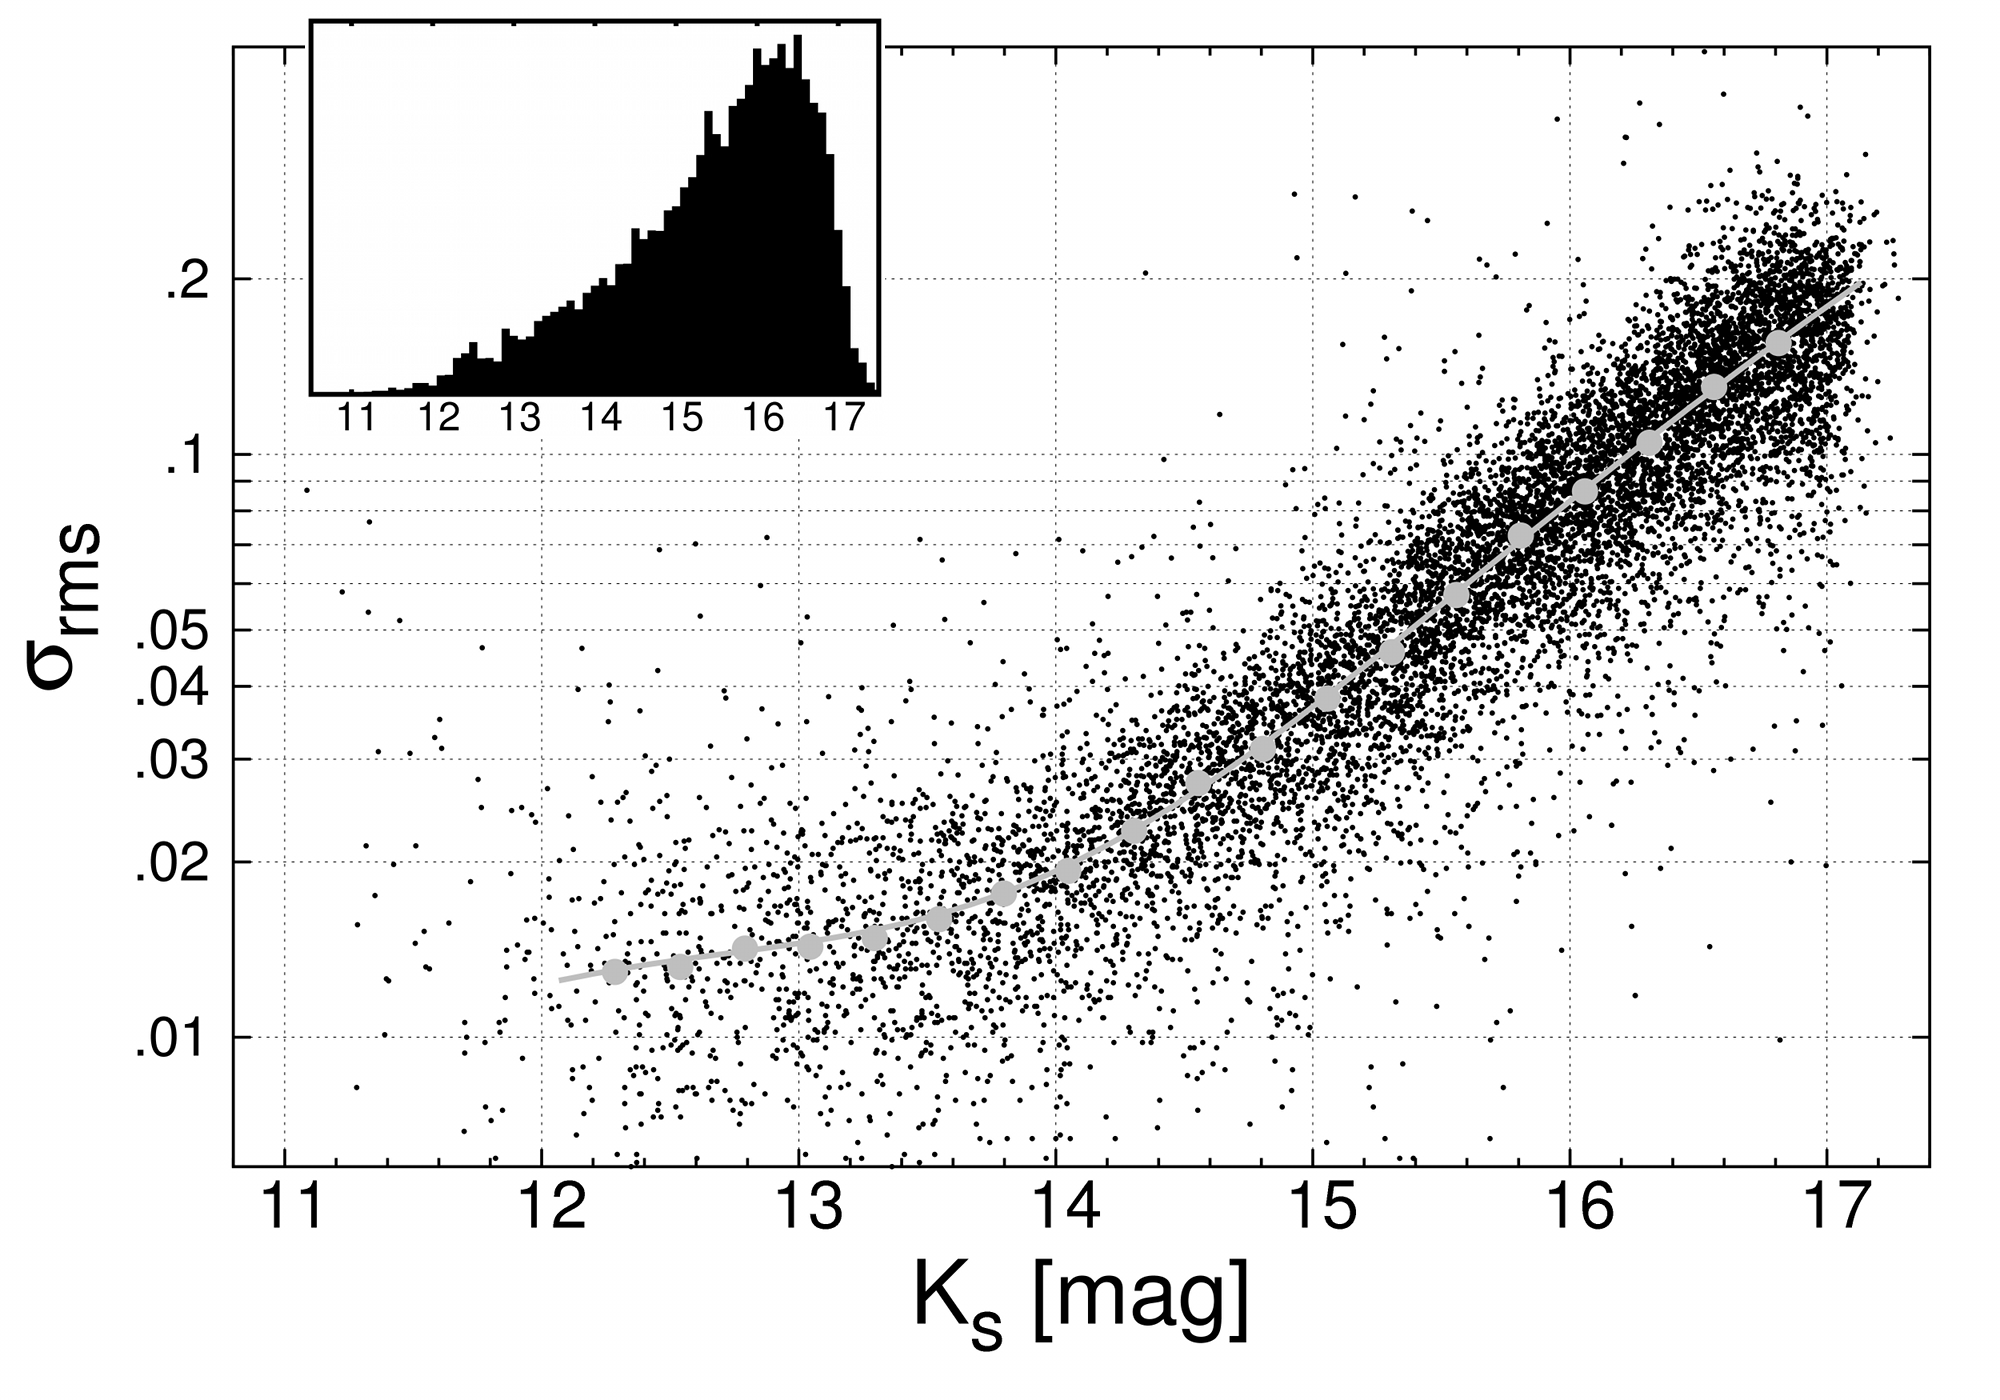
Figure 3: Photometric scatter and source distribution in overlapping VVV disk fields, where reduced crowding and extinction allow for superior performance.
To statistically assess stellar variability prevalence, the paper introduces the Rσ statistic, comparing the global rms of the light curve with the internal scatter measured from closely spaced pawprint exposures. For robustly photometrically sampled sources (M≥8 high-quality pairs), outliers with Rσ≥2.5 are flagged as probable variable stars. This methodology is effective in identifying variability that is undetectable through global rms-magnitude fitting alone.
The fraction of variable sources is estimated at approximately 1–2%, consistent with independent variability searches conducted in analogous fields. This is a non-trivial lower limit given the limited epoch coverage in the preliminary dataset and the complexity imposed by crowding.
Implications for Galactic Structure and Stellar Astrophysics
VVV’s resulting database will enable improved mapping of the Galactic structure in three dimensions by exploiting newly discovered standard candles, increasing the accuracy of distance ladders and extinction maps. In addition, the survey's multiband time-domain coverage will facilitate new constraints on pulsation and evolutionary models for RR Lyrae, Cepheids, eclipsing binaries, and other classes of variables across diverse environments—ranging from field stars to clusters embedded in obscured regions.
The extension of variable star searches into crowded, highly reddened regions previously inaccessible to optical time-domain surveys opens prospects for recalibrating stellar population models, revisiting the formation history of the bulge, and elucidating the role of internal and external processes in Galactic evolution. VVV’s rich multi-epoch data will also benchmark and stimulate development of machine-learning approaches for light curve classification and anomaly detection, crucial for next-generation time-domain surveys.
Conclusion
The VVV survey’s early products demonstrate its unprecedented capability to detect and characterize variable stars in the infrared, mapping regions of the Milky Way crucial to unlocking the Galactic structure and stellar evolution under extreme environments. The survey’s deep, densely-sampled near-IR photometric database will serve as a cornerstone for future studies spanning Galactic dynamics, variable star astrophysics, and algorithmic development in time-domain astronomy.
The ongoing refinement of photometric pipelines and variability detection will further consolidate VVV’s role in Galactic and time-domain studies, providing a uniquely powerful resource for interpreting the formation and assembly history of our Galaxy.