Towards Financial World Modeling
Abstract: Building a world model requires a state representation useful for planning and decision-making---potentially over tasks unknown at training time. In the context of financial markets, planning and decision-making may require a model to reason about market-wide conditions, asset-specific expected returns, liquidity, volatility, and cross-asset relationships. Yet financial representation learning has largely been evaluated on individual predictive tasks, oftentimes on a single time period using comparatively narrow datasets. We address this through three primary contributions. First, we introduce Market-1T, a dataset containing nearly one trillion observations across U.S. equities from 2008 to 2025 at 1 Hz resolution. Second, we develop and implement a rigorous evaluation protocol. Third, we conduct a systematic large-scale study of financial representation learning, comparing 18 encoder-training strategies across nearly two decades of market regimes. We evaluate learned representations both by their predictive utility on common finance tasks and through probes of latent structure. We find that encoders with similar predictive performance can organize market state very differently. Collectively, we establish a foundation for training and evaluating financial market representations in support of world models such as DINO-WM, V-JEPA 2, and LeWM.
Paper Prompts
Sign up for free to create and run prompts on this paper.
Explain it Like I'm 14
1. What is this paper about?
This paper studies how computers can learn useful summaries of financial markets.
Financial markets produce enormous amounts of information every second: prices, trades, buying and selling orders, trading speed, and more. The researchers want to build a kind of “world model” for finance—a computer model that understands what is happening in the market and can help predict what might happen next.
Before building such a model, researchers need to decide how the computer should represent the market. This is similar to giving a student a useful notebook: the notebook should keep the important information, not just random details.
The paper makes three main contributions:
- It introduces a huge public dataset called Market-1T.
- It creates a careful way to test financial AI models.
- It compares many different ways of training these models.
2. What questions did the researchers ask?
The researchers wanted to answer several important questions:
- Can AI models learn information that helps predict:
- future stock returns,
- changes in market volatility, and
- changes in the cost of trading?
- Does a model understand meaningful relationships between companies, industries, and trading days?
- Do different training methods make models organize information in different ways?
- Does a model trained during one period continue to work during other market conditions?
- Are bigger AI models always better, or can smaller models be more effective?
- Is predicting the next price movement enough, or does a useful financial model need to understand much more about the market?
3. How did the researchers conduct the study?
The Market-1T dataset
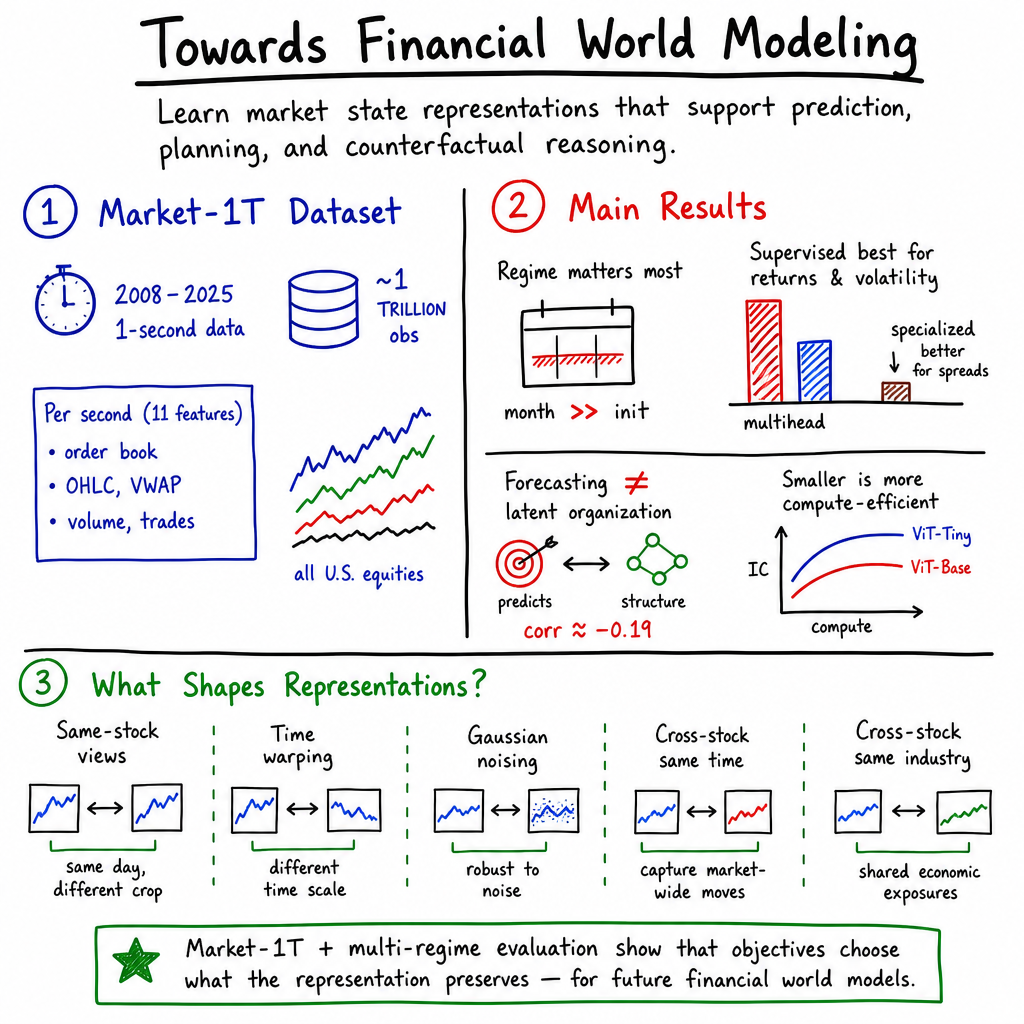
The researchers created a dataset covering almost every stock traded in the United States from 2008 to 2025.
It contains almost one trillion observations. Each observation describes what happened during a one-second period. The data include:
- the best price someone was willing to pay,
- the best price someone was willing to accept,
- the number of shares available to buy or sell,
- opening, highest, lowest, and closing prices,
- average trading price,
- trading volume, and
- number of trades.
This is like recording the activity in a huge marketplace every second for 18 years.
The researchers used data from liquid stocks, meaning stocks that were traded often and had many buyers and sellers. They also changed the list of stocks over time, instead of only studying companies that still existed at the end of the period. This helped avoid a mistake called survivorship bias, where researchers accidentally ignore companies that performed badly or disappeared.
Different ways of training the models
The study compared 18 encoder-training strategies. An encoder is a computer program that turns complicated information into a shorter list of numbers called a representation or embedding.
For example, instead of giving a computer thousands of market numbers, an encoder might summarize them as a smaller description such as:
“The market is very active, prices are changing quickly, and technology stocks are moving together.”
Some models were trained directly to predict future market results. Others used self-supervised learning. This means the computer learns from the data without humans labeling every example. It might be asked to recognize two different views of the same market event or to fill in missing information.
The researchers also tested a randomly initialized model that had not learned from market data. This provided a useful comparison, similar to testing whether a student who studied actually performs better than someone guessing.
Testing the models
The researchers evaluated the models in two main ways.
First, they tested prediction. A simple statistical tool called a probe used each model’s representation to predict:
- stock returns 15 minutes later,
- changes in volatility, or how wildly prices move, and
- changes in the bid–ask spread, which is the gap between the best buying and selling prices.
The researchers used a measure called rank information coefficient, or rank IC. In simple terms, this checks whether stocks predicted to perform better actually tend to perform better than stocks predicted to perform worse. It focuses on the ordering of predictions rather than exact prices.
Second, they tested the model’s internal organization. They asked whether similar points in the model’s representation space corresponded to:
- the same company,
- the same day,
- companies in the same industry, or
- companies whose prices usually move together.
This is like checking whether a map puts nearby cities in sensible locations. A model might be good at predicting tomorrow’s price but still have a confusing internal map of the market.
To make the results more reliable, the researchers tested the models during 32 different months spread across 2008–2025. This included different market conditions, such as calm periods and financial crises.
4. What did the researchers find?
Market conditions matter greatly
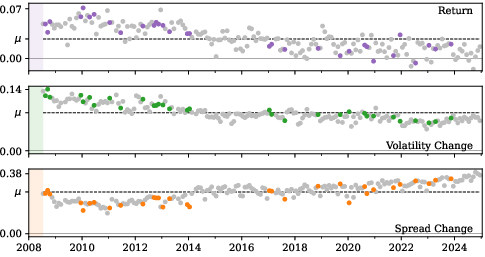
The models’ performance changed substantially from month to month. The month being tested explained far more of the results than the random starting point of the AI model.
This means that testing a model only during one short period can give a misleading answer. A model might look excellent during one market environment but perform poorly in another.
No single training method was best at everything
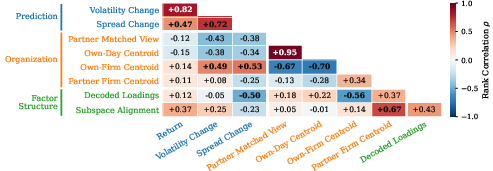
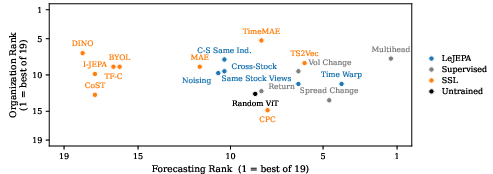
The researchers found that predictive ability and meaningful organization are different qualities.
A model could be good at predicting returns but poor at understanding:
- which companies belong to the same industry,
- which stocks move together, or
- which market conditions are shared across a whole day.
The rankings of models on prediction tasks and organization tasks were only weakly related. This suggests that a useful financial world model needs to be tested in more than one way.
Supervised models often predicted best
Models trained directly on the prediction tasks generally preserved more useful information for forecasting returns and volatility.
A model trained on several tasks at the same time, called the multihead model, performed especially well for return and volatility prediction. This suggests that these two tasks share some useful information.
However, the spread-prediction task was different. Many self-supervised models performed worse than the untrained random model on this task. This may mean that information about trading costs is more specialized and harder to learn using general training methods.
Some self-supervised methods were useful, but not all
Among the self-supervised approaches, methods such as time warping and TS2Vec were relatively strong for some prediction tasks.
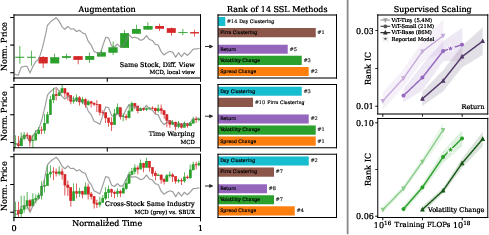
Different training examples encouraged models to focus on different things. For example:
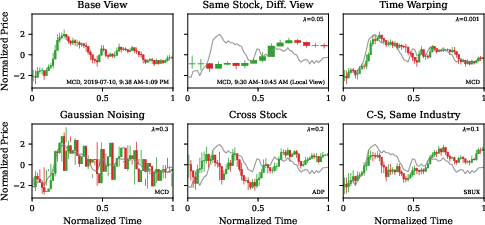
- Showing a model different views of the same company encouraged it to recognize company identity.
- Showing different companies at the same time encouraged it to focus more on overall market movements.
- Showing companies from the same industry encouraged it to notice industry-level similarities.
This shows that the examples used during training can strongly shape what the model considers important.
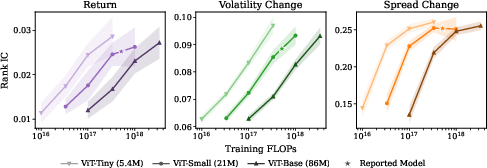
Smaller models were often more efficient
Surprisingly, the smallest model tested, called ViT-Tiny, often performed better than larger models when the researchers gave them the same amount of computing power.
This suggests that larger models do not automatically learn better financial representations. Financial data may be noisy, so a smaller model may avoid memorizing unhelpful details.
Some knowledge becomes outdated
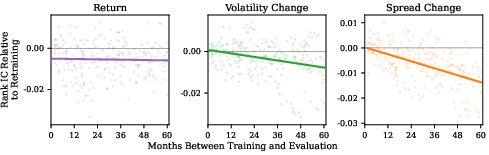
Information about future returns appeared to remain useful for longer periods. However, information about volatility and trading spreads became less useful as the training date moved farther away from the test date.
This makes sense because the way markets behave can change over time. For example, trading technology, regulations, and investor behavior may all change.
A huge dataset is valuable
Market-1T is important because it combines:
- very fine time detail, measured every second,
- a long period of 18 years,
- many different U.S. stocks, and
- public access.
Many previous financial datasets were much smaller, covered fewer companies, used daily rather than second-by-second data, or were not publicly available.
5. Why is this research important?
The paper shows that creating a useful AI model of financial markets is more complicated than simply predicting whether a stock price will rise or fall.
A model used for real decision-making might need to understand several things at once:
- expected returns,
- market-wide conditions,
- volatility,
- trading costs,
- company differences,
- industry relationships, and
- how several assets move together.
For example, an AI deciding whether to buy a stock would need to know not only whether the price might increase, but also whether the stock is easy to trade, how risky it is, and whether other stocks are likely to move in the same direction.
The paper provides an important foundation for future financial world models. Its dataset and testing methods can help researchers compare models more fairly and discover what information those models truly preserve.
However, the research does not prove that these models can reliably make money or replace human financial experts. Financial markets are unpredictable, and a model that performs well in past data may fail when conditions change.
Overall, the main lesson is:
A good financial AI model must understand more than the next price movement. It needs a rich and flexible picture of how the whole market works.
Practical Applications
The paper’s findings support applications primarily in financial data infrastructure, quantitative research, market surveillance, and decision-support systems. They do not yet justify fully autonomous trading or policy decisions: predictive gains are modest, regime-dependent, and measured mainly through rank IC rather than live net returns.
Immediate Applications
The following uses can be implemented now using the released dataset, code, encoders, and evaluation protocol, subject to data-access and financial-compliance requirements.
- Regime-robust benchmarking for quantitative finance
- Sector: Asset management, quantitative research, fintech, academic finance.
- Firms and research groups can use Market-1T as a standardized benchmark for comparing forecasting models, self-supervised encoders, time-series foundation models, and classical factor models.
- A practical workflow would train models on historical data, evaluate them on the paper’s 32-month multi-regime sample, and report performance separately by market period rather than relying on a single recent backtest.
- Dependency: The complete dataset must remain accessible, and users must reproduce the paper’s temporal splits, universe construction, normalization, and leakage controls.
- Research-grade backtesting and model validation
- Sector: Algorithmic trading, investment management, financial software.
- The protocol can be integrated into internal model-validation pipelines to test whether a strategy’s performance survives bull markets, crises, changing volatility, and shifts in liquidity.
- The finding that evaluation month explains substantially more variance than random seed suggests that firms should prioritize regime coverage and rolling or walk-forward validation over repeated runs on one period.
- Dependency: Validation must include transaction costs, market impact, turnover, short-sale constraints, latency, and realistic execution; rank IC alone is insufficient evidence of profitability.
- Short-horizon return and volatility signals
- Sector: Quantitative trading and portfolio management.
- Supervised multihead encoders, and selected time-warping or time-series methods, can be used as feature extractors for 15-minute forecasts of cross-sectional returns and volatility changes.
- Possible products include intraday ranking dashboards, candidate alpha signals, position-sizing overlays, and risk-aware trade-screening tools.
- The paper’s results suggest that a shared representation for return and volatility can be useful, while spread prediction may require a specialized head or separate model.
- Dependency: Signals must be retrained or recalibrated as regimes change, and any deployment must demonstrate positive net performance after execution costs and adverse selection.
- Liquidity and transaction-cost monitoring
- Sector: Brokerages, exchanges, execution platforms, institutional trading desks.
- Bid–ask spread, quote size, trade count, and volume features can feed real-time dashboards that identify deteriorating liquidity or likely increases in execution cost.
- A trading system could use spread-change forecasts to delay, split, reroute, or reduce orders when expected transaction costs rise.
- The paper indicates that spread-related information is comparatively specialized and is not reliably preserved by all general-purpose encoders.
- Dependency: Consolidated SIP data may not provide the complete venue-level order-book state needed for precise execution optimization; timestamp alignment and feed latency are also critical.
- Cross-asset and industry similarity search
- Sector: Portfolio construction, equity research, risk management.
- Latent embeddings can support tools that retrieve firms with similar market behavior, industry exposure, or common factor loadings.
- Potential workflows include peer-group discovery, comparable-company analysis, thematic basket construction, and candidate selection for diversification.
- Different augmentation schemes can be selected according to the desired notion of similarity: same-firm identity, same-day market conditions, industry relationships, or broader market movements.
- Dependency: Embedding proximity does not automatically imply economic substitutability or diversification benefit; results should be checked against realized correlations, fundamentals, sector classifications, and changing firm identities.
- Factor-exposure and covariance-model support
- Sector: Risk management, portfolio optimization, institutional asset management.
- Encoders that preserve latent statistical-factor structure can provide additional features for estimating common exposures and cross-asset dependence.
- A possible product is a latent-factor risk engine that combines learned embeddings with conventional covariance estimators to improve stress testing, hedging, and portfolio concentration monitoring.
- Dependency: The paper evaluates factor recoverability but does not establish superior out-of-sample covariance forecasts or portfolio risk outcomes. Factor stability must be tested across assets and regimes.
- Market surveillance and anomaly triage
- Sector: Exchanges, regulators, compliance, broker-dealers.
- Latent representations of one-second quote and trade activity can be used to flag observations that differ sharply from normal firm-, industry-, or day-level patterns.
- Applications include triage of unusual liquidity deterioration, abrupt spread widening, abnormal trade intensity, and cross-stock dislocations.
- Human analysts could use embedding-based retrieval to compare an event with historically similar market states.
- Dependency: Anomaly detection is not equivalent to proving manipulation or misconduct. Systems require labeled investigations, explainability, robust false-positive controls, and regulatory approval.
- Open financial machine-learning infrastructure
- Sector: Academia, financial technology, education.
- Universities and companies can use Market-1T to reproduce the paper, develop alternative encoders, test data augmentations, and compare model scaling strategies under common conditions.
- The data can support coursework and laboratory exercises in time-series learning, market microstructure, causal-in-time evaluation, and responsible backtesting.
- The finding that smaller ViT models can outperform larger models at a fixed compute budget also supports cost-efficient experimentation.
- Dependency: Researchers must account for the computational and storage burden of nearly one trillion observations and verify licensing, redistribution, and commercial-use terms.
- Human decision-support for retail investors
- Sector: Consumer finance and financial education.
- A cautious consumer-facing application could summarize short-term volatility, liquidity, and market-wide conditions rather than issue direct buy or sell recommendations.
- For example, an app might warn that a security has unusually wide spreads or elevated predicted volatility and explain that expected execution costs are higher.
- Dependency: The system must avoid presenting weak, regime-dependent signals as reliable forecasts and must comply with suitability, disclosure, and investment-advice regulations.
Long-Term Applications
These applications require additional research, production-scale validation, or the development of reliable market dynamics and action models.
- A financial world model for counterfactual trade planning
- Sector: Algorithmic execution, portfolio management, financial AI.
- The learned encoders could serve as state representations for a world model that predicts how market conditions evolve after actions such as submitting, canceling, splitting, or delaying orders.
- A future system could jointly reason about expected return, volatility, liquidity, spread, cross-asset effects, and execution consequences before selecting an order policy.
- Architectures inspired by DINO-WM, V-JEPA 2, or LeWM could be adapted to learn temporal and action-conditioned market dynamics.
- Dependencies: The current paper studies representation learning, not reliable counterfactual dynamics. The system would need action-labeled data, realistic simulators, causal identification, robust uncertainty estimates, and protection against strategic feedback from the model’s own trades.
- Autonomous or semi-autonomous execution agents
- Sector: Brokerage, electronic market making, institutional trading.
- A mature world model could power agents that adapt order placement and execution schedules to predicted liquidity, spread, volatility, and market-state transitions.
- Likely intermediate products include human-supervised execution recommendations, automatic order slicing, and risk-limited reinforcement-learning policies.
- Dependencies: Deployment requires latency guarantees, safe exploration, hard risk limits, compliance monitoring, resilience to adversarial behavior, and extensive paper trading and shadow deployment. The paper does not demonstrate profitable or safe autonomous execution.
- Adaptive portfolio construction under regime shifts
- Sector: Asset management, pension funds, robo-advising.
- Combining latent market-state organization with return, volatility, and factor forecasts could produce portfolios that change exposures as market-wide conditions, industry relations, or liquidity states evolve.
- Potential workflows include dynamic hedging, regime-conditioned factor allocation, and diversification based on learned—not solely historical—relationships.
- Dependencies: Portfolio optimization amplifies estimation error. The weak relationship between predictive ranking and latent organization means that forecasting and diversification objectives should be evaluated separately and jointly, with constraints on turnover and concentration.
- Real-time systemic-risk and market-stability monitoring
- Sector: Central banks, securities regulators, financial-stability authorities.
- Aggregated embeddings across securities could help identify emerging market-wide states characterized by synchronized movements, deteriorating liquidity, or unusual cross-asset dependence.
- A policy dashboard might track transitions into historically stressed latent regions and support scenario analysis or targeted supervisory review.
- Dependencies: Historical U.S. equity data alone do not represent banks, derivatives, fixed income, international markets, or private assets. Policy use would require broader coverage, interpretable indicators, calibrated probabilities, and evidence that latent transitions precede—not merely coincide with—stress events.
- Multi-asset and cross-market world modeling
- Sector: Global finance, macroeconomic research, risk technology.
- The framework could be extended from U.S. equities to bonds, options, futures, foreign exchange, cryptoassets, commodities, and international venues.
- Such a model could represent interactions among equity liquidity, interest rates, currency movements, volatility derivatives, and macroeconomic conditions.
- Dependencies: Data formats, trading hours, market microstructure, currency conversions, and reporting rules differ substantially across asset classes. Cross-market timestamp synchronization and survivorship-free universe construction would be necessary.
- Causal and intervention-aware market simulation
- Sector: Academic economics, financial regulation, exchange design.
- Future research could use learned state spaces to simulate interventions such as tick-size changes, trading halts, margin adjustments, liquidity-provider incentives, or altered execution rules.
- This could support policy experiments before implementation and help evaluate how rules affect spreads, volatility, and market resilience.
- Dependencies: Representation similarity is not causal structure. Reliable policy simulation requires identification strategies, natural experiments, structural assumptions, agent heterogeneity, and validation against out-of-sample interventions.
- Continual-learning financial foundation models
- Sector: Financial software and research infrastructure.
- Since volatility and spread representations degrade with model age, production systems could use continual retraining, rolling adaptation, or expert models specialized for different regimes.
- A future platform might automatically detect distribution shifts, select an appropriate encoder, and recalibrate downstream probes without retraining the entire model.
- Dependencies: Continual learning can cause catastrophic forgetting, introduce look-ahead leakage, or overfit transient patterns. Model updates require strict versioning, audit trails, frozen evaluation windows, and drift-detection criteria.
- Explainable latent-state interfaces for analysts and policymakers
- Sector: Financial research, compliance, education, public policy.
- The paper’s separation of predictive quality from latent organization could lead to interfaces that show whether a model’s state is primarily organized by firm identity, trading day, industry, or statistical factors.
- Such tools could help analysts understand why a model treats two securities as similar and whether its representation is appropriate for forecasting, risk, or execution.
- Dependencies: Retrieval and probe results are diagnostic rather than complete explanations. Additional work is needed to connect latent dimensions to economically interpretable mechanisms and to prevent misleading visualizations.
- Personalized financial education and risk communication
- Sector: Consumer finance and education.
- If validated and simplified, market-state embeddings could support educational tools that explain how liquidity, volatility, industry comovement, and market regimes affect investment outcomes.
- A learning platform could use historical analogues to demonstrate why the same strategy behaves differently during crises and normal periods.
- Dependencies: Educational use should not be confused with individualized financial advice. Historical analogies may fail under structural breaks, and interfaces must communicate uncertainty and the absence of guaranteed predictive power.
Glossary
- 1 Hz resolution: One observation or measurement per second. “Market-1T combines a longer historical span with substantially finer temporal resolution than is typical of public financial representation-learning benchmarks”
- Action-conditioned prediction: Prediction that explicitly depends on an agent’s prospective actions. “V-JEPA 2 adapts a pretrained predictive encoder to action-conditioned prediction”
- Bid–ask spread: The difference between the best available selling price and buying price for an asset. “We probe representations for future return, volatility change, and bid--ask spread change”
- Common cross-section: A set of assets selected according to shared eligibility criteria for comparison at a particular time. “our benchmark experiments use a comparatively liquid common-stock universe”
- Consolidated Tape Association (CTA): A U.S. securities-information plan that consolidates and distributes market quotations and transaction data. “including Securities Information Processor feeds from the Consolidated Tape Association (CTA)”
- Consolidated trade report: A transaction record combined from multiple trading venues or reporting sources. “The underlying data consist of National Best Bid and Offer (NBBO) updates and consolidated trade reports.”
- Contrastive learning: A representation-learning approach that brings related examples closer and separates unrelated examples in embedding space. “Existing self-supervised work has considered contrastive asset embeddings”
- Covariance modeling: Estimation of how the returns of multiple assets vary jointly. “This provides a complementary test of whether the representation preserves cross-asset dependence structure that could, for example, support covariance modeling.”
- Cross-asset dependence: Statistical dependence among the movements of different assets. “whether the representation preserves cross-asset dependence structure”
- Cross-sectional dimension: Variation or coverage across different assets, securities, firms, or other entities at a given time. “Market-1T substantially expands the public setting along both the temporal and cross-sectional dimensions”
- Data augmentation: A transformation of training data that creates modified views while preserving relevant information. “We compare 14 self-supervised encoder-training strategies, varying both data augmentation and pretraining objectives”
- Decision time: A timestamp at which a model’s forecast or an investment decision is evaluated. “We average IC over all decision times in each evaluation month.”
- Effective rank: A measure of the number of meaningful dimensions occupied by a representation, rather than merely its nominal dimensionality. “We first measure the effective rank of each representation”
- Encoder: A model that maps raw observations into a lower-dimensional representation or embedding. “We compare 18 encoder-training strategies across nearly two decades of market regimes.”
- Execution quality: The degree to which intended trades are carried out at favorable prices and with limited market impact or cost. “These choices move realized Sharpe substantially more than encoder choice”
- Factor exposure: The sensitivity or loading of an asset’s return to a particular statistical or economic factor. “whether the firmâs loading on each return factor can be decoded from its embedding”
- Factor realization: The value taken by a common market factor during a particular period. “day-level structure, i.e., factor realizations, is arguably more important”
- Foundation model: A broadly pretrained model intended to support multiple downstream tasks or applications. “We also compare these supervised baselines to common financial baselines, time series foundation models, and untrained encoders.”
- Information coefficient (IC): A measure of the rank correlation between predicted and realized asset returns or outcomes. “We measure predictive information using rank information coefficient (IC)”
- Intrinsic difficulty: The underlying predictability or complexity of a forecasting task, independent of a model’s apparent performance. “the intrinsic difficulty of the forecasting task changes across market regimes”
- Latent space: The geometric space in which a model represents observations after encoding them into latent vectors. “Prediction alone does not determine whether a representation provides a useful state space for a world model.”
- Limit-order book (LOB): A record of outstanding buy and sell orders, organized by price and quantity. “high-frequency work often relies on specialized limit-order-book datasets and tasks”
- Liquidity: The ease with which an asset can be traded without substantially affecting its price. “planning and decision-making may require a model to reason about market-wide conditions, asset-specific expected returns, liquidity, volatility, and cross-asset relationships.”
- Market regime: A period characterized by a distinctive pattern of market behavior, such as volatility, correlations, or returns. “Performance varies substantially across market regimes”
- National Best Bid and Offer (NBBO): The highest displayed bid and lowest displayed ask available across U.S. trading venues. “The underlying data consist of National Best Bid and Offer (NBBO) updates and consolidated trade reports.”
- Order-book state: The current set of quoted prices and quantities available in an order book. “For each one-second interval, the order-book fields record the last valid quoted state available by the end of the interval”
- Portfolio construction: The process of converting forecasts into asset positions and portfolio weights. “the portfolio-construction choices used to translate forecasts into trades”
- Pretraining objective: The learning target optimized before a model is applied to a downstream task. “We vary the pretraining objective and augmentations for SSL”
- Probe: A typically simple model trained on fixed representations to test what information those representations retain. “Probe performance improves substantially with sample size”
- Rank IC: An information coefficient computed using the rank correlation between forecasts and outcomes. “We use rank IC as the primary predictive metric”
- Representation learning: Learning useful numerical features or embeddings directly from data rather than designing them manually. “financial representation learning has historically focused on”
- Risk modeling: Estimation of the risks, dependencies, and potential losses associated with portfolio positions. “These choices move realized Sharpe substantially more than encoder choice”
- Self-supervised learning (SSL): Learning from automatically generated targets derived from the input data rather than human-provided labels. “We compare 14 self-supervised encoder-training strategies”
- Sharpe ratio: A risk-adjusted performance measure commonly calculated as excess return divided by return volatility. “We further discuss the choice of IC vs Sharpe Ratio as a metric”
- SIP feed: A market-data feed that consolidates quotes and trades from multiple exchanges. “including Securities Information Processor feeds from the Consolidated Tape Association (CTA) and Unlisted Trading Privileges (UTP) plans.”
- Spearman correlation: A correlation measure based on the ranks of two variables rather than their raw values. “\mathrm{IC} \;=\;\text{Spearman Correlation}!\left(\hat{r}_{\cdot,t},\;”
- Spread change: The change over time in the difference between an asset’s best ask and best bid prices. “Spread change behaves differently”
- State representation: A compact encoding of the information describing the current state of an environment. “A world model for financial markets thus requires a state representation”
- Statistical factor: A latent or estimated variable that explains common movements across multiple asset returns. “Our final latent-space evaluation asks whether the embeddings recover statistical factors that explain joint movements across stocks.”
- Survivorship bias: Bias caused by evaluating only entities that remain in a dataset or market until the end of an observation period. “avoiding survivorship and look-ahead bias”
- Temporal decay: The deterioration of a model’s usefulness as the time between training and evaluation increases. “We next study how predictive representations change with model scale and with the distance between the training and evaluation periods.”
- Time Series Foundation Model (TSFM): A broadly pretrained model designed for forecasting temporal data. “For each evaluation month, models are trained using only the preceding six months (the Time Series Foundation Models are an exception to this rule.)”
- Unlisted Trading Privileges (UTP): A regulatory framework allowing eligible securities to be traded on exchanges where they are not formally listed. “including Securities Information Processor feeds from the Consolidated Tape Association (CTA) and Unlisted Trading Privileges (UTP) plans.”
- VWAP: Volume-weighted average price, which weights transaction prices by the quantities traded at those prices. “compute VWAP”
- Volatility: The variability of an asset’s price or return over time, often used as a measure of risk. “We probe representations for future return, volatility change”
- World model: A learned model of an environment’s state and dynamics that supports prediction, planning, and decision-making. “a ``world model.''”