Planetary Geospatial Foundation Models: A New Paradigm for Global Public Health
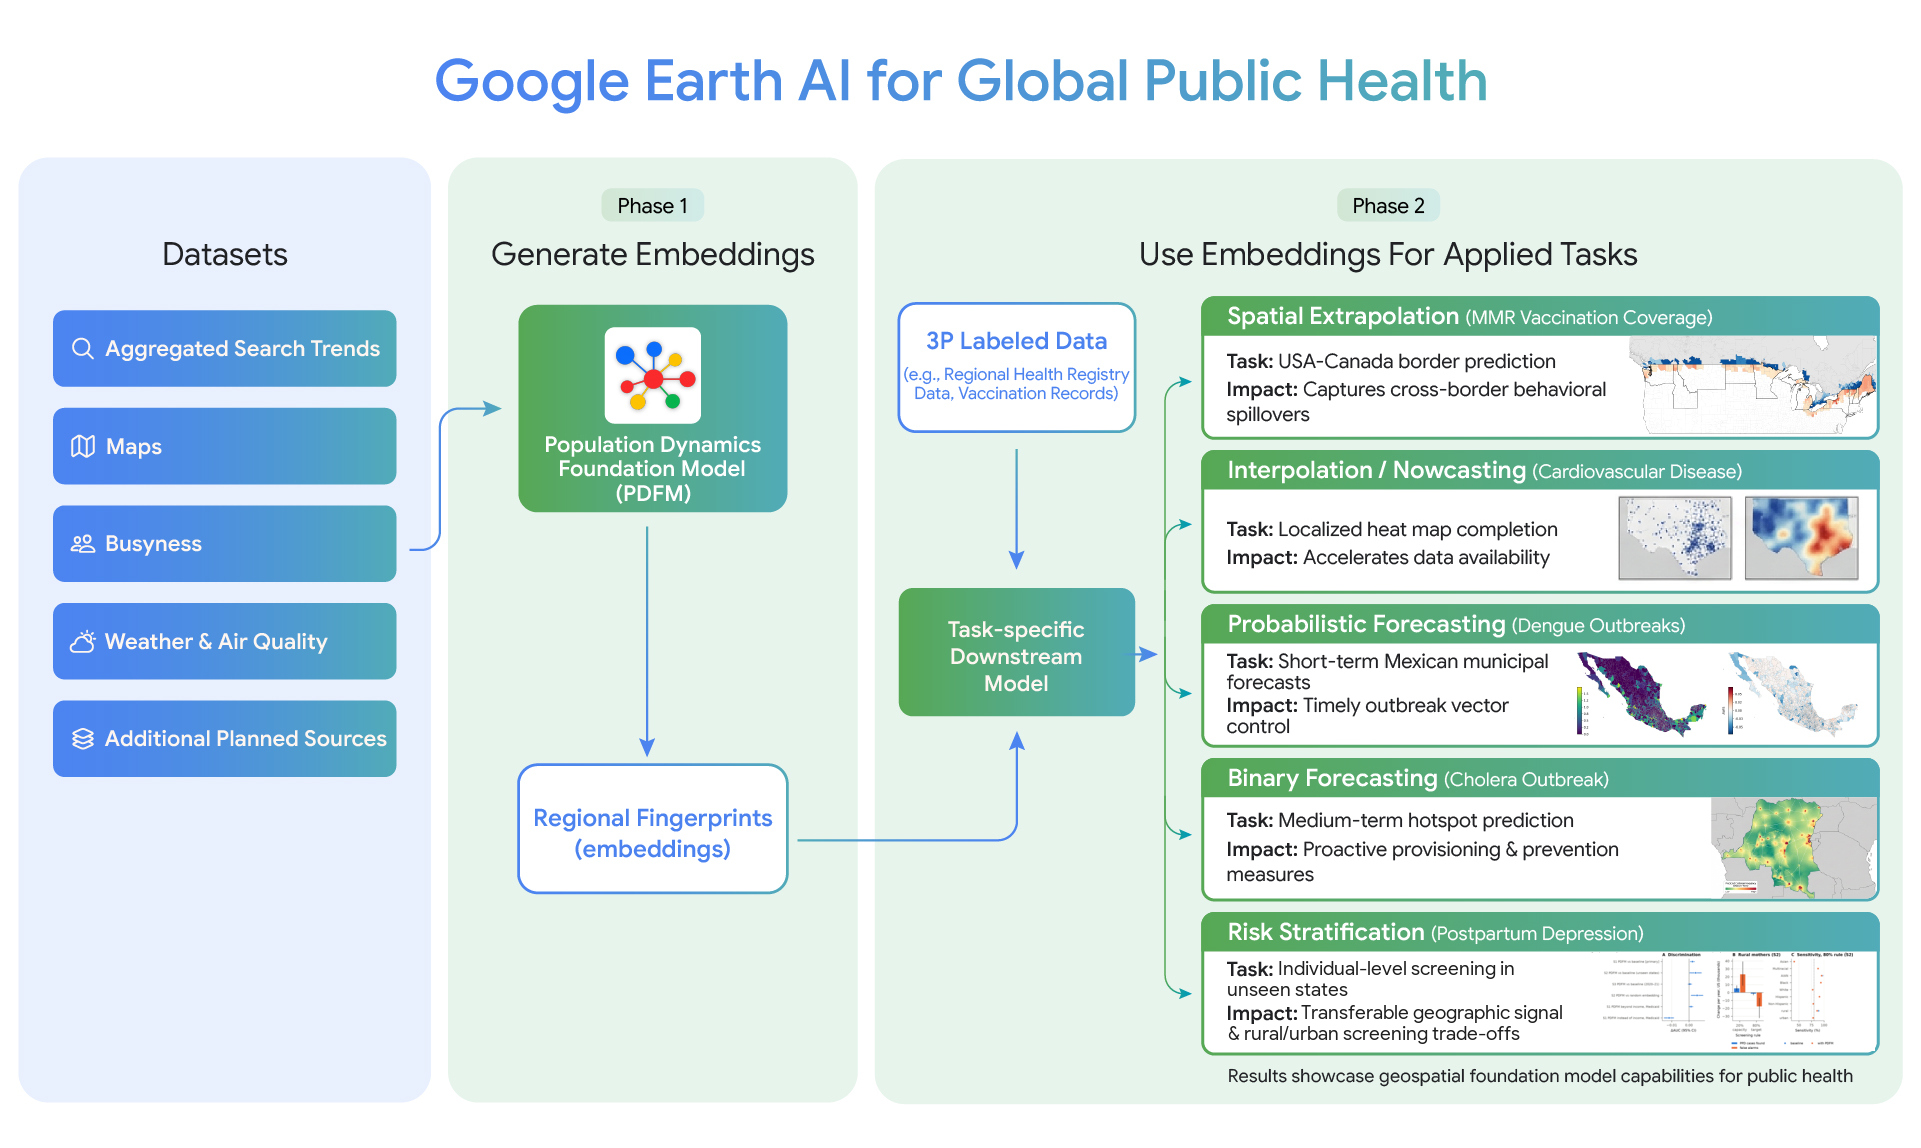
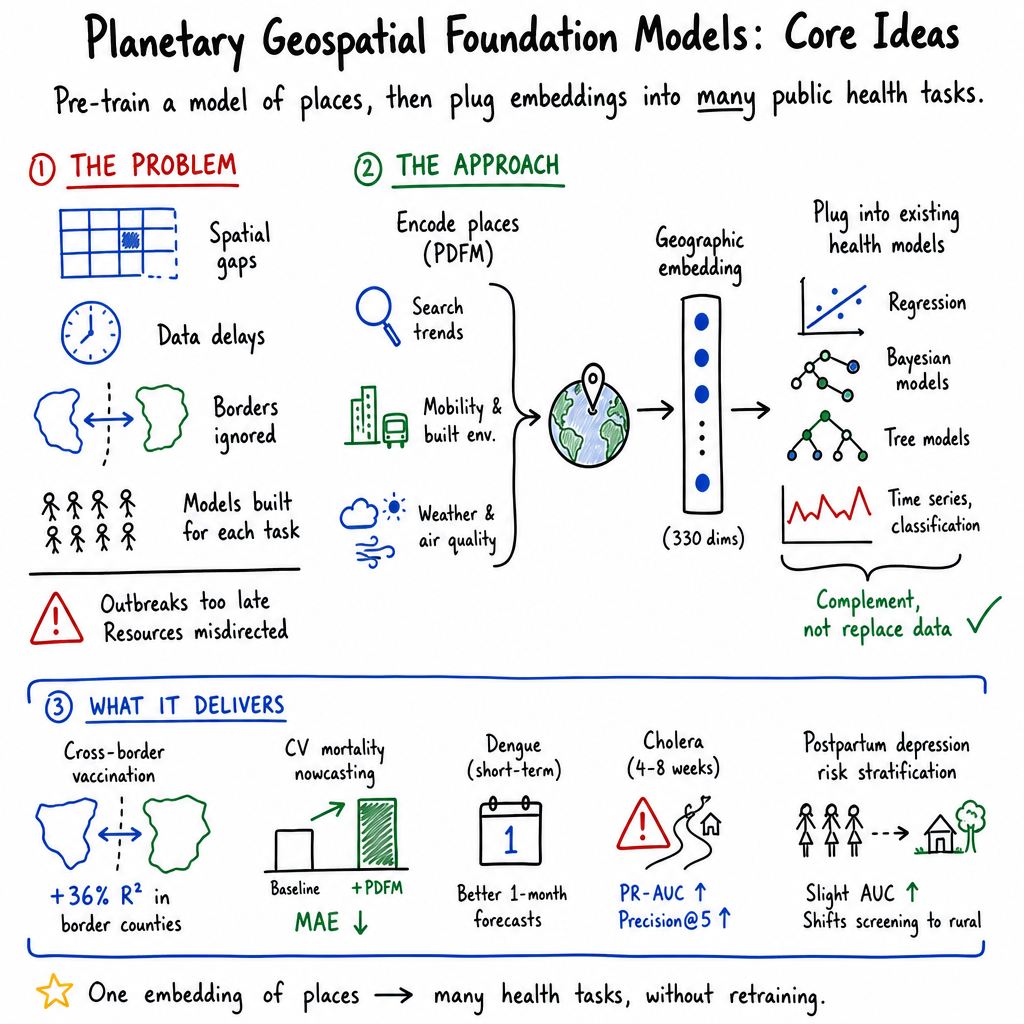
Abstract: The efficacy of traditional disease prediction is limited by spatial gaps and temporal lags, which impact the timing and targets of resource deployments. Outbreaks escalate undetected, chronic disease burdens are quantified years later, and at-risk populations in data-sparse regions remain unaddressed. Planetary geospatial foundation models complement existing epidemiological workflows to provide operational improvements, encoding multimodal search, mobility, and environmental signals into generalizable place representations. As illustrations of this complementarity, we present independent global health case studies of Google Earth AI's Population Dynamics Foundation Model (PDFM) -- a foundation model for geospatial inference -- across four domains (vaccine-preventable, communicable, noncommunicable, maternal mental health), five tasks (spatial extrapolation, interpolation/nowcasting, probabilistic forecasting, prospective forecasting, risk stratification), and four countries (USA, Canada, Mexico, and the Democratic Republic of the Congo). Across these case studies, PDFM addresses critical surveillance gaps across domains: improving US-Canada border MMR vaccination coverage predictions by capturing cross-border behavioral spillovers domestic models miss; nowcasting cardiovascular disease to accelerate data availability; enhancing short-term municipal Mexican dengue forecasts for timely outbreak vector control; improving forecasts of cholera hotspots; and adding a transferable signal to individual-level postpartum-depression risk prediction in US states the model had never seen, while not replacing individual socioeconomic data or closing demographic screening gaps. Together, these results showcase capabilities of geospatial foundation models for public health surveillance.
Paper Prompts
Sign up for free to create and run prompts on this paper.
Top Community Prompts
Explain it Like I'm 14
1. What is this paper about?
This paper studies how AI and geographic data can help public-health workers understand and predict health problems.
The researchers focus on a type of AI called a planetary geospatial foundation model. This is a computer model trained on information about places around the world, such as:
- General patterns in web searches
- How people move around
- Weather and air quality
- Features of towns and cities
- Population and environmental conditions
The model turns this information into a kind of “fingerprint” for each place. Researchers can then use these fingerprints along with health records to predict where diseases may spread or where health problems may be more common.
The paper tests Google’s Population Dynamics Foundation Model (PDFM) in five public-health tasks across the United States, Canada, Mexico, and the Democratic Republic of the Congo (DRC).
2. What questions did the researchers ask?
The researchers wanted to know whether information about places could improve health predictions. They asked questions such as:
- Can information from Canada improve predictions about vaccination rates in nearby U.S. counties?
- Can AI-generated place information help estimate heart-disease deaths before official statistics become available?
- Can it improve short-term forecasts of dengue outbreaks in Mexico?
- Can it help predict which areas in the DRC may soon experience cholera outbreaks?
- Can geographic information improve predictions of postpartum depression in individual mothers?
They also wanted to find out when the model helps and when it does not. In particular, they tested whether the model could replace traditional information, such as census surveys or personal socioeconomic details.
3. How did the researchers conduct the study?
Creating “place fingerprints”
The PDFM collected many different kinds of information about locations. Instead of using each piece of information separately, the AI combined them into numerical descriptions called embeddings.
An embedding is like a long list of numbers that summarizes a place. For example, two towns might have similar embeddings if they have similar weather, transportation patterns, buildings, and online activity.
The researchers then added these place fingerprints to regular statistical and machine-learning models.
Testing five health problems
The study included five main experiments:
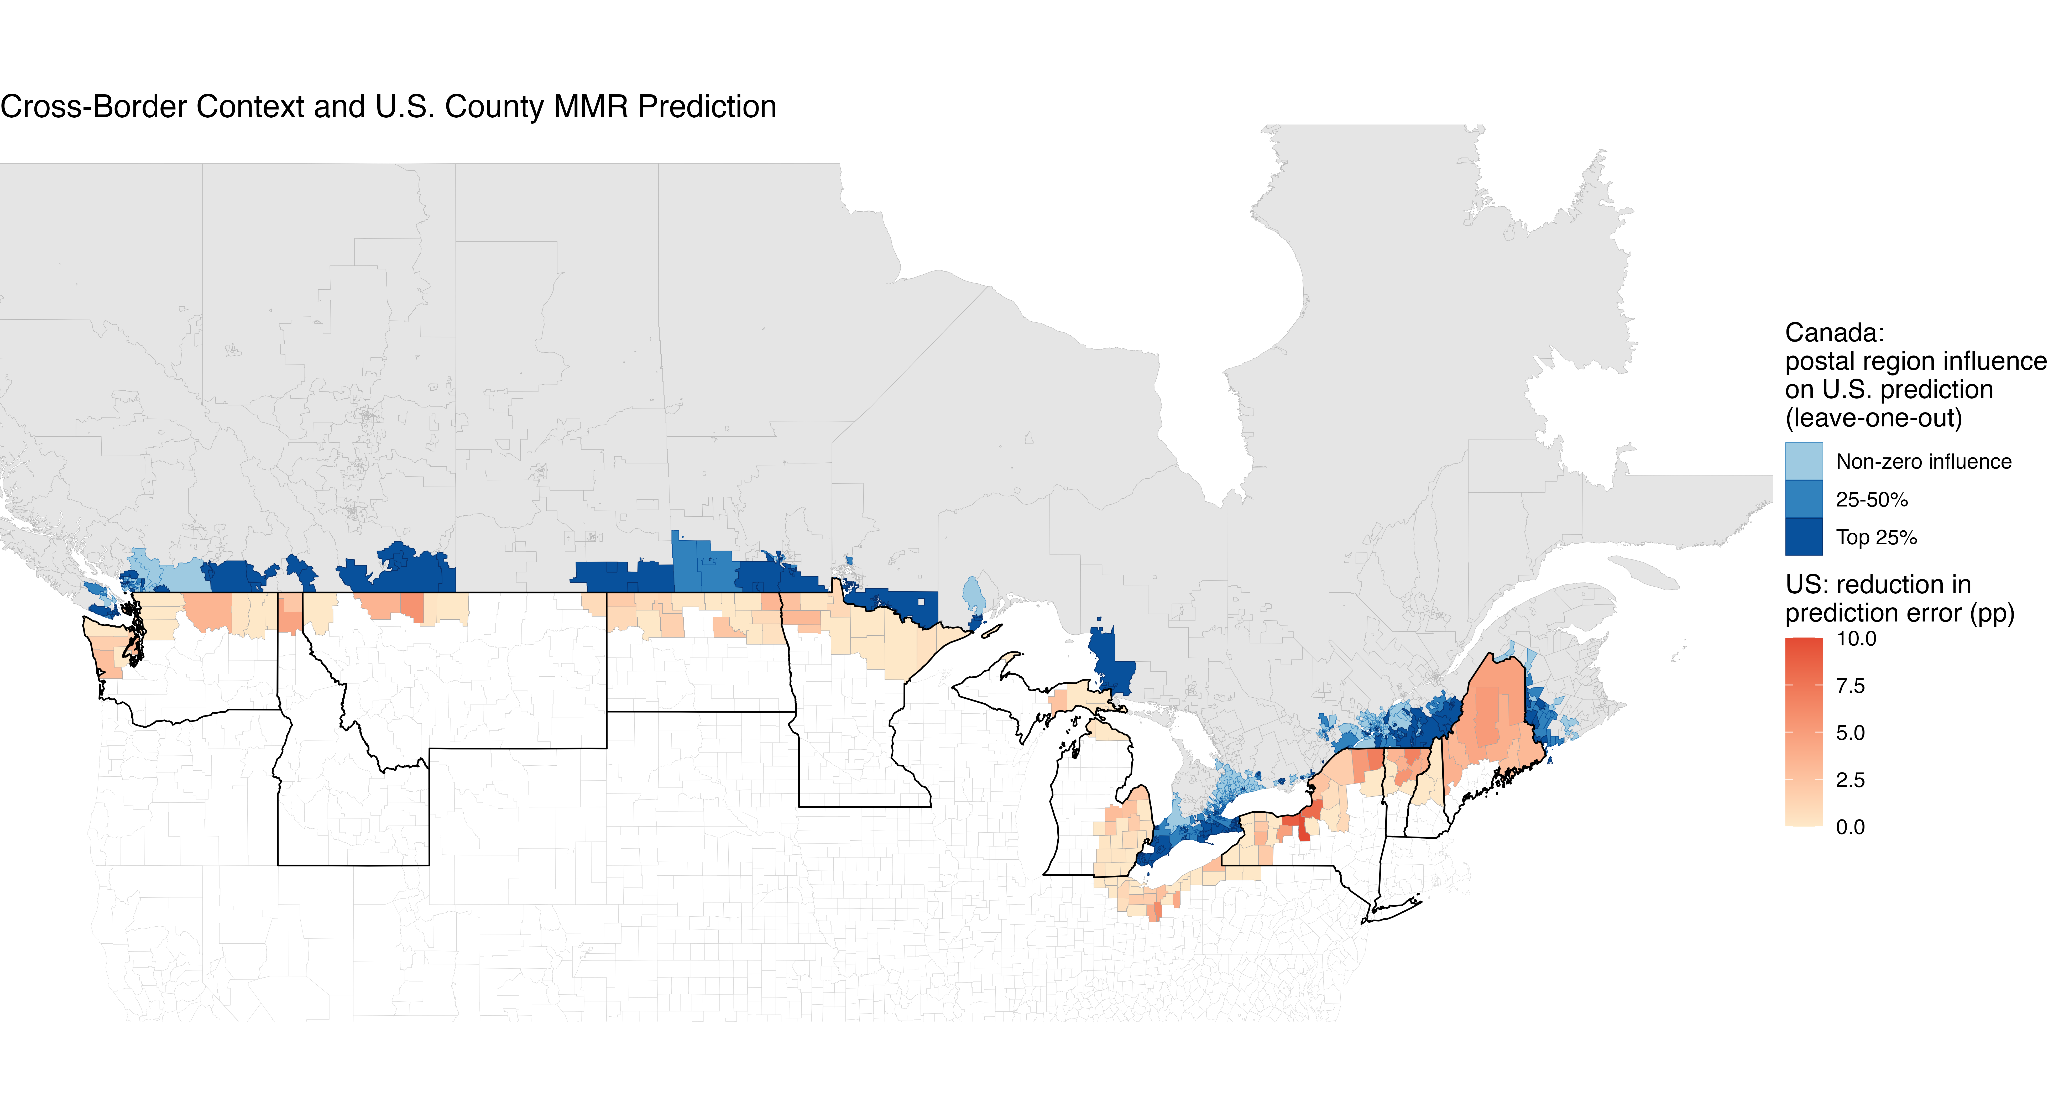
- Vaccination near the U.S.–Canada border The researchers predicted MMR vaccination rates in U.S. counties. They compared models using only U.S. information with models that also used information from nearby Canadian areas.
- Cardiovascular disease in the United States Official heart-disease death statistics can take one or two years to become complete. The researchers tested whether monthly PDFM information could help estimate current death rates sooner.
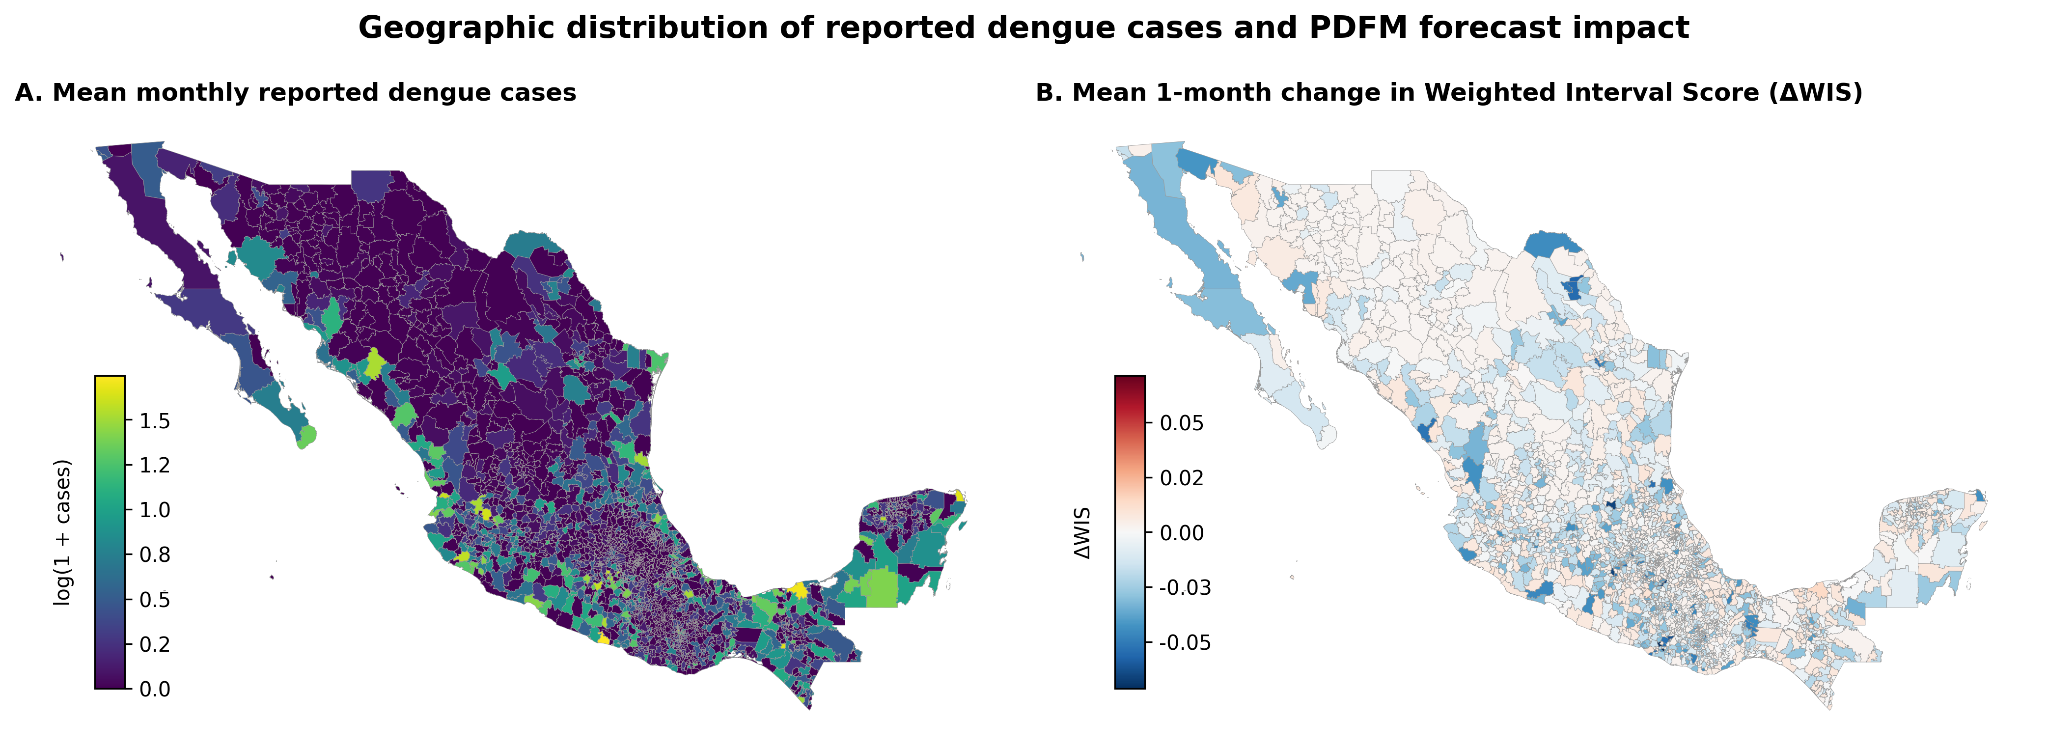
- Dengue in Mexico They predicted dengue cases in about 2,450 Mexican municipalities one, three, and six months ahead.
- Cholera in the DRC They predicted which of 403 health zones might experience a cholera outbreak one, two, four, or eight weeks in the future.
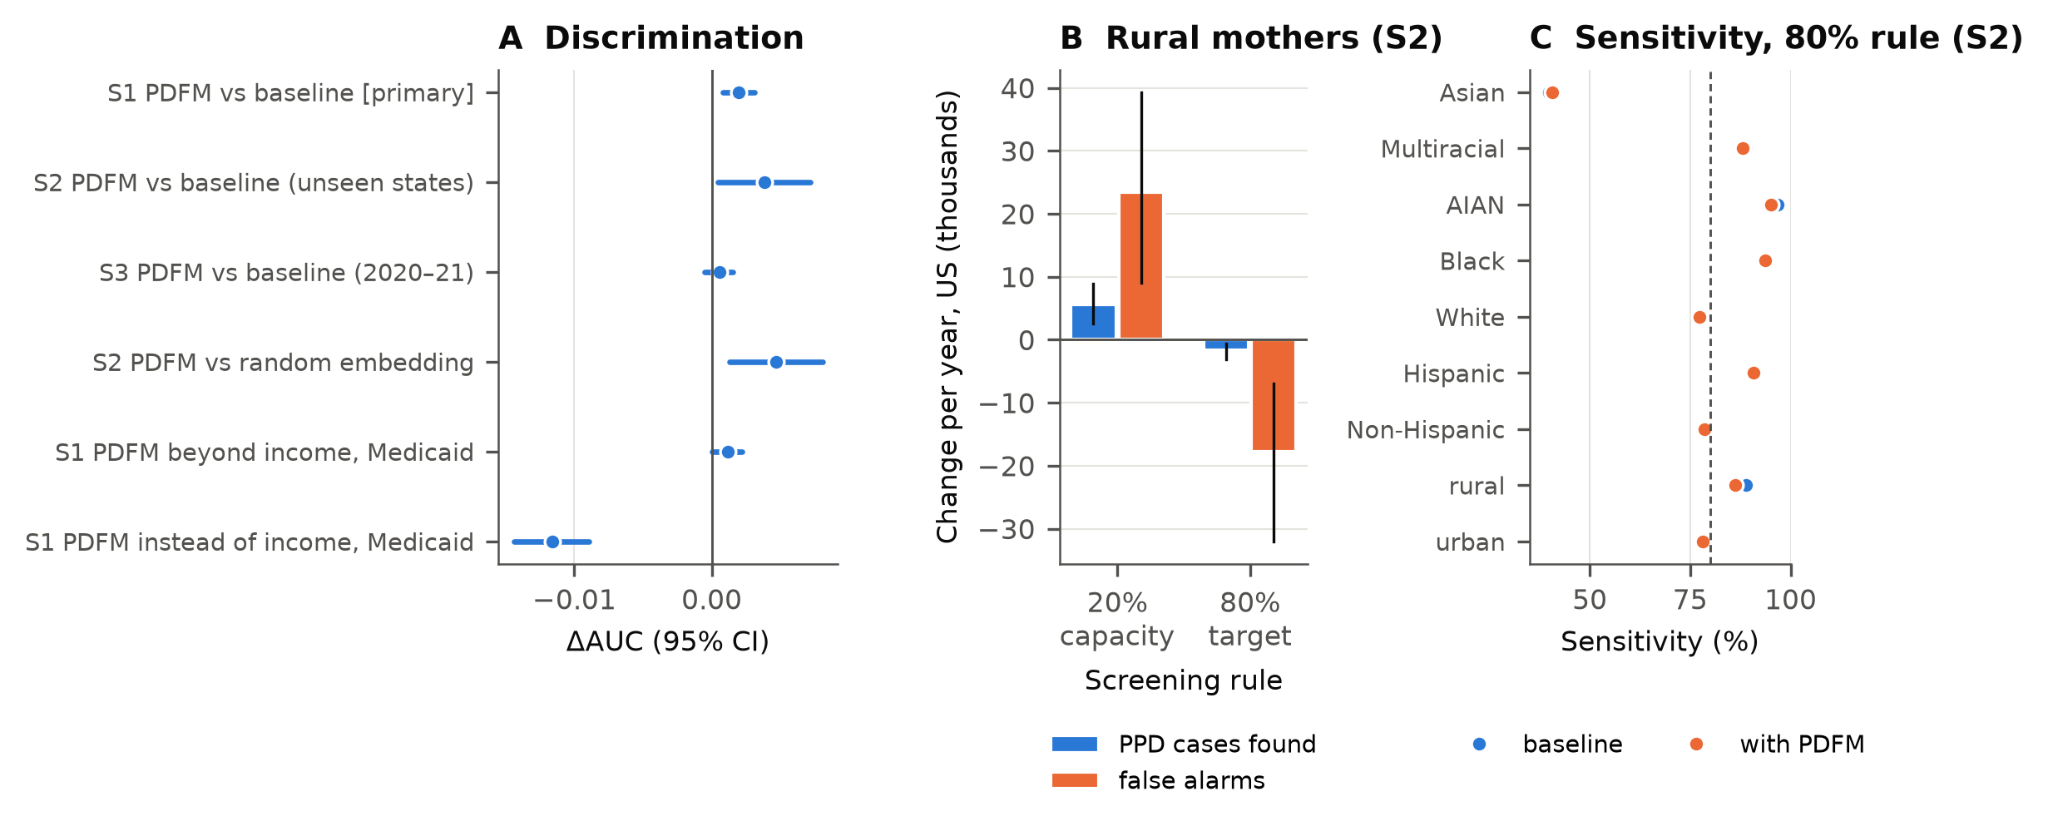
- Postpartum depression in the United States They studied whether geographic information could improve predictions of depression symptoms after childbirth. They also tested whether place information could replace personal information such as household income and health insurance.
Measuring accuracy
The researchers compared models with and without PDFM information. They used measures of prediction error, which are similar to checking how far a student’s guesses are from the correct answers.
For example:
- MAE measures the average size of the mistakes.
- RMSE gives extra importance to very large mistakes.
- Precision@5 measures how often the five highest-risk locations really experienced an outbreak.
- PR-AUC measures how well a model finds rare events, such as cholera outbreaks.
The researchers also used tests of statistical significance. These tests help determine whether an improvement is probably real or might have happened by chance.
4. What did the researchers find?
A. Information from across borders improved vaccination predictions
For U.S. counties near Canada, adding information from nearby Canadian regions improved predictions of MMR vaccination rates.
The improvement was especially important in border counties. For example, the model’s explained variation increased from 0.159 to 0.216, an improvement of about 36%.
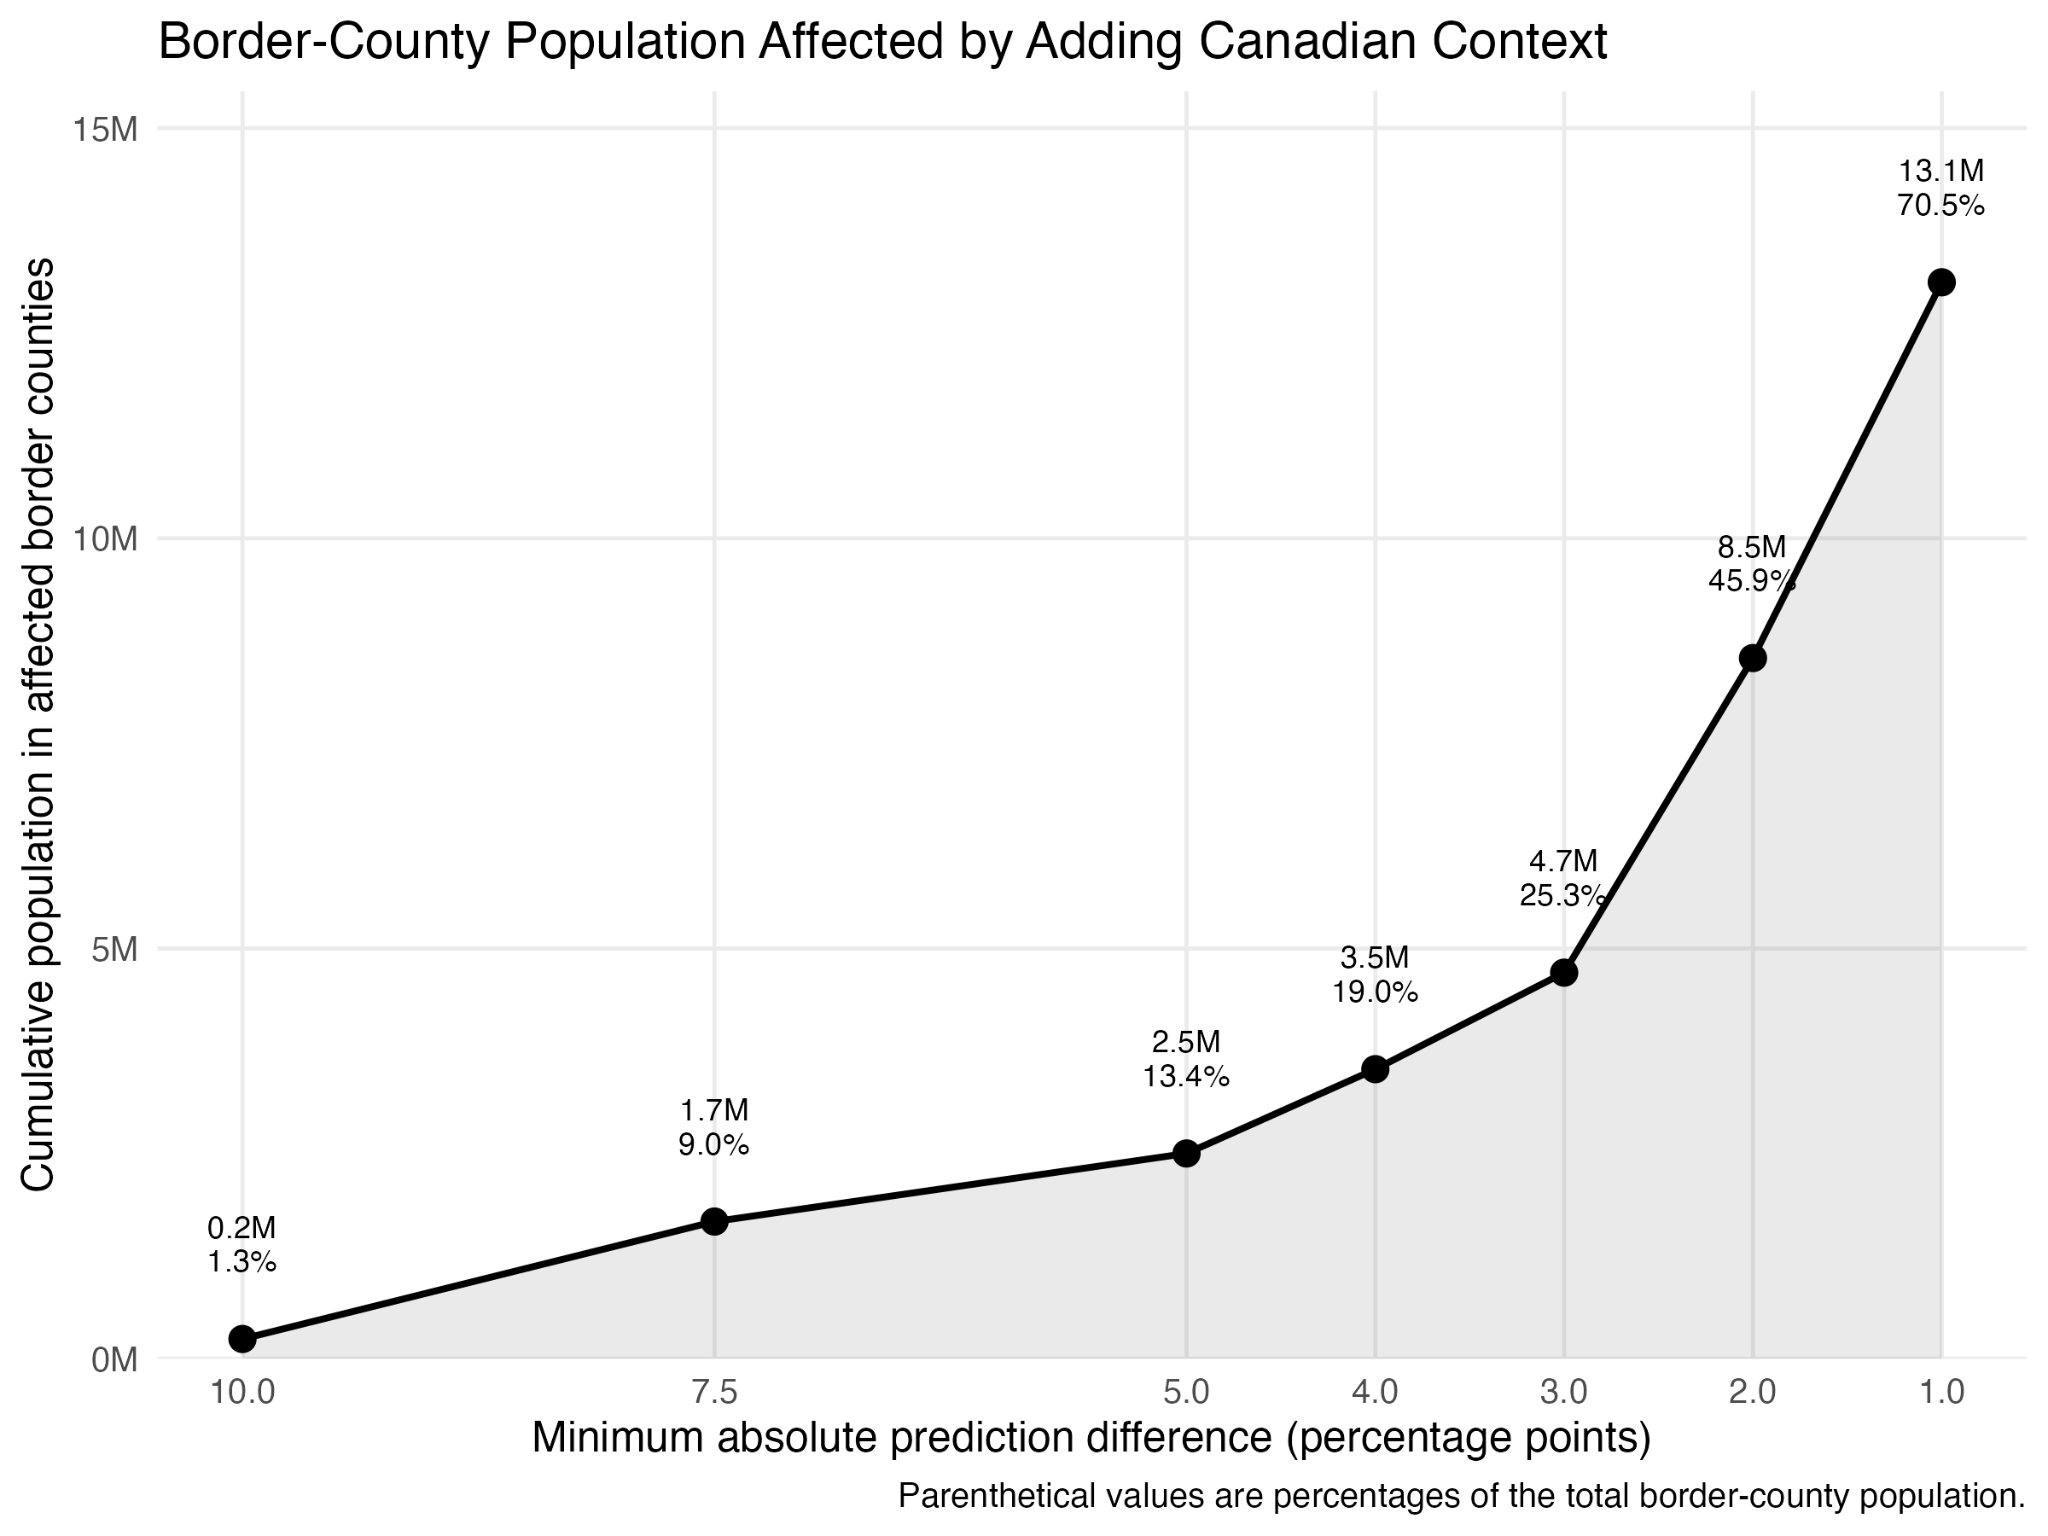
The Canadian information changed predictions by at least:
- 5 percentage points for about 2.5 million people
- 3 percentage points for about 4.7 million people
- 1 percentage point for about 13.1 million people
This suggests that people near a border may be influenced by events and behaviors on the other side. National health models can miss these connections because they stop at country boundaries.
B. Monthly place information helped estimate heart-disease deaths
The PDFM information performed about as well as traditional census-based information when estimating cardiovascular disease deaths.
This is important because census information may be based on surveys collected over several years and may be released many months later. In contrast, the PDFM information could be updated every month.
For nowcasting, which means estimating what is happening right now using incomplete information, models worked best when they used both:
- Traditional socioeconomic information
- PDFM place information
This does not mean the AI made census data unnecessary. Instead, it showed that the AI could be a useful and faster alternative when updated survey information is not available.
C. The model improved short-term dengue predictions
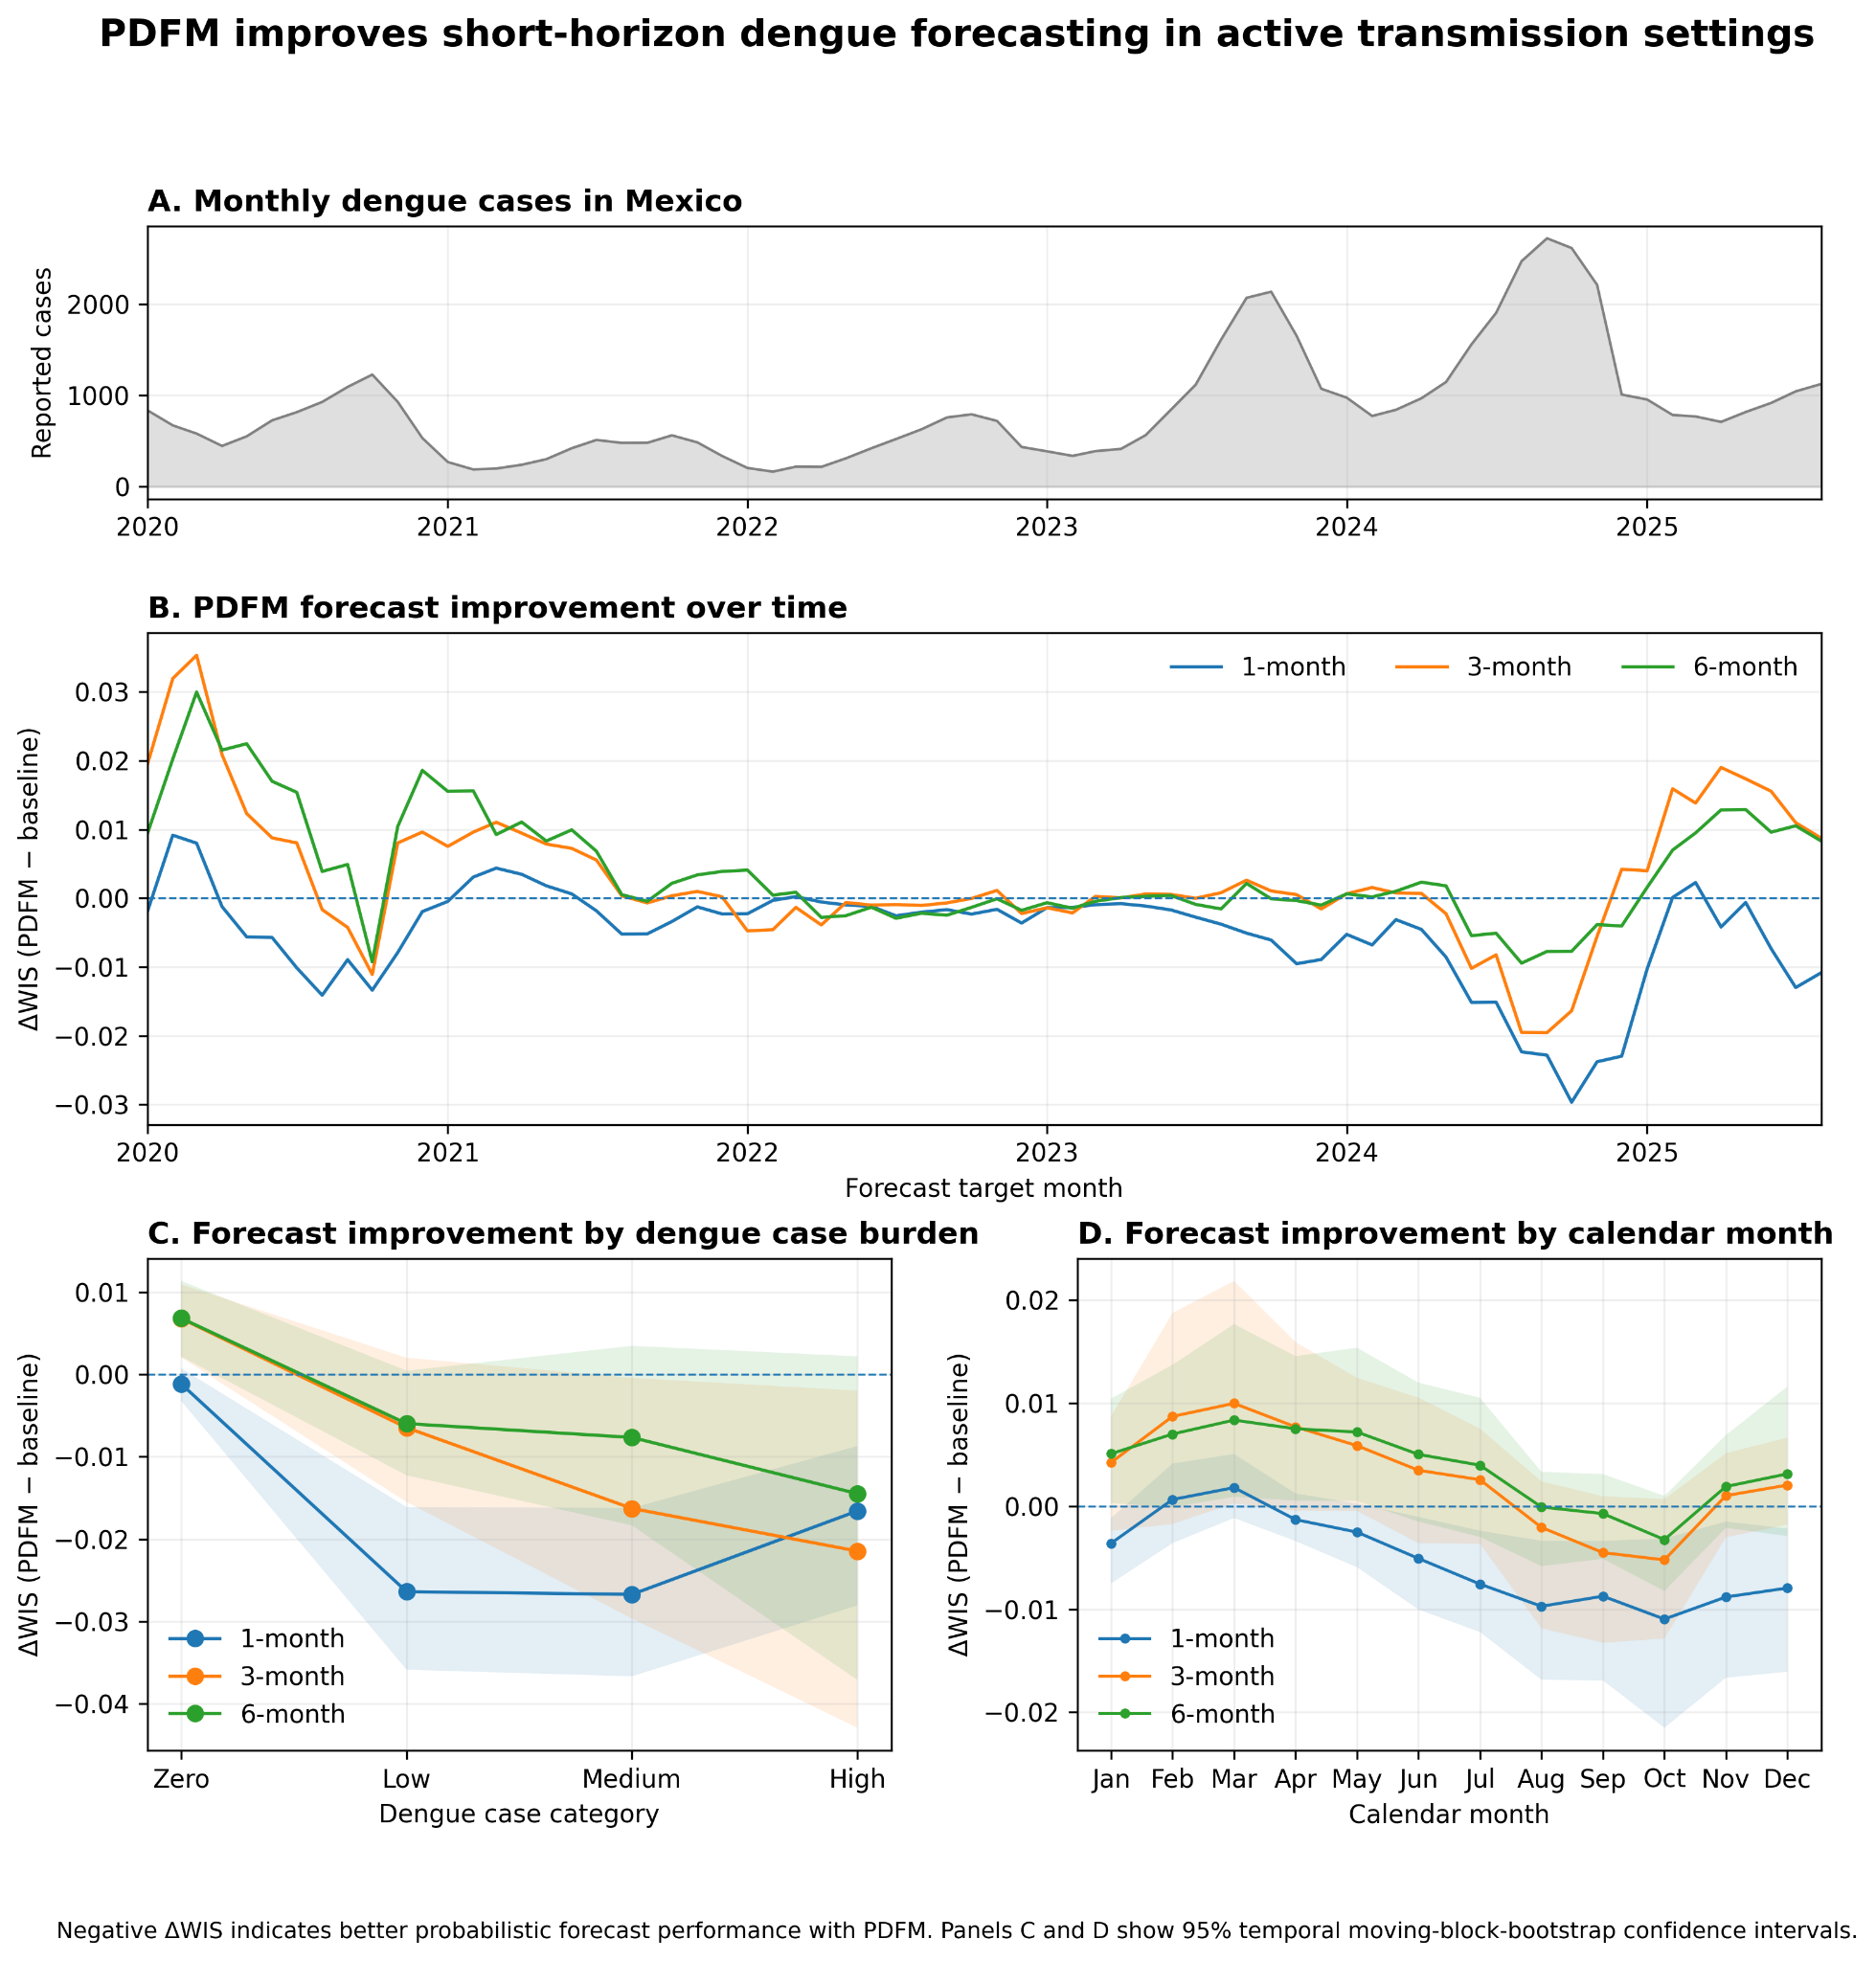
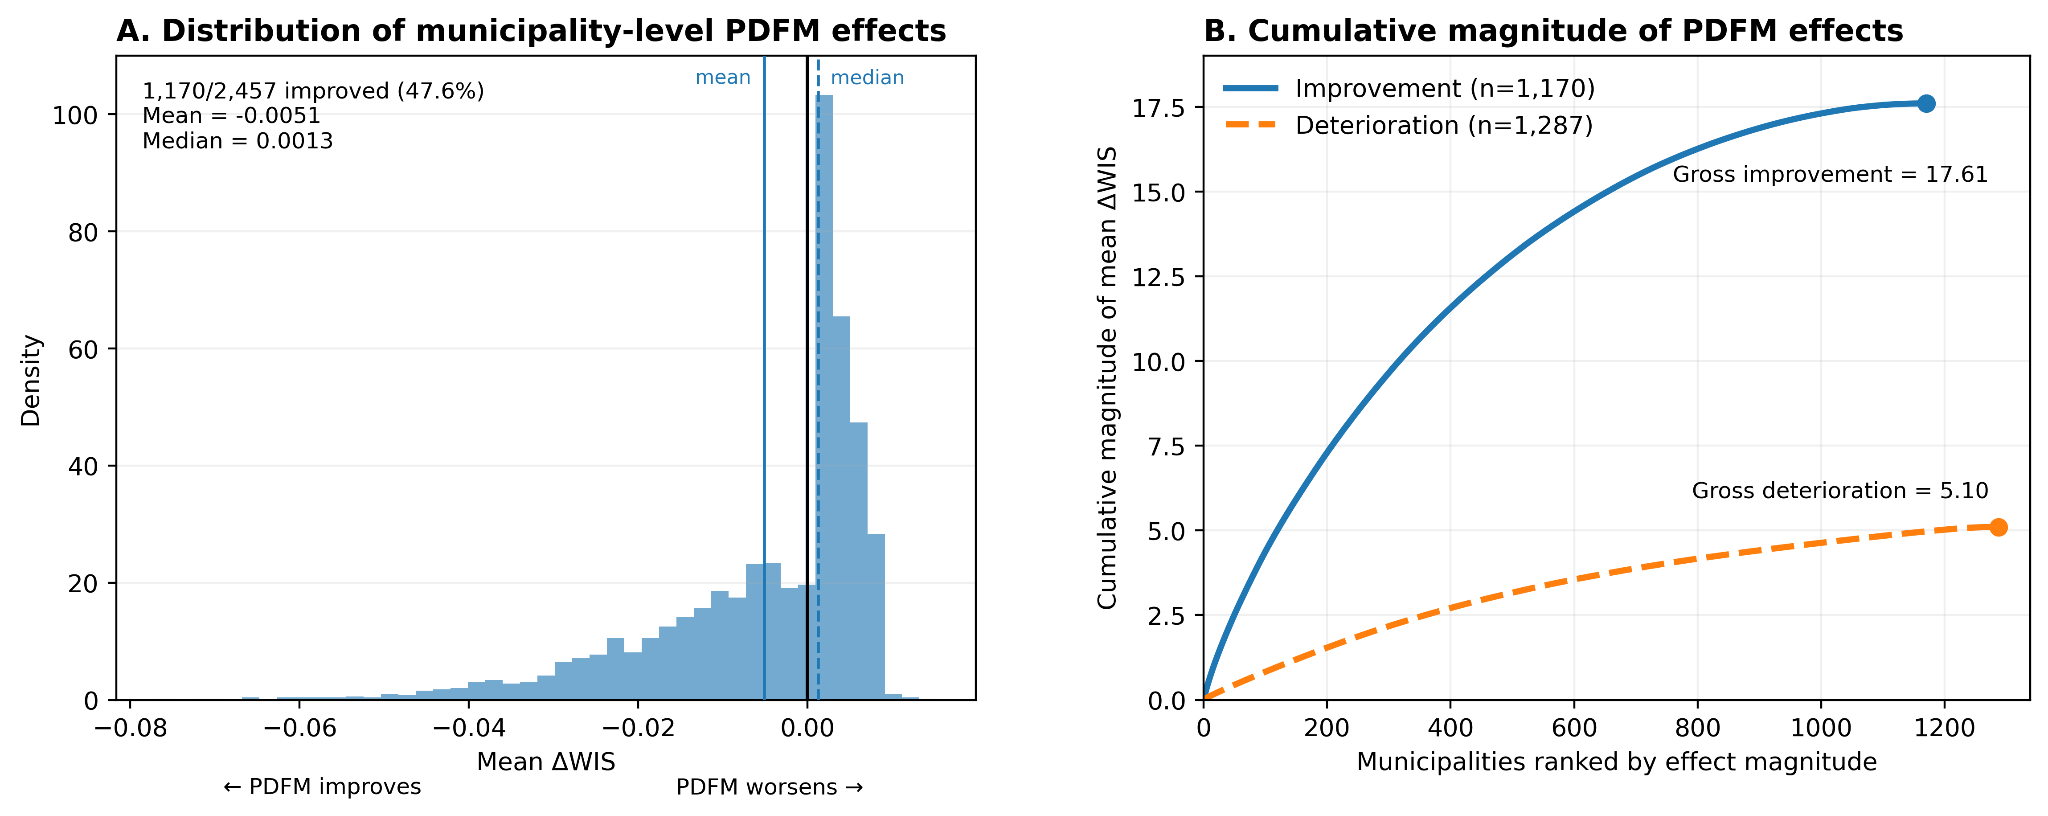
In Mexico, adding PDFM information improved forecasts of dengue cases one month ahead.
The benefit was strongest in municipalities where dengue was already spreading. The model helped less in places with no current cases.
However, the improvement did not clearly continue at three- or six-month horizons. One reason is that long-term dengue levels depend on future weather and mosquito conditions, which a fixed place fingerprint cannot fully predict.
In simple terms, the model was useful for answering:
“Where might dengue get worse next month?”
It was less useful for answering:
“What will dengue look like six months from now?”
D. The model helped predict cholera hotspots several weeks ahead
For cholera in the DRC, recent case numbers were already useful for predicting outbreaks one or two weeks ahead.
The PDFM information became more helpful at longer distances:
- At four weeks ahead, the model’s overall performance improved.
- At eight weeks ahead, it better identified the five health zones most likely to experience an outbreak.
At eight weeks, the percentage of the top five predicted zones that actually experienced an outbreak increased from about 35.6% to 42.0%.
This could give health workers extra time to move supplies, prepare treatment centers, and place clean-water or rehydration resources where they may be needed.
The biggest improvements occurred in areas where cholera was already common, called endemic areas.
E. Geographic information helped with postpartum-depression prediction, but only partly
The paper’s final case study examined individual-level risk of postpartum depression.
The geographic information added some useful information when predicting risk in U.S. states that the model had not seen before. However, it could not replace personal socioeconomic information, such as income and insurance status.
The study also found that geographic information did not automatically remove differences in prediction quality between demographic groups.
This is an important limitation. A place-based AI model can describe general conditions in an area, but it cannot fully describe an individual person’s experiences, health history, financial situation, or support system.
5. Why are these findings important?
Traditional public-health systems often have three major problems:
- Data may not be available for every location.
- Official health statistics may arrive too late.
- Models built for one disease or country may not work well elsewhere.
The study suggests that geospatial foundation models may help fill some of these gaps. They can provide information about places even when detailed health data are missing or delayed.
Their greatest value seems to be as an extra layer of information, rather than as a replacement for existing health records. They can help public-health teams:
- Notice risks earlier
- Predict outbreaks in specific locations
- Plan where to send vaccines, medicine, or staff
- Understand how nearby regions influence one another
- Make useful predictions in places with limited data
6. What could this mean for the future?
This research suggests that AI could make public-health surveillance faster and more flexible. Instead of waiting years for complete surveys or official death statistics, health agencies might use frequently updated information about places to make earlier decisions.
For example, officials could use these models to:
- Prepare for a cholera outbreak several weeks in advance
- Focus mosquito-control efforts in dengue hotspots
- Identify areas where vaccination coverage may be falling
- Estimate current heart-disease patterns before final records are available
However, the paper also shows that these models have limits. They do not always improve predictions, especially far into the future. They cannot replace personal medical or socioeconomic information, and they do not automatically solve unfairness or demographic gaps in health care.
Overall, the main message is that geospatial AI can be a powerful assistant for public health. It works best when combined with traditional data, expert knowledge, and careful checks for accuracy and fairness.
Knowledge Gaps
Knowledge gaps, limitations, and open questions
- Causal mechanisms remain unidentified: The studies show predictive associations between PDFM embeddings and health outcomes, but do not establish which behavioral, environmental, mobility, or socioeconomic signals drive the observed improvements.
- Operational impact is not evaluated: The paper does not test whether PDFM-supported forecasts improve real-world decisions, such as vaccination campaigns, vector control, cholera supply pre-positioning, or cardiovascular prevention, or whether they reduce morbidity, mortality, or response costs.
- External generalizability is uncertain: Most evaluations focus on four countries and a limited set of diseases; performance in other regions, health systems, climates, languages, epidemiological settings, and political contexts remains unresolved.
- The representativeness of underlying data is unclear: Aggregated search, mobility, mapping, busyness, weather, and air-quality signals may systematically underrepresent populations with limited internet access, smartphones, digital services, or formal mobility records.
- Performance across marginalized populations is insufficiently characterized: The analyses do not comprehensively assess whether PDFM embeddings perform differently for rural communities, Indigenous populations, migrants, displaced people, low-income groups, or populations affected by the digital divide.
- Fairness and harm from geographic proxies remain open questions: Place-level embeddings may encode structural inequalities or protected characteristics indirectly, but the paper does not fully quantify disparate error rates, calibration, or potential discriminatory consequences across demographic and socioeconomic groups.
- Fine-grained demographic evaluation is limited: The postpartum-depression analysis uses state-by-urban/rural embeddings and reports that geographic context does not eliminate demographic gaps, but it does not determine which embedding components contribute to those disparities or how to mitigate them.
- Spatial aggregation may produce ecological bias: Embeddings are assigned to counties, municipalities, health zones, or state-by-urban/rural locations, while outcomes may vary substantially within those units; the consequences of within-area heterogeneity and the modifiable areal unit problem are not examined.
- Individual-level clinical utility is not established: In the postpartum-depression case, adding geographic context to individual risk prediction does not demonstrate improved screening, diagnosis, referral, treatment engagement, or patient outcomes.
- The paper does not compare PDFM with strong contemporary alternatives across all tasks: Comparisons are generally against selected baselines, such as ACS covariates, historical surveillance, or TimesFM, rather than a consistent set of spatial, spatiotemporal, remote-sensing, mobility, epidemiological, and deep-learning models.
- The value of individual embedding dimensions is unexplored: The analyses use high-dimensional fixed embeddings, but do not establish which dimensions are informative, whether dimensionality reduction improves stability, or whether simpler engineered covariates achieve comparable performance.
- Model robustness to embedding version changes is uncertain: Although dengue results were compared using October 2023 and October 2025 snapshots, systematic version-to-version drift, backward incompatibility, and changes in data sources or preprocessing are not evaluated.
- Historical temporal alignment remains a major limitation: The dengue analysis primarily uses a static October 2023 embedding snapshot, and the cholera analysis excludes periods potentially affected by embedding data leakage; the benefit of genuinely time-varying historical embeddings is therefore unresolved.
- Real-time data latency and availability are not quantified: The paper claims operational timeliness but does not report end-to-end latency, missing-data rates, update failures, or how quickly embeddings could be delivered during an active emergency.
- Long-horizon forecasting remains weak: PDFM improves dengue forecasts primarily at one month and cholera forecasts mainly at four to eight weeks, but its usefulness beyond these horizons and under major seasonal or structural transitions is unclear.
- Forecast performance during unprecedented events is unknown: The evaluations do not establish whether embeddings help during novel pathogen emergence, extreme climate events, conflict-driven displacement, abrupt migration, or other distribution shifts not represented in training data.
- Rare-event performance requires further validation: Cholera emergence is highly imbalanced, and improvements in PR-AUC and Precision@5 are based on one prospective period; sensitivity to event definitions, base rates, alert thresholds, and alternative operational metrics remains uncertain.
- Dengue results may be affected by retrospective stratification: Forecast benefit is analyzed using the observed target-month case burden, which is unavailable at prediction time; prospective methods for identifying municipalities likely to benefit are not developed or validated.
- Calibration and decision thresholds are underdeveloped: The paper emphasizes RMSE, MAE, WIS, PR-AUC, and Precision@5, but provides limited evidence on probability calibration, prediction-interval coverage, alert thresholds, and expected utility under different intervention capacities.
- Uncertainty propagation is incomplete: The analyses do not fully propagate uncertainty from embedding construction, spatial aggregation, missing data, outcome reporting, and downstream model estimation into final public-health predictions.
- Outcome data quality and reporting bias are insufficiently examined: Underreporting, revisions, suppression, diagnostic access, and surveillance intensity may vary across locations and time, potentially allowing embeddings to learn reporting patterns rather than true disease incidence.
- Cross-border transferability is demonstrated only for one border and one outcome: The MMR analysis does not determine whether the cross-border signal persists along other international borders, for other vaccine-preventable diseases, or when mobility and media relationships are weaker.
- Cross-border contextual features may introduce leakage or deployment constraints: The paper does not clarify whether all Canadian signals would be available consistently to U.S. public-health agencies, nor whether the model remains valid when neighboring-country data are delayed, restricted, or changed.
- Small-area cardiovascular mortality performance is unresolved: The results are reported largely in unnormalized death counts, causing large counties to dominate RMSE; performance for small counties, per-capita rates, age-adjusted mortality, and suppressed or noisy observations requires separate evaluation.
- The claimed replacement of survey covariates is not fully established: PDFM matches selected ACS measures in some tasks, but the study does not assess whether it preserves subgroup-specific socioeconomic information, supports policy interpretation, or remains reliable when ACS data are intentionally absent across diverse time periods.
- Model portability across administrative boundaries is untested: It remains unknown whether embeddings can support changing boundaries, irregular health-zone definitions, informal settlements, nomadic populations, or locations lacking reliable geocoding.
- Privacy risks are not empirically assessed: The paper describes the data streams as privacy-preserving but does not provide formal privacy guarantees, membership-inference testing, re-identification analysis, or evaluation of risks from combining multiple geospatial signals.
- Interpretability for public-health users is limited: The paper identifies influential regions and reports aggregate feature effects, but does not provide actionable explanations for why a specific location receives a high-risk prediction or how officials should distinguish causal risk factors from predictive proxies.
- Resource and infrastructure requirements are not reported: The feasibility of deploying PDFM-based workflows in low-resource settings is unclear, including computational cost, connectivity requirements, licensing, technical support, and dependence on proprietary infrastructure.
- Reproducibility is constrained: The embeddings, preprocessing pipelines, underlying multimodal data, and possibly some downstream code are not described as fully available, limiting independent replication and audit.
- Prospective validation periods are relatively short: The cholera prospective evaluation covers 89 weeks and the dengue evaluation covers approximately 68 months with major changes in disease activity; longer multi-year validation is needed to assess durability and performance drift.
- Transfer learning boundaries are not systematically mapped: The paper presents several successful and unsuccessful applications, but does not identify in advance which disease characteristics, spatial scales, data regimes, or forecast horizons predict whether PDFM will add value.
- The effect of fine-tuning remains unknown: All evaluations use fixed embeddings without task-specific fine-tuning, so it is unclear whether fine-tuning would substantially improve performance, worsen transferability, increase overfitting, or reduce interpretability.
- Comparative cost-effectiveness is unresolved: The paper does not compare the cost of generating and maintaining PDFM features with collecting surveys, improving surveillance systems, or using simpler locally tailored models.
- Failure modes and safeguards are not sufficiently specified: The work does not establish when practitioners should disregard PDFM predictions, how to detect distribution shift, or what governance procedures should apply when forecasts conflict with local epidemiological knowledge.
Practical Applications
Immediate Applications
The paper supports using planetary geospatial foundation-model embeddings as complementary covariates in existing epidemiological and public-sector workflows. The findings do not support replacing clinical data, conventional surveillance, or local public-health expertise.
- Border-region vaccination surveillance and outreach — Public health, immunization
- Add cross-border geospatial embeddings to county- or district-level models for estimating MMR and other vaccination coverage near international borders.
- Health departments could use the resulting maps to identify communities where estimated coverage changes materially when neighboring-country context is included. This could guide mobile vaccination clinics, school outreach, multilingual communications, and cross-border coordination.
- This is especially actionable for regions with substantial population mobility, shared media markets, or economic integration.
- Dependencies: Requires access to appropriately aggregated cross-border signals, reliable vaccination benchmarks, privacy-preserving data governance, and validation against local records. Canadian context improved U.S. border-county predictions but did not substitute for domestic covariates.
- Monthly cardiovascular disease surveillance and resource allocation — Healthcare, public health analytics
- Incorporate monthly PDFM embeddings into Bayesian spatial models or gradient-boosted models to nowcast county-level cardiovascular mortality while official mortality data are delayed.
- State and local health agencies could use these estimates to update prevention priorities, deploy blood-pressure screening, target smoking-cessation programs, allocate cardiology capacity, and identify counties warranting investigation.
- Embeddings can also support spatial interpolation for counties with missing or suppressed observations.
- Dependencies: Estimates should be treated as provisional decision support rather than official mortality counts. Models require calibration, uncertainty intervals, population offsets, historical outcomes, and monitoring for changes in the relationship between geospatial signals and mortality. Combining PDFM with ACS variables was generally strongest for nowcasting.
- Short-horizon dengue outbreak response — Public health, vector control
- Add PDFM embeddings to one-month probabilistic dengue forecasts for Mexican municipalities, particularly where transmission is already active.
- Municipal response teams could use forecast distributions to prioritize larval-source reduction, insecticide spraying, community alerts, diagnostic supplies, and clinical preparedness.
- Operational dashboards could display baseline and PDFM-adjusted forecasts, forecast intervals, and municipality-specific changes in risk.
- Dependencies: Benefits were clearest at a one-month horizon and in municipalities with active transmission; performance was heterogeneous, with fewer than half of municipalities improving on average. Forecasts should therefore be evaluated locally and used with observed case reports, meteorology, and entomological surveillance. Static embeddings are insufficient for longer seasonal transitions.
- Cholera hotspot shortlists for pre-positioning — Humanitarian response, infectious-disease control
- Use history-plus-PDFM models to rank health zones in the Democratic Republic of the Congo by expected cholera emergence four to eight weeks ahead.
- Humanitarian organizations could use a “top five zones” workflow to pre-position oral rehydration supplies, cholera treatment kits, laboratory materials, water-treatment resources, and temporary treatment capacity.
- The reported improvement in Precision@5 at four- and eight-week horizons directly aligns with the way emergency teams prioritize a small number of locations under resource constraints.
- Dependencies: Models require timely and sufficiently consistent surveillance, clear definitions of emergence, secure data-sharing arrangements, and human review. Rare-event prediction produces false positives and should not be used to deny resources to unranked areas. At one- to two-week horizons, recent case history was already highly informative and PDFM offered little consistent benefit.
- Surveillance dashboards that combine place representations with existing models — Software, government technology
- Build reusable APIs or dashboard components that supply geospatial embeddings to negative-binomial models, Bayesian spatial models, gradient-boosted trees, and time-series systems.
- This could reduce the need to train a separate representation model for every disease or geography and enable a common feature layer for immunization, mortality, dengue, cholera, and other surveillance tasks.
- A practical workflow would include embedding retrieval, geographic aggregation, model scoring, uncertainty visualization, drift monitoring, and comparison with a baseline model.
- Dependencies: Requires stable embedding production, documented geographic boundaries, versioning, access controls, compute infrastructure, and reproducible validation. Embeddings should not be inserted indiscriminately at full dimensionality; the paper shows that stacking many dimensions without shrinkage can increase variance.
- Timely socioeconomic and environmental situational awareness — Public policy and academic research
- Use monthly geospatial embeddings as a rapid contextual signal between releases of censuses, surveys, and official socioeconomic statistics.
- Policymakers could use them to detect changes in population activity, built environment, mobility, weather, and air quality that may affect health-service demand.
- Researchers could use them to update epidemiological models when conventional covariates are stale or unavailable.
- Dependencies: The embeddings are proxies rather than direct measurements of income, race, housing quality, or health status. They require validation for each policy use and should not be interpreted as causal socioeconomic indicators.
- Geographically informed postpartum-depression screening support — Healthcare and maternal health
- Add coarse place-level embeddings as one contextual feature in population-level maternal mental-health risk models or care-planning systems.
- Health systems could use such models to estimate where additional postpartum behavioral-health capacity, screening outreach, telehealth, or community-support services may be needed.
- The paper’s results indicate that geographic context can provide a transferable signal in some unseen states, but it does not replace individual socioeconomic information.
- Dependencies: This should not be used as a stand-alone diagnosis or to determine an individual’s eligibility for care. Individual clinical, socioeconomic, and psychosocial data remain essential; demographic performance gaps were not eliminated. Consent, fairness audits, explainability, and clinician oversight are required.
- Academic benchmarking of transferable geospatial representations — Academia and model development
- Establish benchmarks that compare geospatial embeddings with census variables, lagged outcomes, mobility data, and disease-specific models across spatial extrapolation, interpolation, nowcasting, and forecasting.
- Researchers can use the paper’s five task types as a template for evaluating transfer across diseases, countries, spatial scales, and forecast horizons.
- Dependencies: Evaluation must use prospective or temporally separated data, prevent leakage from embedding snapshots, report uncertainty and subgroup performance, and distinguish statistical improvement from operational usefulness.
Long-Term Applications
The following applications are plausible extensions of the findings but require additional research, historical data, prospective validation, infrastructure, or regulatory development.
- Global early-warning systems for multiple infectious diseases — Global health, public policy
- Develop a multi-disease platform that combines geospatial foundation-model representations with surveillance data for measles, dengue, cholera, malaria, respiratory infections, and other conditions.
- Such a platform could identify emerging hotspots, estimate cross-border spillovers, and provide lead-time-specific alerts to ministries of health and international agencies.
- Dependencies: Requires disease-specific validation, standardized reporting across countries, historical embedding archives, robust handling of missing data, and safeguards against alert fatigue. Performance may vary substantially by disease, geography, season, and reporting quality.
- Cross-border regional health intelligence — International policy and emergency preparedness
- Build models that explicitly represent mobility and behavioral spillovers across national boundaries for vaccination, respiratory infections, vector-borne disease, and health-service demand.
- Governments could coordinate vaccination campaigns, border-region surveillance, laboratory capacity, and emergency communications using shared regional risk maps rather than country-specific estimates.
- Dependencies: Requires international data agreements, compatible privacy standards, careful treatment of border populations, and mechanisms to prevent models from being used to stigmatize migrants or particular communities.
- Dynamic, temporally aligned disease forecasting — Public health operations and AI infrastructure
- Create historical archives of monthly or weekly embeddings so models can use the geospatial context that existed at each forecast origin rather than a later static snapshot.
- This would enable more rigorous backtesting, reduce possible temporal leakage, and distinguish durable geographic characteristics from transient population behavior or environmental conditions.
- Dependencies: Requires long-term retention policies, computational storage, stable feature definitions, versioned models, and documented provenance for every embedding release.
- Adaptive vector-control and environmental-health systems — Environmental management, robotics, public health
- Link short-horizon dengue forecasts to automated or semi-automated workflows for allocating inspection teams, scheduling mosquito-control operations, and targeting environmental remediation.
- In the longer term, forecasts could guide field robotics, drone-based mapping, or sensor placement for standing water and vector habitats.
- Dependencies: Requires high-resolution local validation, integration with entomological and weather data, operational rules that account for uncertainty, and evidence that forecast-guided interventions improve health outcomes rather than merely forecast accuracy.
- Humanitarian logistics optimization — Emergency management and supply chains
- Extend cholera hotspot prediction into optimization systems that determine where to place treatment kits, mobile clinics, water purification units, laboratories, and response personnel under budget and transport constraints.
- The system could combine predicted risk, road accessibility, population displacement, health-facility capacity, and delivery time.
- Dependencies: Requires reliable infrastructure and displacement data, conflict-sensitive operations, transparent prioritization rules, and field trials. A predictive ranking should not override urgent reports from local responders.
- Population-health digital twins and scenario planning — Government, academia, health systems
- Use geospatial representations as contextual layers in simulations of how environmental changes, mobility restrictions, migration, vaccination campaigns, or health-service disruptions could affect disease burden.
- These systems could support preparedness exercises and compare alternative allocation strategies before implementation.
- Dependencies: Foundation-model embeddings are predictive representations, not causal models. Scenario use requires causal identification, intervention data, calibrated simulation, and explicit uncertainty about policy effects.
- Earlier detection of chronic-disease and mental-health trends — Healthcare and social policy
- Extend monthly nowcasting beyond cardiovascular mortality to diabetes complications, respiratory disease, maternal mental health, suicide risk at the population level, and healthcare utilization.
- Health systems could use these estimates to anticipate demand for primary care, behavioral-health services, emergency care, or community interventions.
- Dependencies: Requires disease-specific outcome labels, careful distinction between population-level and individual-level prediction, validation across demographic groups, and safeguards against using place-level risk as a proxy for individual clinical risk.
- Privacy-preserving public-health data infrastructure — Software, privacy engineering, policy
- Develop standardized systems that provide aggregated geospatial representations without exposing individual search, mobility, or health records.
- Potential products include secure feature stores, privacy-audited model-serving APIs, federated evaluation environments, and data-use controls for public agencies.
- Dependencies: “Privacy-preserving” does not automatically mean risk-free. Re-identification assessment, minimum aggregation thresholds, access logging, independent audits, retention limits, and community consultation would be necessary.
- Fairness-aware deployment and bias monitoring — Responsible AI and health regulation
- Build monitoring tools that evaluate calibration, false-negative rates, geographic coverage, urban/rural performance, and demographic disparities as models are deployed.
- The postpartum-depression case particularly motivates systems that test whether place-level signals amplify or mask existing socioeconomic and demographic gaps.
- Dependencies: Requires access to sufficiently detailed evaluation data, legally and ethically appropriate subgroup analysis, transparent model cards, prospective monitoring, and mechanisms to suspend or revise models when performance deteriorates.
- Decision-support products for households and communities — Daily life and consumer health
- In a carefully limited form, aggregated forecasts could support public alerts about local dengue or cholera risk, vaccination campaigns, clinic availability, or recommended preventive actions.
- Community organizations could use localized risk information to organize outreach, clean-up activities, and support for vulnerable households.
- Dependencies: Public-facing communication would require high reliability, plain-language uncertainty reporting, protection against stigma and panic, accessibility across languages and digital-access levels, and coordination with official health authorities. Individual users should not infer personal disease risk solely from a neighborhood embedding.
Glossary
- Aedes-borne disease: Disease transmitted by mosquitoes of the Aedes genus, such as dengue. “fine-scale spatial variation in Aedes-borne disease burden across Mexican municipalities”
- Aggregated web search trends: Summary statistics of search activity used as population-level behavioral signals rather than individual records. “aggregated web search trends, human mobility patterns, built-environment characteristics”
- Air quality measurements: Data describing atmospheric pollutants and related environmental conditions. “meteorological conditions, and air quality measurements”
- Autoregressive: Describing a model or predictor that uses previous values of the same time series. “autoregressive recent case history was already sufficient”
- Benjamini–Hochberg adjustment: A procedure for controlling the false-discovery rate when conducting multiple statistical tests. “p-values are Benjamini--Hochberg adjusted within this table”
- Bayesian spatiotemporal model: A probabilistic model that represents uncertainty and incorporates spatial and temporal dependence using Bayesian inference. “negative binomial Bayesian spatiotemporal (Besag--York--Mollie) models”
- Bootstrap: A resampling method used to estimate uncertainty or confidence intervals from observed data. “95\% temporal moving-block-bootstrap CI”
- Built-environment characteristics: Features of human-made surroundings, such as buildings, roads, and infrastructure, that may influence behavior or health. “built-environment characteristics, meteorological conditions”
- Calibrated probability: A predicted probability whose numerical value corresponds reliably to the observed frequency of an outcome. “response teams do not work from calibrated probabilities”
- Cardiovascular disease mortality: Death caused by diseases affecting the heart or blood vessels. “temporal nowcasting of cardiovascular disease mortality”
- Case burden: The quantity or prevalence of disease cases in a population or geographic unit. “stratified by municipality-level case burden”
- Covariate: An input variable included in a statistical or machine-learning model to help explain or predict an outcome. “PDFM-derived covariates serve as a timely updating substitute”
- Cross-border behavioral spillover: The influence of behavior in one country or region on behavior in a neighboring jurisdiction. “capture behavioral spillovers to improve localized immunization forecasting”
- Demographic screening gap: Unequal performance or coverage in identifying health risks across demographic groups. “not replacing individual socioeconomic data or closing demographic screening gaps”
- Diebold–Mariano test: A statistical test for comparing the predictive accuracy of two competing forecasting methods. “Diebold--Mariano p < 0.001”
- Endemicity: The persistent or regularly recurring presence of a disease within a particular population or region. “stratified health zones by historical endemicity”
- Embedding: A numerical vector representation that encodes information about an entity, location, or context for use by computational models. “custom, low-resource 200-dimensional version of PDFM embeddings”
- Epidemiological surveillance: The systematic collection, analysis, and interpretation of health data to monitor disease patterns. “public health surveillance”
- Extrapolation: Prediction for locations or conditions outside the range represented in the training data. “cross-border extrapolation of vaccination trends”
- False-discovery rate: The expected proportion of incorrectly rejected null hypotheses among all rejected hypotheses. “p-values are Benjamini--Hochberg adjusted”
- Feature vector: An ordered numerical representation of attributes used as input to a machine-learning model. “producing geospatial feature vectors”
- Foundation model: A broadly pretrained model that can be adapted or applied to many downstream tasks. “a foundation model for geospatial inference”
- Gradient-boosted decision tree (GBDT): An ensemble model that sequentially combines decision trees, with each tree correcting errors made by earlier trees. “gradient-boosted decision trees (GBDT)”
- Ground-truth dataset: Data treated as the reference or observed outcome against which model predictions are evaluated. “dedicated model training and labeled ground-truth datasets”
- Health zone: A geographic administrative or surveillance unit used to organize public-health monitoring and intervention. “across 403 health zones in the DRC”
- Hotspot prediction: Forecasting which locations are likely to experience unusually high disease activity. “improving forecasts of cholera hotspots”
- Inverse-distance weighting: A spatial interpolation method that assigns greater influence to locations that are geographically closer. “using inverse-distance weighted spatial kernels”
- Interquartile range: The range between the 25th and 75th percentiles of a distribution. “the median municipality-level WIS was slightly worse (0.0013)”
- Leave-one-out procedure: An analysis in which one observation, region, or feature is removed at a time to assess its influence. “through a leave-one-out procedure”
- Mean absolute error (MAE): The average absolute difference between predicted and observed values. “Performance was assessed by MAE and RMSE”
- Multimodal data: Information collected in multiple forms or modalities, such as search, mobility, weather, and maps. “encoding multimodal search, mobility, and environmental signals”
- Negative binomial model: A statistical count model suitable for overdispersed event data in which the variance exceeds the mean. “negative binomial Bayesian spatiotemporal”
- Nowcasting: Estimating current or very recent conditions before complete official data become available. “spatial interpolation and temporal nowcasting of cardiovascular disease mortality”
- Offset: A term in a statistical count model that adjusts expected event counts for a known exposure, such as population size. “a population-based expected-count offset”
- Out-of-the-box: Usable without task-specific retraining or fine-tuning. “assess the foundation model's out-of-the-box representational value”
- Postpartum depression (PPD): Depression occurring during the period following childbirth. “individual-level risk prediction for postpartum depression”
- Precision@5: The proportion of the five highest-ranked predictions that correspond to actual positive events. “We therefore also measured Precision@5”
- Probabilistic forecasting: Forecasting that represents uncertainty by producing a distribution or interval of possible outcomes rather than a single value. “We produced probabilistic forecasts of new dengue cases”
- Prospective forecasting: Prediction performed on future data after a predefined cutoff, simulating real-world deployment. “prospective cholera emergence forecasts”
- PR-AUC: The area under the precision–recall curve, commonly used to evaluate classification with imbalanced classes. “with PR-AUC rising from 0.2832 to 0.3107”
- Quantile-specific model: A model designed to predict a particular quantile of an outcome distribution. “through horizon- and quantile-specific residual models”
- Risk stratification: Grouping individuals or locations according to their predicted likelihood of experiencing an adverse outcome. “individual-level risk stratification”
- Root mean squared error (RMSE): The square root of the average squared difference between predictions and observed values. “Performance was assessed by correlation, RMSE, MAE, and R”
- Self-supervised pre-training: Training a model to learn representations from the structure of unlabeled data rather than manually supplied target labels. “Through self-supervised pre-training at the planet level”
- Spatial interpolation: Estimating values at unobserved locations using information from observed locations. “spatial interpolation, where mortality data are observed for some counties but not others”
- Spatial kernel: A mathematical function that determines how the influence of one geographic location decreases with distance. “inverse-distance weighted spatial kernels”
- Spatial random effect: An unobserved model component representing geographic dependence or location-specific variation. “Bayesian baselines used spatial random effects”
- Spatial smoothing: A technique that reduces local noise by borrowing information from nearby geographic areas. “spatial smoothing from neighboring counties”
- Spatiotemporal: Relating to both geographic location and time. “negative binomial Bayesian spatiotemporal”
- Static embedding: A representation held constant across the forecasting period rather than updated at each time point. “a static embedding snapshot was incorporated”
- Temporal moving-block bootstrap: A bootstrap method that resamples consecutive time blocks to preserve temporal dependence. “95\% temporal moving-block-bootstrap CI”
- Temporal heterogeneity: Variation in patterns or effects across different time periods. “consistent with temporal heterogeneity in dengue activity”
- Transferable signal: Predictive information learned in one setting that remains useful in another setting. “adding a transferable signal to individual-level postpartum-depression risk prediction”
- Vector control: Public-health measures intended to reduce populations of disease-transmitting organisms, especially mosquitoes. “timely outbreak vector control”
- Weighted Interval Score (WIS): A scoring rule for evaluating probabilistic forecasts by assessing the accuracy and width of prediction intervals. “Mean difference in Weighted Interval Score”
- Zero-case stratum: A subgroup of observations in which no disease cases were recorded. “PDFM performed worse than baseline in zero-case municipality-months”

