- The paper introduces a multiscale quantitative model that links MITF-driven single-cell stochasticity with population-scale melanoma phenotype evolution.
- It demonstrates how density-dependent feedback and contact inhibition modulate transitions among differentiated, proliferative, and invasive states using phenotype-structured PDEs.
- Analytical and numerical analyses, including bifurcation and spatial wave modeling, reveal irreversible emergent behaviors with implications for therapy resistance.
Quantitative Modeling of Melanoma Population Dynamics via the MITF Rheostat
Background and Motivation
The paper establishes a quantitative framework for melanoma population dynamics grounded in the biological MITF rheostat concept—a paradigm for phenotype plasticity where MITF transcription factor activity modulates reversible state transitions among differentiated (DIF), proliferative (PRO), and invasive (INV) cellular phenotypes Figure 1. The model addresses the unresolved question of how cell-intrinsic phenotype switching, governed by MITF, translates to emergent population-scale behaviors, with implications for intratumoural heterogeneity, progression, and therapy resistance.
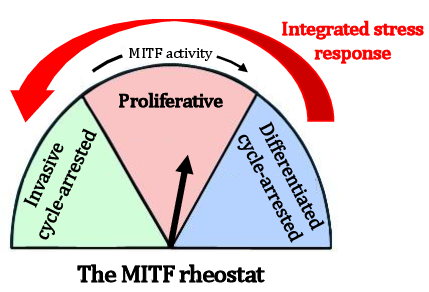
Figure 1: The MITF rheostat associates melanoma cell phenotype with MITF activity, defining transitions between differentiated, proliferative, and invasive cellular states.
Model Architecture: Multiscale Phenotype-Structured PDEs
The approach spans three scales:
- Subcellular Level: Stochastic differential equations describe MITF RNA (r), protein (p), and phenotype (ϕ) dynamics within individual cells. Calibrated from single-cell RNA-seq and half-life data, the model captures empirically observed heteroscedasticity in RNA—variance increasing with mean—and stochastic bursts in both r and p.
- Population Level: A phenotype-structured PDE tracks melanoma cell density m(ϕ,t), linking phenotype evolution to proliferation and death, with MITF transcription rate a(t) inversely coupled to total cell density M(t), which serves as a microenvironmental stress proxy. Proliferation occurs strictly within a phenotype window parameterized to the rheostat model.
- Spatial Level: A radially-resolved extension models spatial propagation within the epidermis, incorporating phenotype-dependent motility and random cell movement, enabling investigation of steady-state and wavefront behaviors.
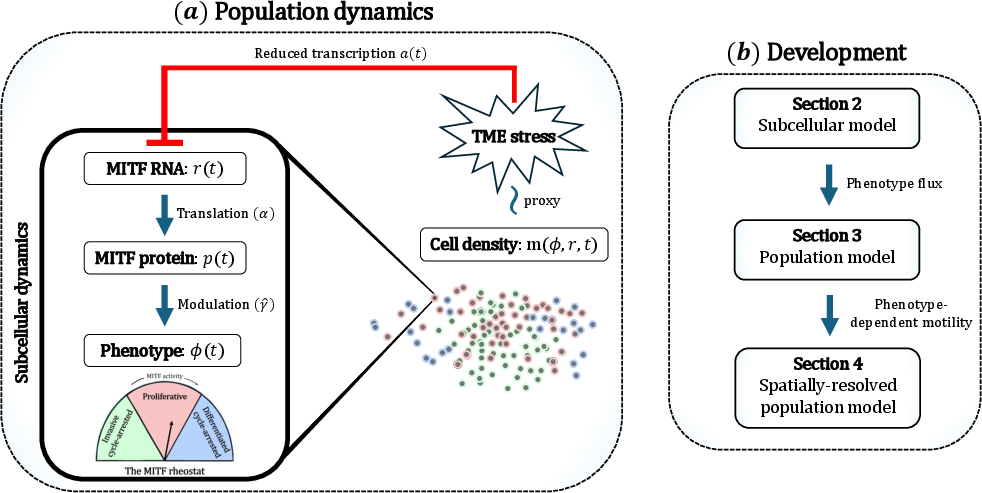
Figure 2: Multiscale model schematic coupling subcellular MITF dynamics to population evolution via phenotype-dependent proliferation and stress-informed transcription.
Subcellular Findings: Heteroscedasticity and Phenotype Flux Reduction
Analysis of stochastic subcellular dynamics reveals strong positive correlation and asymmetric distributions in MITF RNA and protein, with variance scaling nonlinearly with transcription rate a (Figure 3, Figure 4). Parameter inference using Bayesian approaches yields practically identifiable distributions, consistent with mechanistic expectations and clinical measurements.
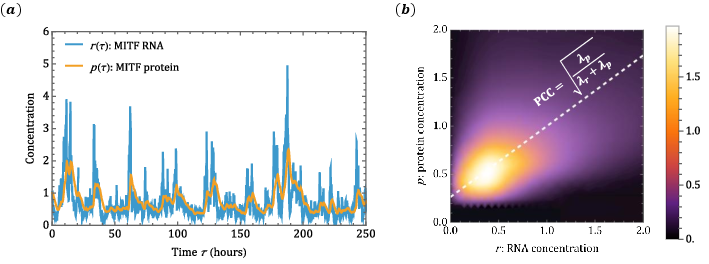
Figure 3: Empirical trajectories of MITF RNA and protein show correlated, stochastic fluctuation and skewed distributions.
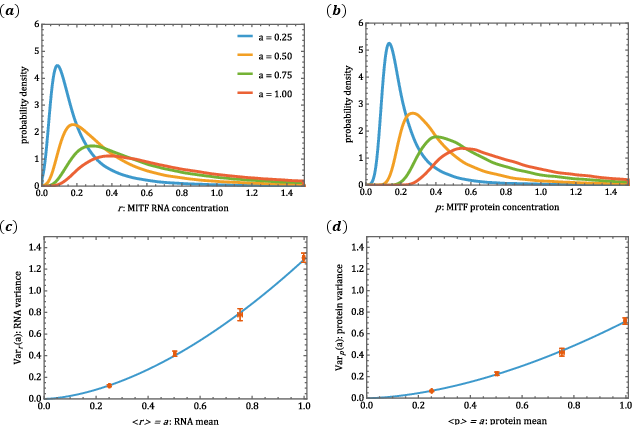
Figure 4: Increased transcription rate a elevates RNA and protein variance, validated against stochastic simulation and analytical predictions.
The timescale separation permits rigorous reduction to a phenotype advection-diffusion equation, where drift targets equilibrium dictated by p0 and diffusion magnitude is determined by subcellular variance. Analytical equilibrium solutions for phenotype are truncated Gaussians whose width decreases with stress-induced suppression of MITF transcription.
Population Model: Emergent Dynamics and Bifurcation Structure
The population-level model exhibits three classes of late-stage behaviors—steady-state PRO/DIF (low invasiveness), INV/PRO (metastatic potential), and a limit cycle (oscillatory invasive/proliferative states)—parameterized by contact inhibition sensitivity p1 (Figure 5, Figure 6). Numerical bifurcation analysis identifies Hopf and double-fold bifurcations, delineating regions of stability and multistability.
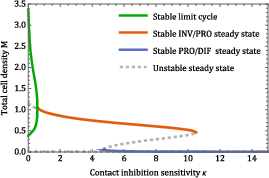
Figure 5: Long-term behaviors as a function of p2 reveal stable steady-state branches and limit cycles via bifurcation analysis.
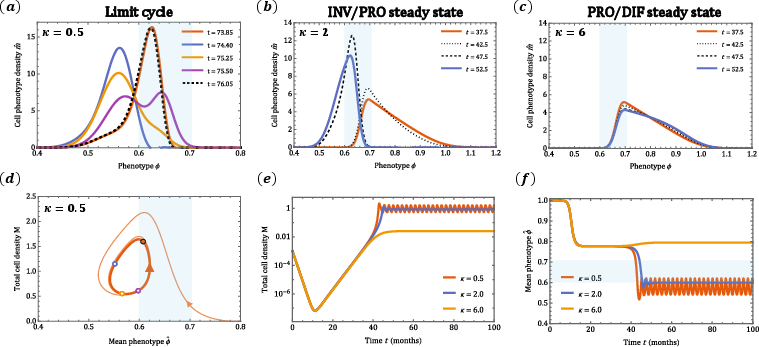
Figure 6: Time evolution of total cell density and mean phenotype illustrates transitions between invasive, proliferative, and differentiated states.
Bayesian parameter inference, informed by clinical Ki-67 proliferation indices, doubling times, xenograft switching data, and TUNEL indices, produces localizable, rapid-decaying posterior distributions for model parameters (Figure 7, Figure 8), indicating robustness and practical identifiability. Sensitivity analysis quantifies the influence of proliferation and death rates, phenotype window width, and switching times.
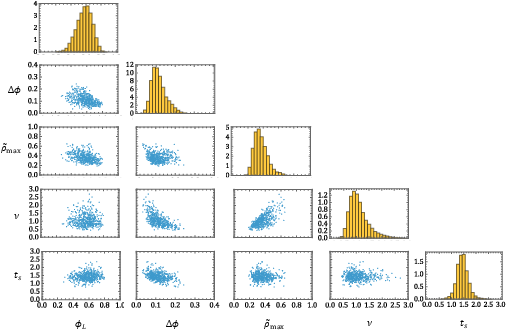
Figure 7: Posterior parameter distributions reveal practical identifiability and significant correlations: e.g., between proliferation and death rates.
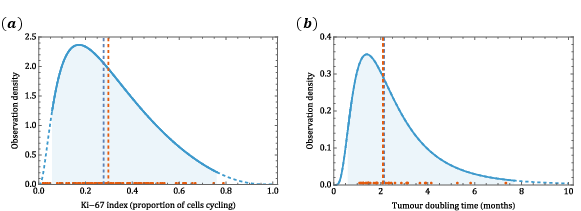
Figure 8: MAP fits for population parameters yield high concordance with published clinical data for proliferation and doubling time.
Irreversibility emerges from population-level coupling: once invasive phenotypes dominate due to decreased p3, restoring the original inhibition does not revert the population distribution, demonstrating hysteresis at the population scale Figure 9.
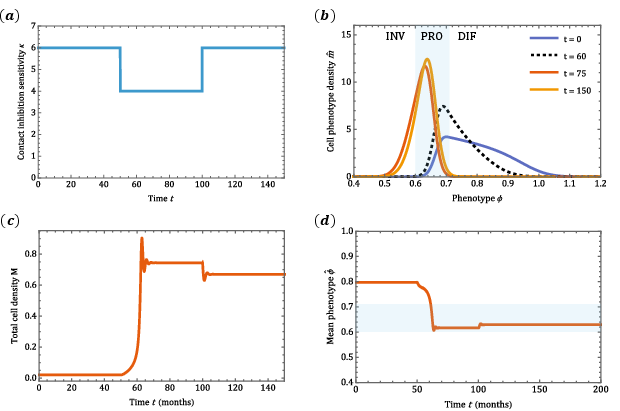
Figure 9: Irreversibility experiment—population phenotype remains invasive despite reversal of contact inhibition sensitivity.
Radially-Resolved Model: Wave Propagation and Spatial Heterogeneity
The spatial model extends the framework to radial tumor expansion. The density profile propagates as a wave, with the core's state determined by p4 and the wavefront universally PRO/DIF due to minimal local density and maximal MITF transcription Figure 10. Phenotype-dependent motility modulates spatial structure, sharpening or flattening wavefronts (Figure 11, Figure 12).
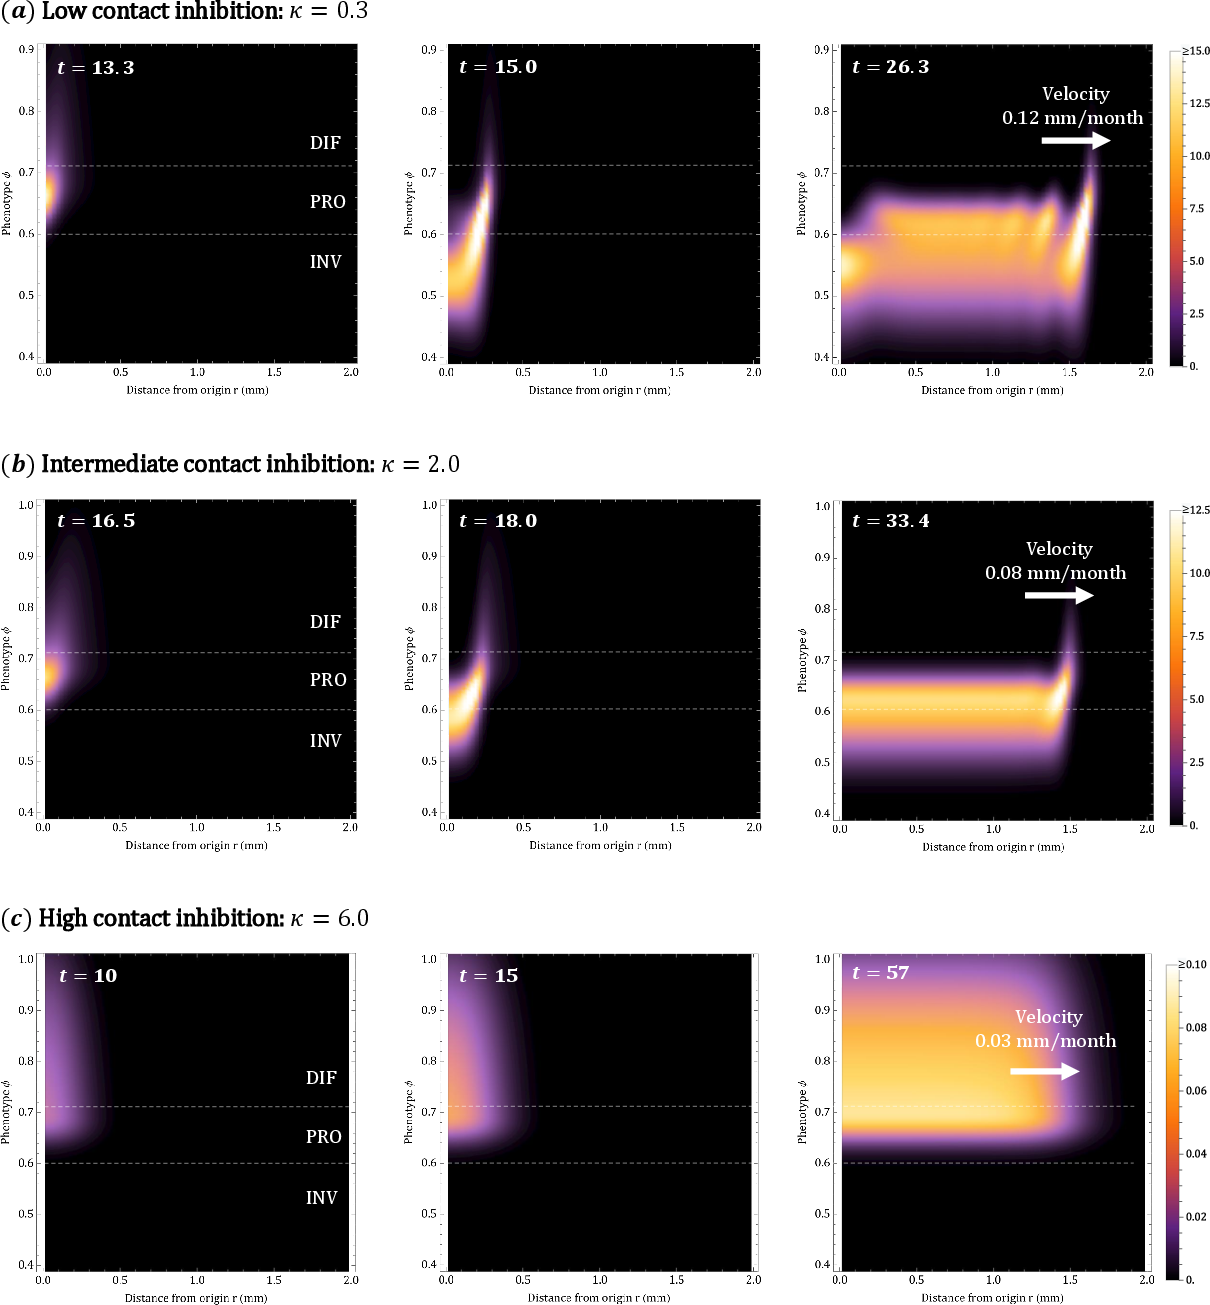
Figure 10: Spatially resolved melanoma density solutions illustrate wave propagation and core-dependent late behaviors across p5.
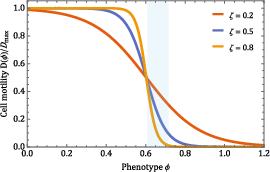
Figure 11: Phenotype-dependence of cell motility (p6) modulates spatial expansion and front sharpening.
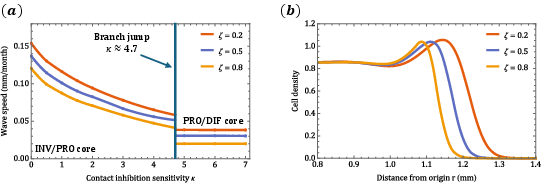
Figure 12: Wave speed decreases monotonically with contact inhibition and motility shape parameters.
Marginal distributions confirm that cell motion stabilizes previously unstable phenotype profiles and generate steady-state phenotype distributions distinct from spatially homogeneous models Figure 13.
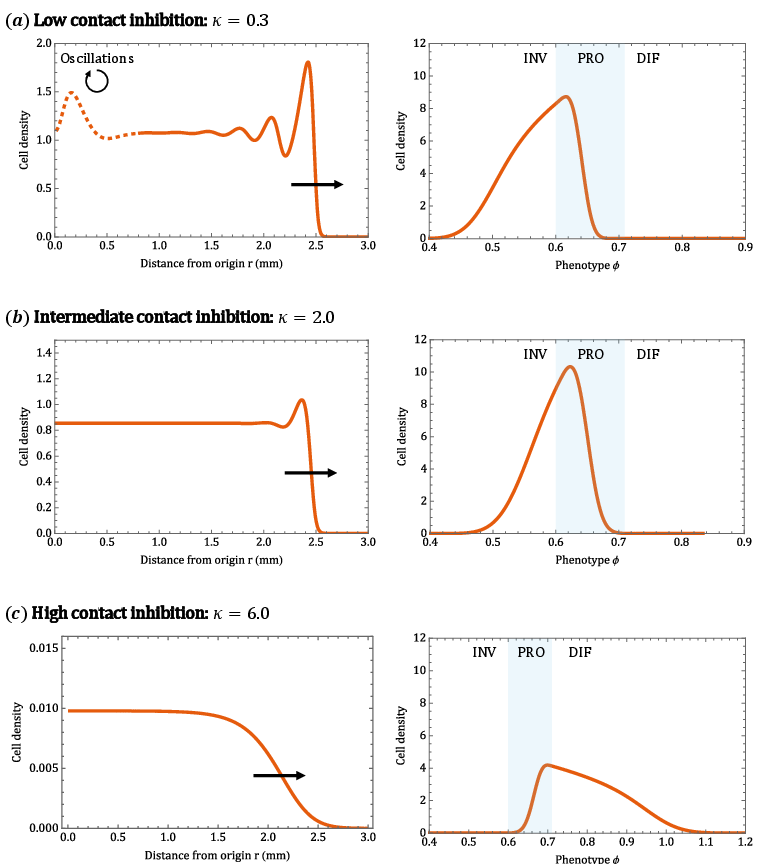
Figure 13: Marginal phenotype and spatial profiles during late-stage propagation demonstrate robust spatial heterogeneity and stabilized phenotype distributions.
Implications and Theoretical Considerations
Bold claims emerge regarding phenotype reversibility: single-cell reversibility does not extrapolate to the population scale. Aggregated behavior is intrinsically coupled via density-dependent feedback, yielding multistability and irreversibility.
- Practical: The model's structure, parameterized against clinical data, offers predictive value for behaviors observed in melanoma progression, stressing the importance of contact inhibition and microenvironmental stress in therapeutic outcome prediction.
- Theoretical: Multiscale reduction ties subcellular RNA-seq variability directly to population phenotype flux in structured models, advancing mathematical approaches to heterogeneity in cancer modeling.
- Future directions: Model extensions to vertical growth phase and explicit extracellular matrix coupling are proposed; incorporation of cell-type-specific feedbacks, subcellular bistability, and microenvironmental modulation (e.g., adipocyte-induced stabilization of INV phenotypes) are suggested for further research.
Conclusion
This work formulates a comprehensive, multiscale PDE model for melanoma dynamics governed by the MITF rheostat. It yields three stable macroscopic population behaviors, demonstrates irreversibility in phenotype distributions despite intrinsic reversibility at the single-cell level, and quantitatively aligns predictions with clinical data. The modeling strategy, combining subcellular data-driven stochasticity with structured population-level feedbacks, provides a rigorous foundation for exploring cell plasticity and progression in melanoma and other cancers.