- The paper introduces DDB, a debugger that reconstructs unified, multi-process call stacks and enables source-level interactivity in distributed systems.
- It employs innovative techniques like Distributed Backtrace, an intent-preserving control plane, and Pause-Erased Time to prevent timeout-induced failures.
- Empirical results show 100% fault localization, reduced time-to-fix, and minimal overhead, demonstrating efficiency over traditional debugging tools.
Source-Level Interactive Debugging for Distributed Applications: An Expert Analysis of DDB
Introduction and Motivation
The proliferation of microservices, serverless architectures, and modular distributed frameworks has made distributed programming accessible to a wide range of developers. However, interactive debugging in these environments has lagged, largely due to three fundamental barriers: cross-process call stacks are not exposed, maintaining debugger state is complex under dynamic infrastructure, and debugger-induced pauses commonly trigger timeout-based failure recovery mechanisms, leading to system disruption.
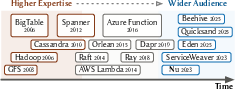
Figure 1: The barriers to entry for distributed programming are markedly lower, enabling broader adoption but amplifying the challenge of debugging cross-process execution.
Traditional diagnostic methods—tracing, logging, monitoring, or post-hoc record-and-replay—are indispensable but do not support the rapid hypothesis-and-test loop enabled by source-level debuggers in single-process environments. Existing distributed debuggers in HPC or parallel programming lack semantic consistency guarantees required for distributed server applications, and tracing tools do not allow arbitrary state inspection across RPC boundaries.
The DDB Approach: Architectural Overview
DDB introduces a source-level, interactive debugger that enables developers to inspect, pause, and control distributed applications as easily as with GDB or LLDB in a single process. Its design is underpinned by three technical pillars:
- Distributed Backtrace (DBT): Seamlessly reconstructs cross-RPC call stacks for causal path inspection and variable introspection.
- Intent-Preserving Control Plane: Debug-intents that atomically propagate and adapt to changing process topologies.
- Pause-Erased Time (PET): Presents each process with a logical clock that discounts debugger-induced pauses, preventing timeout cascades and ensuring system consistency.
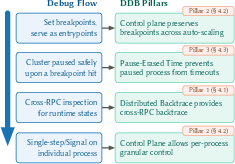
Figure 3: DDB’s three core technical pillars enable source-level, interactive debugging across distributed systems without disrupting application liveness or consistency.
Distributed Backtrace
DBT reconstructs a unified, multi-process call stack, enabling navigation through the entire execution path spanning multiple services and RPC boundaries. Rather than recording mere thread IDs, DDB captures the precise calling context (register set at send time) and embeds it as compact metadata directly in RPC payloads. This scheme is robust under user-level threading and dynamic scheduling, ensuring that local stack unwinding remains correct.
At breakpoint, the developer can traverse upstream context—including arguments and variable state—cultivating the same insight possible with GDB in monolithic binaries, but now across a distributed heterogenous system.
Intent-Preserving Control Plane
DDB’s control plane manages debug-intents at a logical, not physical, granularity. Intents are specified as triples: (source location, process group, debug command). They are continuously enforced as infrastructure changes, e.g., auto-scaling, restarts, or computation migration. This abstraction significantly reduces developer cognitive load—breakpoints and commands adapt automatically to dynamic compositions, and the scope is always accurate via live topology monitoring.
Furthermore, the default "pause-the-world" policy ensures the system's state does not progress outside developer supervision, preventing causality violations and simplifying reasoning about system correctness during debugging.
Pause-Erased Time: Eliminating Timeout Cascades
A key innovation is "Pause-Erased Time" (PET), which virtualizes time in all debugged processes. Rather than advancing process clocks during a debugger-induced pause, PET introduces an offset layer via LD_PRELOAD shims that intercept POSIX time APIs and adjust values to account for accumulated pause time. During sleeps or timed waits, the PET shim re-arms waits as necessary to block until the correct logical deadline, even if the debugger is invoked multiple times.
This not only prevents spurious timeout events but guarantees monotonicity and correct virtualized wake semantics even under complex pause/resume sequences. Critically, PET is lightweight and transparent, introducing only nanosecond-scale overhead per system call.
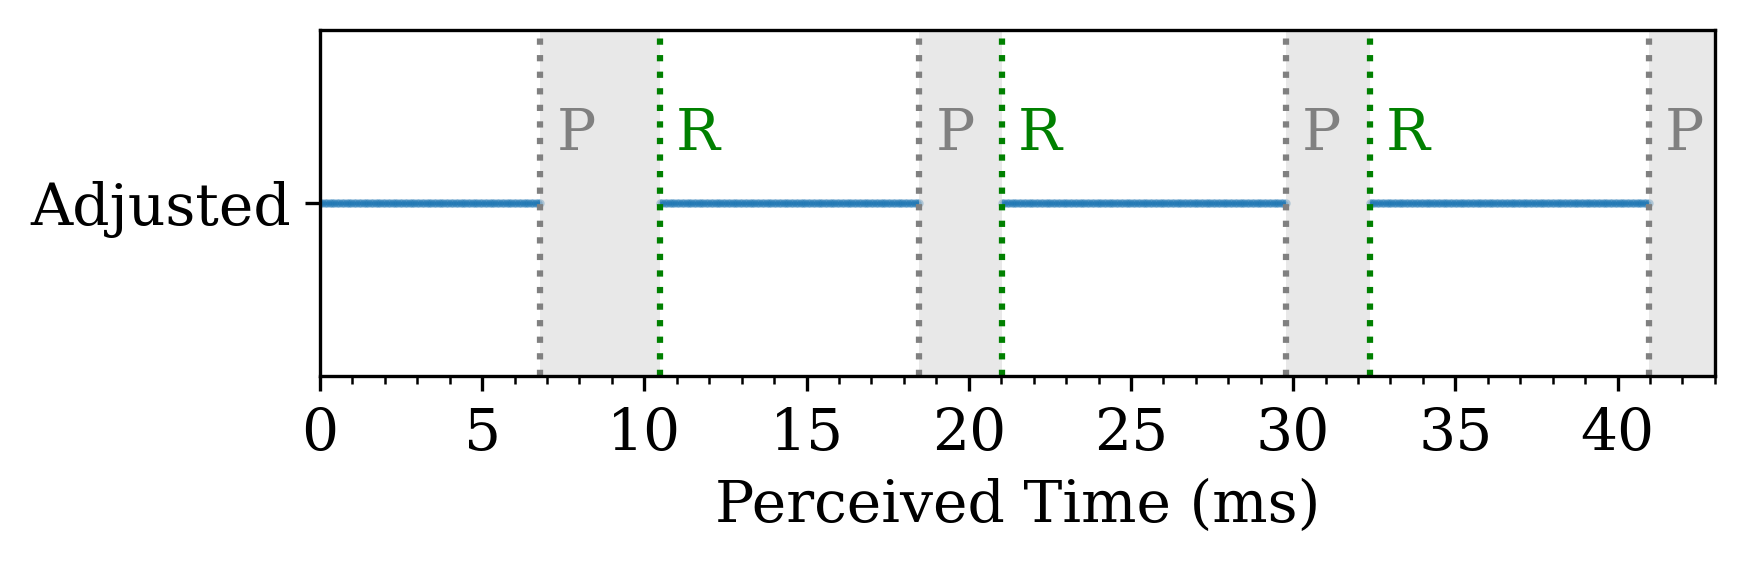
Figure 5: Under PET, debugger-induced pauses result in sub-5ms apparent time jumps from the application’s perspective, well below typical timeout thresholds in distributed systems.
Implementation and Integration Effort
DDB is designed for minimal, framework-level integration; e.g., 20–60 LoC for a full framework port. It comprises a centralized Rust-based coordinator, DKnot (GDB-extended agents), PET shims, and a VS Code frontend. Integration into gRPC, ServiceWeaver, Nu, and Quicksand demonstrates both technical flexibility and low engineering overhead.
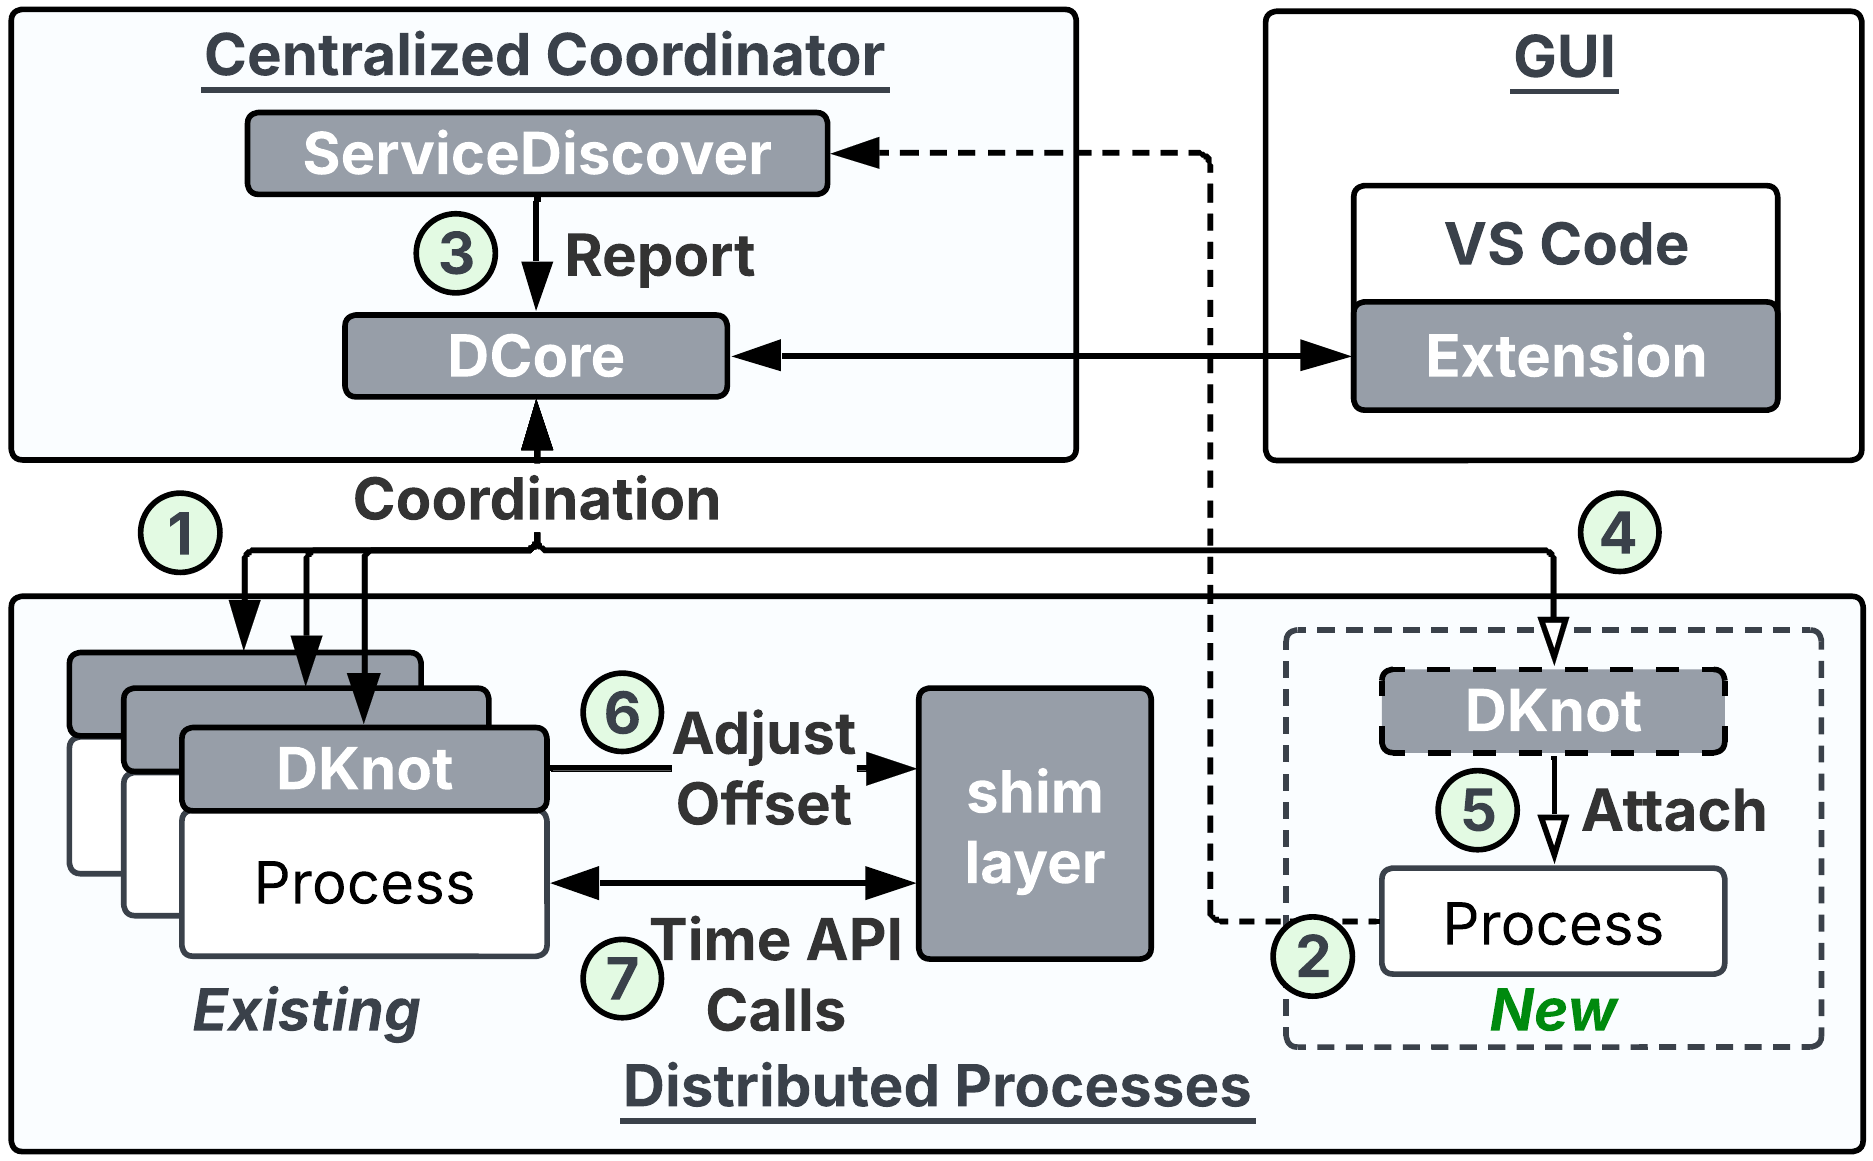
Figure 2: DDB system architecture showing the coordinator, frontend, agent, and system shim layers that together realize cross-process debugging.
User Study: Quantitative Analysis
A controlled user study assessed both the integration effort and efficacy in bug localization and resolution. DDB delivered 100% fault localization across all cross-service bugs within the time limits, compared to 44% for GDB and 33% for state-of-the-art tracing (OTel). Time-to-fix was also dramatically reduced. Notably, baseline tools failed in the majority of cross-service scenarios, either due to inability to trace causality or debugger-induced timeouts.
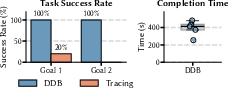
Figure 8: DDB enables successful integration and tracing tasks across all users, whereas OpenTelemetry (OTel) participants often fail to provide cross-caller visibility within the time budget.
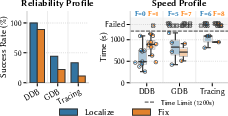
Figure 6: Root cause localization and diagnostic speed: DDB enabled 100% localization success, baseline tools (GDB and OTel) frequently timed out, especially on distributed and timing-sensitive bugs.
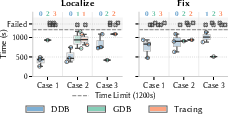
Figure 7: Case-by-case breakdown of time-to-localize and time-to-fix: DDB shows consistently lower times and higher fix rates across fault classes.
DDB demonstrates stable, sub-200ms latencies for distributed backtrace and <5ms for control-plane commands up to 122 processes, with median backtrace time under 50ms at call depth 2-3. PET overheads on time APIs are negligible. Overall application throughput degradation is below 5% in typical application scenarios, substantially lower than production GDB-instrumented overheads.
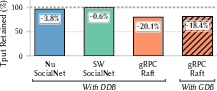
Figure 9: Throughput impacts of DDB are small across major distributed frameworks and even for metadata-embedded RPCs.
Practical and Theoretical Implications
DDB narrows the observability and control gap between single-process and distributed debugging in modern cloud systems. Practically, it offers immediate benefits for developer productivity, system reliability, and the speed of iteration during fault localization and recovery. Theoretically, DDB's cross-process call stack and time virtualization abstractions could serve as primitives for future introspection and verification frameworks, possibly integrating symbolic analysis or invariants checking into live debugging workflows.
By decoupling logical developer reasoning from physical deployment dynamics and temporal anomalies, DDB sets a precedent for next-generation distributed software engineering tools. Its multi-language, low-LOC framework integration makes it viable even in rapidly-evolving cloud-native ecosystems.
Future Directions
Anticipated future work includes:
- Porting support for non-GDB targets (e.g., managed runtimes like JVM, CLR).
- Hardening PET for applications using raw (e.g., rdtsc) or NIC-derived timestamps.
- Native support for dynamic resource management environments (Kubernetes ephemeral containers, fine-grained FaaS).
- Integrating deterministic or partially-deterministic record-and-replay to enable debugging of data races and concurrency bugs, currently out of scope.
DDB's model could also be extended to interface with formal verification or runtime assertion frameworks, offering synergistic pathways for both interactive diagnosis and correctness guarantees in distributed codebases.
Conclusion
DDB addresses the core challenges that have rendered interactive, source-level debugging infeasible for distributed applications. Its fusion of cross-process call stack introspection, intent preservation under dynamic infrastructure, and pause-erased logical time introduces a new operational baseline for distributed diagnostics. The strong empirical results—100% bug localization, minor overheads, and minimal integration friction—demonstrate that source-level interactive debugging is both viable and efficient at distributed scale.
For distributed application developers and system researchers alike, DDB represents a significant step toward closing the usability and observability gap in modern, dynamic cloud infrastructures.

