- The paper introduces a novel SHAP-based FAH Risk Index to quantify district-level impacts of air pollution, deforestation, and fire activity on respiratory disease.
- The paper employs temporally validated XGBoost models that achieve high R² values (0.937 and 0.976) to capture complex, nonlinear associations.
- The paper’s spatial, PCA, and clustering analyses reveal that air pollution predominates as an environmental driver, while improvements in healthcare access may confound disease trends.
Environmental Drivers of Respiratory Disease: District-Level Machine Learning Analysis in Sri Lanka
Introduction
The study titled "Environmental Drivers of Respiratory Disease: A District Level Analysis" (2607.04416) represents a comprehensive investigation into the spatial and temporal relationships among deforestation, atmospheric pollutants, and respiratory health across all 25 administrative districts in Sri Lanka over an eleven-year period (2014–2024). Employing a panel dataset integrating remotely sensed environmental variables and aggregated health data, the authors develop machine learning models to quantify the relative importance of forest loss, air quality, and fire activity as predictors of respiratory disease rates. The introduction of a SHAP-inferred Forest-Air-Health (FAH) Risk Index constitutes a novel framework for district-scale environmental health risk stratification in a lower-middle income tropical setting.
Dataset Construction and Preprocessing
The constructed dataset comprises 3,300 district-month observations with over a hundred engineered features encapsulating forest degradation (VIIRS VIM indices, GFW/Hansen TC loss, net carbon flux), fire activity (SUOMI VIIRS C2 FRP and thermal anomalies), atmospheric pollution (MERRA-2 PM₂.₅, SO₂, CAMS EAC4 NO₂), and health outcomes (ICD-coded admissions for bronchitis, asthma, COPD). Temporal alignment, spatial harmonization via area-weighted overlays, lag feature engineering, and extensive imputation underpin the data pipeline. This meticulous approach to panel construction ensures maximum exploitation of both high-resolution remote sensing and routinely reported health statistics, despite inherent limitations posed by annualized health records and relatively coarse pollution grids.
Exploratory Data Analysis and Spatial Patterns
EDA reveals several robust cross-domain relationships. Vegetation cover (VIM) is negatively associated with PM₂.₅ (r = -0.40), affirming the role of forest canopies in particulate matter sequestration. However, the positive correlation between pollution metrics and both forest cover and tree cover loss suggests that biomass burning in heavily forested districts partially offsets vegetative filtering, highlighting the complexity of exposure pathways. At the province scale, the Western, North Western, and Northern Provinces exhibit the highest pollutant loads and forest cover loss. Notably, the paradox of declining respiratory admissions amid worsening deforestation and pollution is ascribed to secular improvements in healthcare access confounding exposure-outcome associations.
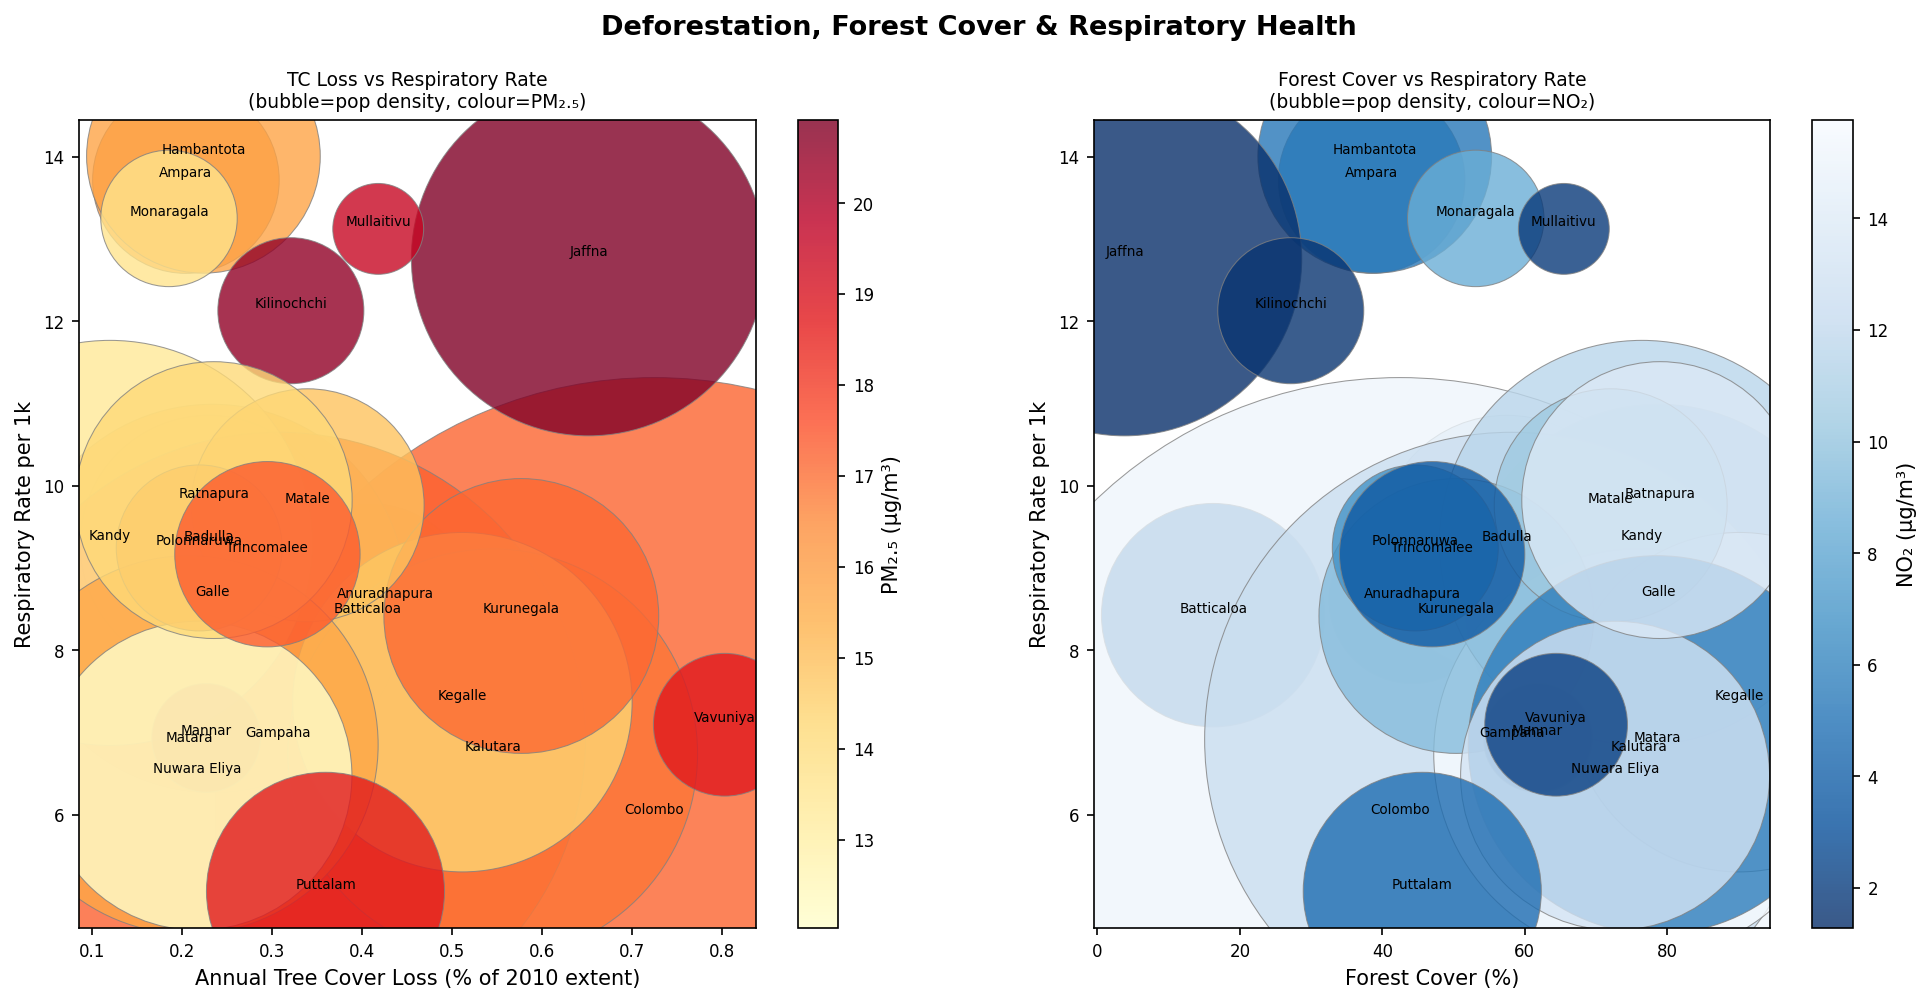
Figure 1: Deforestation, forest cover, and respiratory health across 25 districts, with PM₂.₅ and NO₂ overlays visualizing multidimensional exposure.
Dimension reduction via PCA extracts six interpretable components capturing 95% of variance, with pollution and carbon cycling dominating PC1, and forest-vegetation health comprising PC2. The spatial clustering of districts—urbanized/polluted (Western); burned/deforested (North Central, North Western); forested/clean (Central, Sabaragamuwa); and conflict-affected/northern (Northern Province)—is robust to K-means clustering on key exposure and health features.
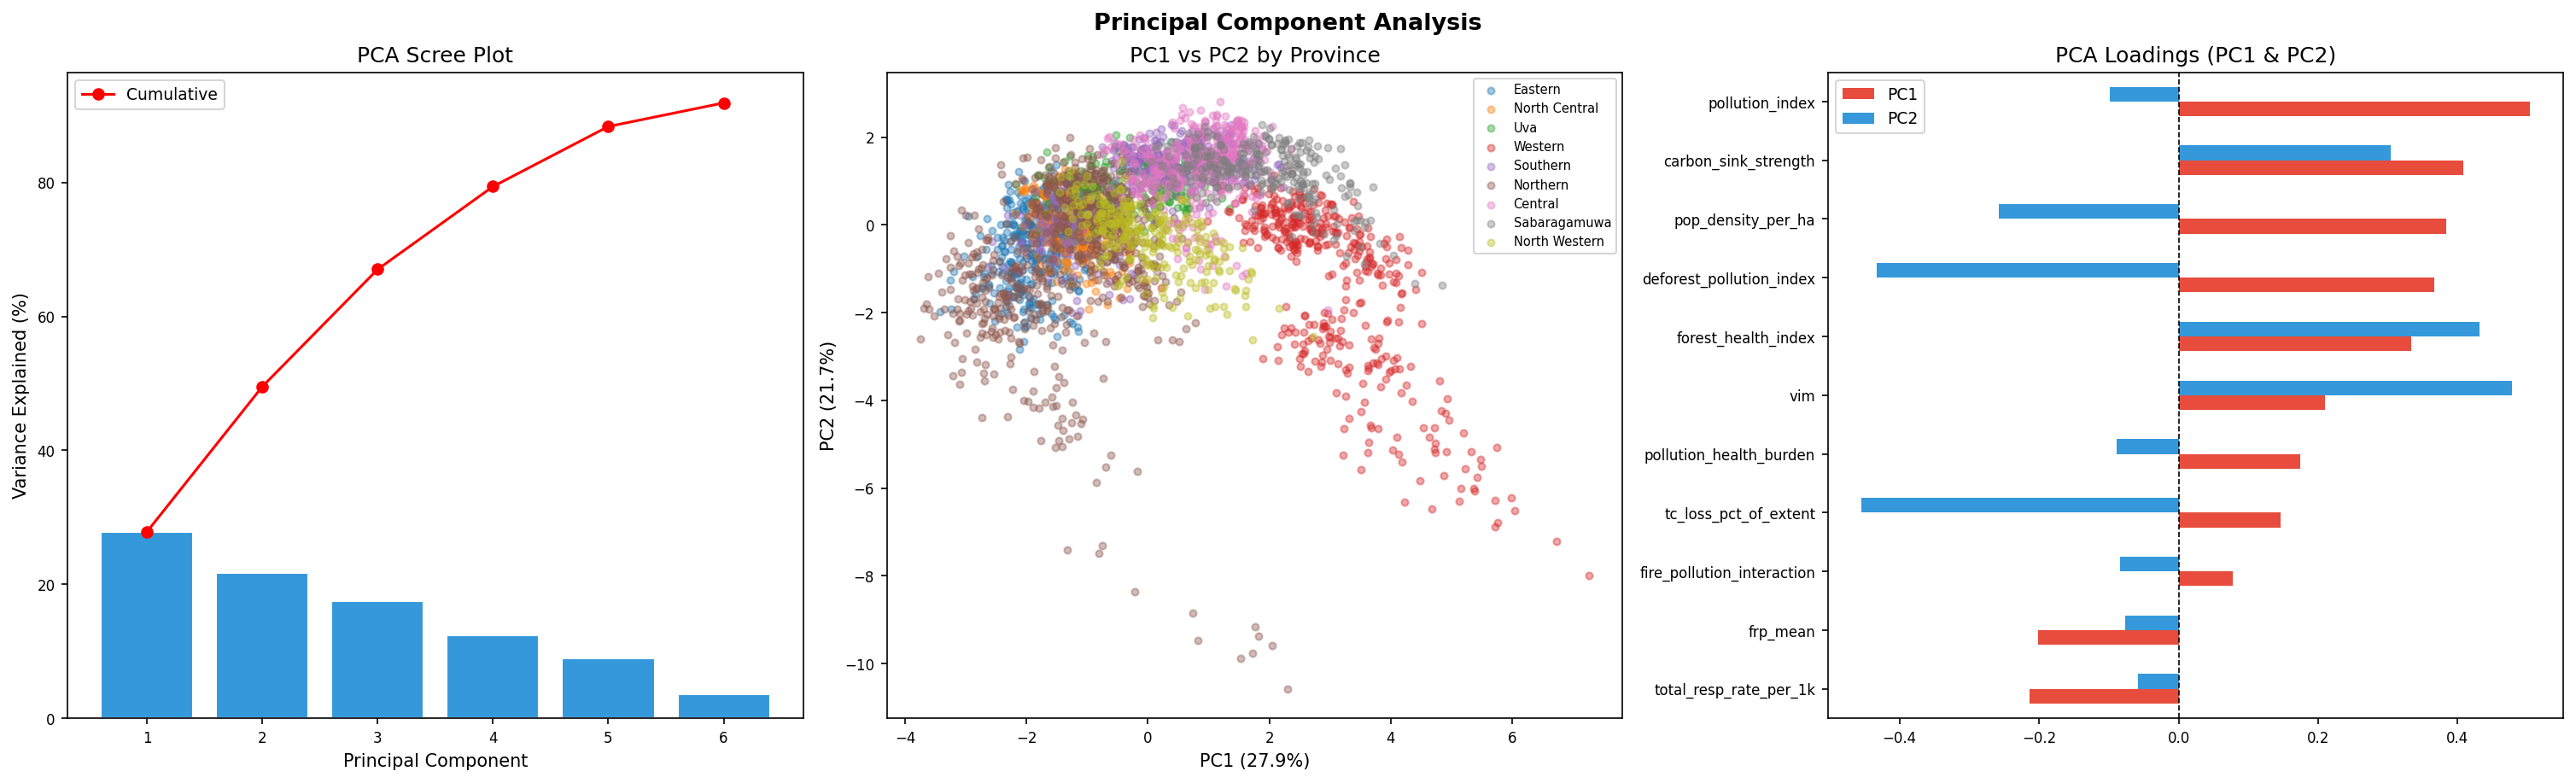
Figure 2: Principal Component Analysis highlighting the dominant roles of pollution, forest health, and population; scree and score plots display spatial clustering at district level.
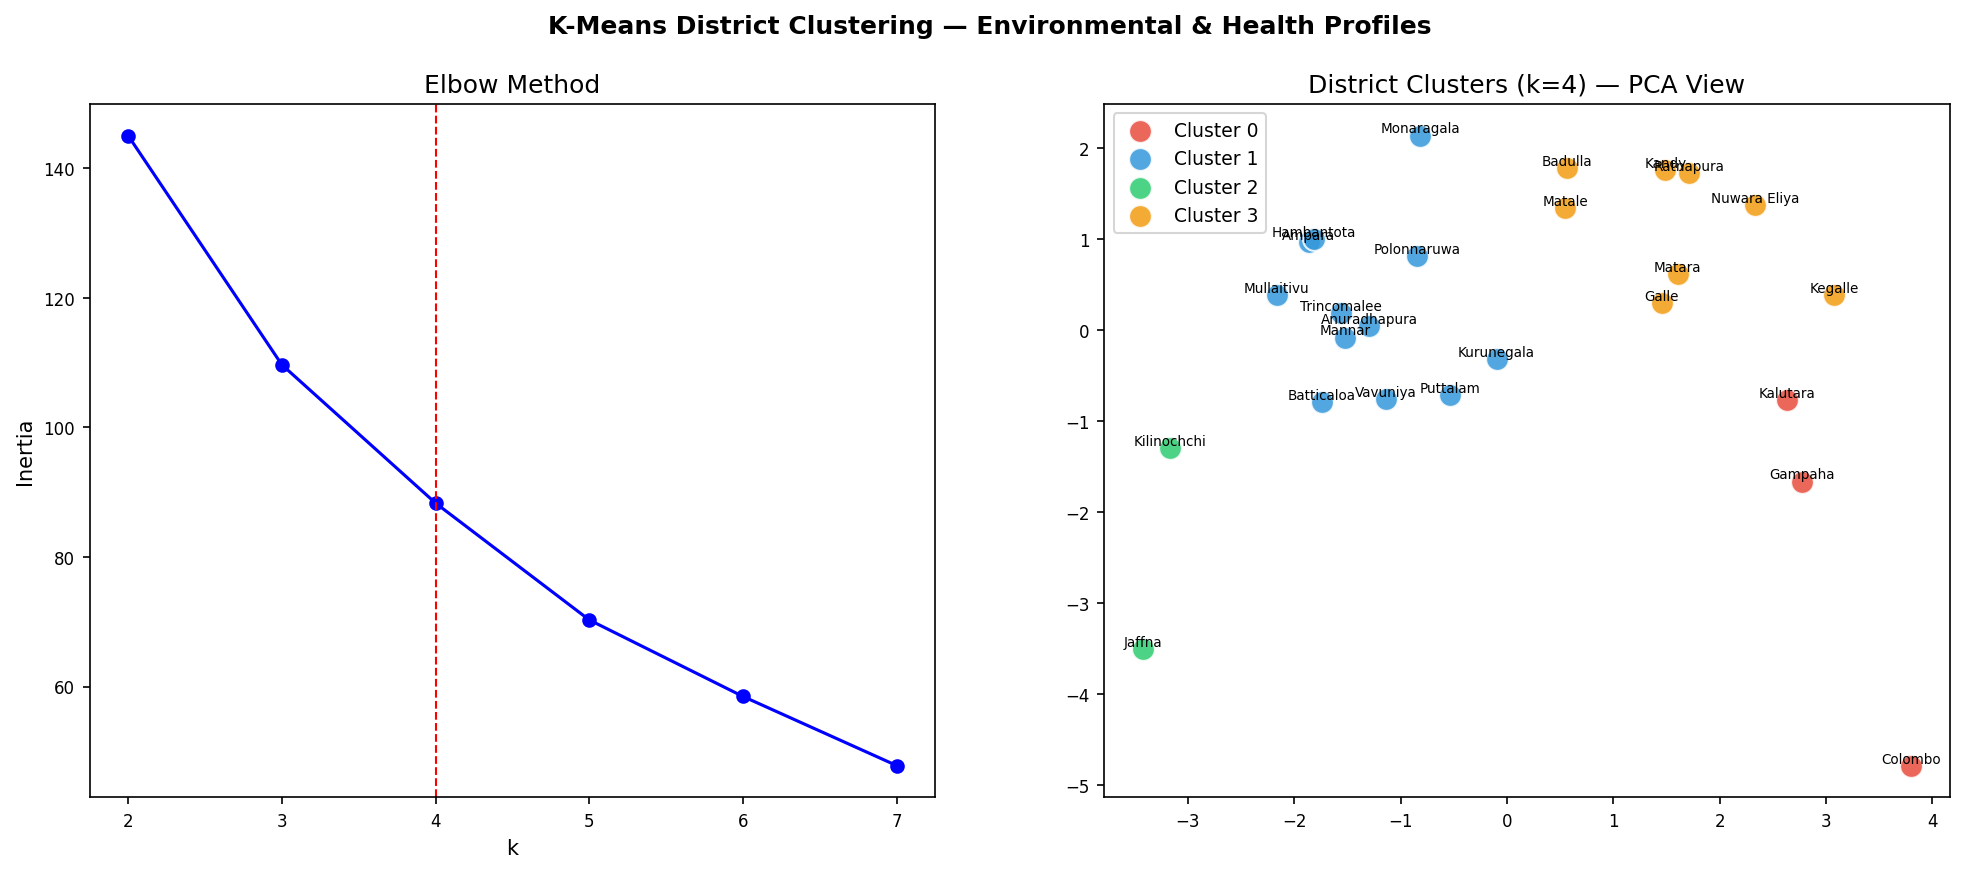
Figure 3: K-means district clustering (k=4) in PCA projection, grouping districts by archetypal environmental and health risk profiles.
Predictive Modeling: XGBoost and Model Interpretation
The core analytic pipeline comprises two temporally validated XGBoost regressors: a primary annual model for district respiratory admission rates (R2=0.937, MAE = 0.78/1,000 population) and a secondary monthly model for PM₂.₅ (R2=0.976, MAE = 0.52 μg/m³). Cross-validation (CV R2 ≈ 0.8/0.94) and out-of-sample generalization (MAPE ≤ 20% in 21/25 districts) substantiate the models’ ability to retain temporal integrity while capturing high-dimensional, nonlinear dependencies. The annualized health data constraint necessitates aggregation in Model 1, but temporal lags in both features and targets preserve autoregressive structure and avoid data leakage.
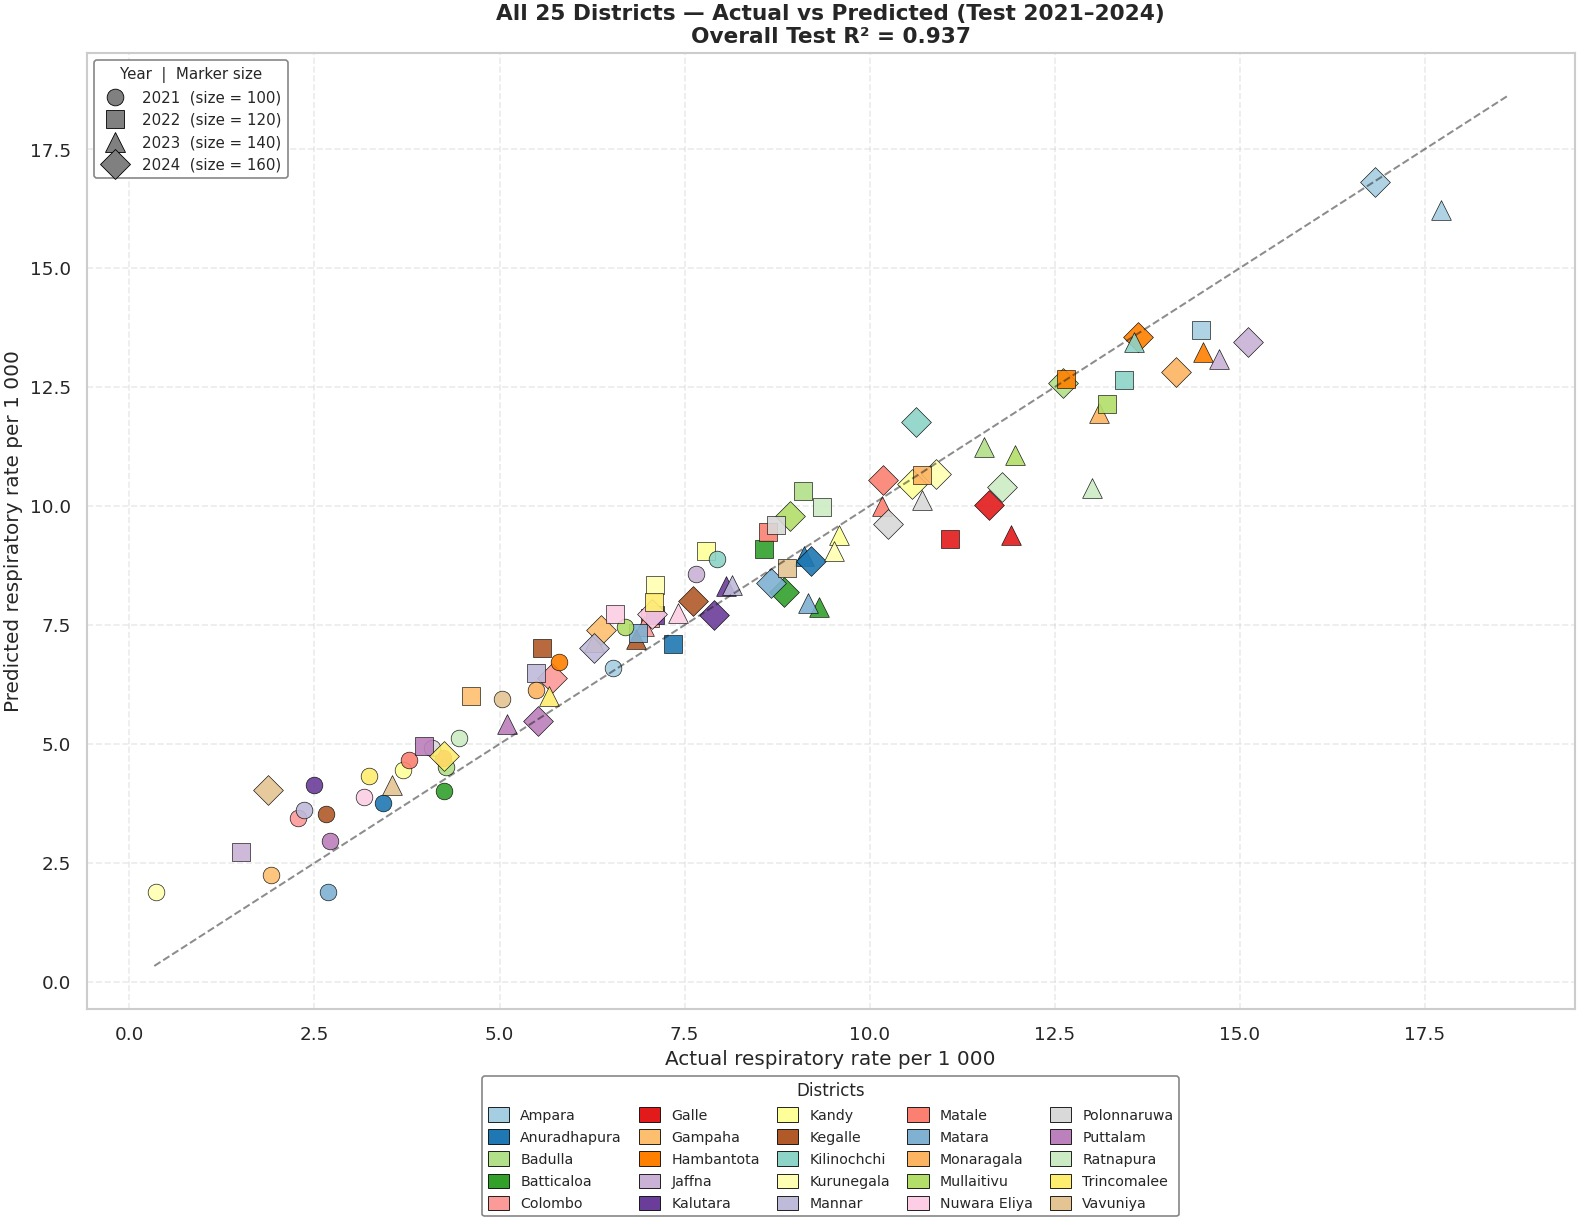
Figure 4: Actual vs. predicted district-level respiratory rates during the test period confirms model reliability in capturing out-of-sample temporal variation.
SHAP Analysis and Environmental Risk Attribution
TreeSHAP attribution decomposes prediction into domain-level contributions. Pollution burden accounts for 80.1% of the aggregate environmental SHAP signal, with forest degradation and fire activity comprising only 15.6% and 4.3%, respectively—a finding that materially contravenes naïve assumptions of ecological co-dominance.
Figure 5: Global SHAP importance for yearly respiratory rate, color-coded by FAH domains, compared with equal and empirical domain weights.
The leading individual predictor is the aggregate pollution-health burden metric (∣SHAP∣=2.73), with SO₂, health lags, and VIM also salient. SHAP beeswarm analysis affirms directional effects: elevated pollution components increase respiratory hazard, while higher vegetation indices confer measurable protective effects.
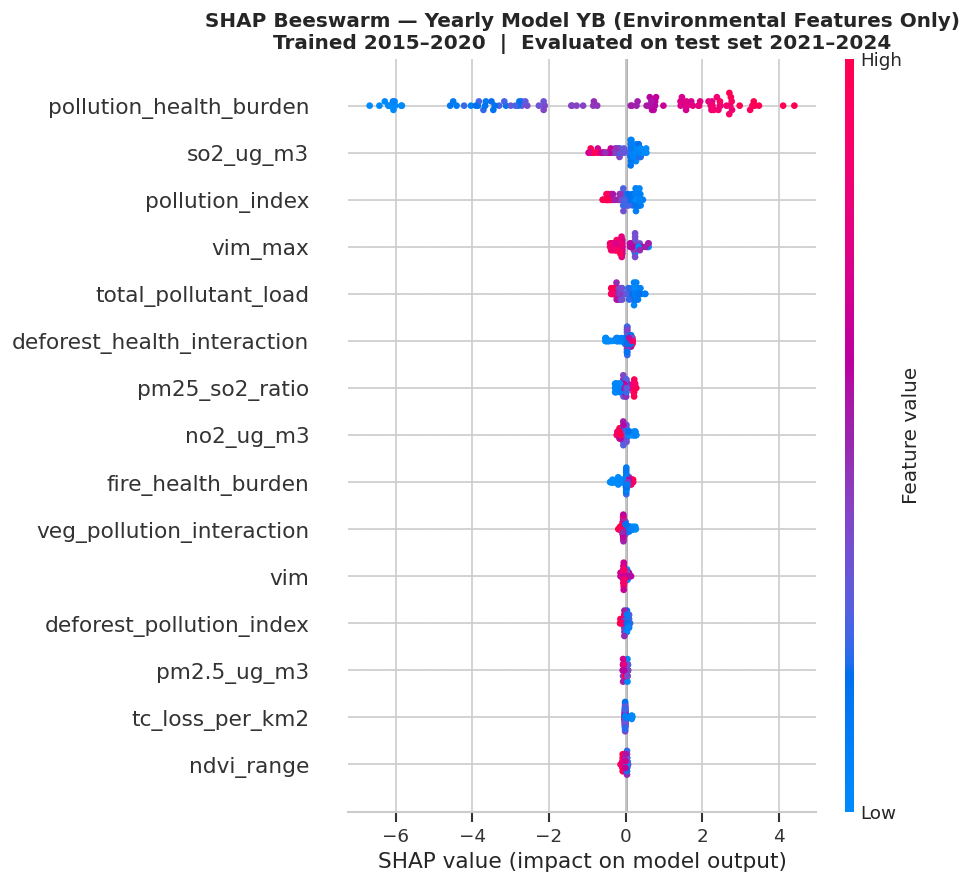
Figure 6: SHAP beeswarm for environmental variables reveals directional effects, with high pollutant values driving higher predicted respiratory rates and high vegetation exerting protective influence.
At the district level, Western Province districts (Colombo, Gampaha, Kalutara) show the most positive SHAP scores for air quality risk, while Eastern districts (Batticaloa, Trincomalee) exhibit negative scores, indicating environmental protective factors.
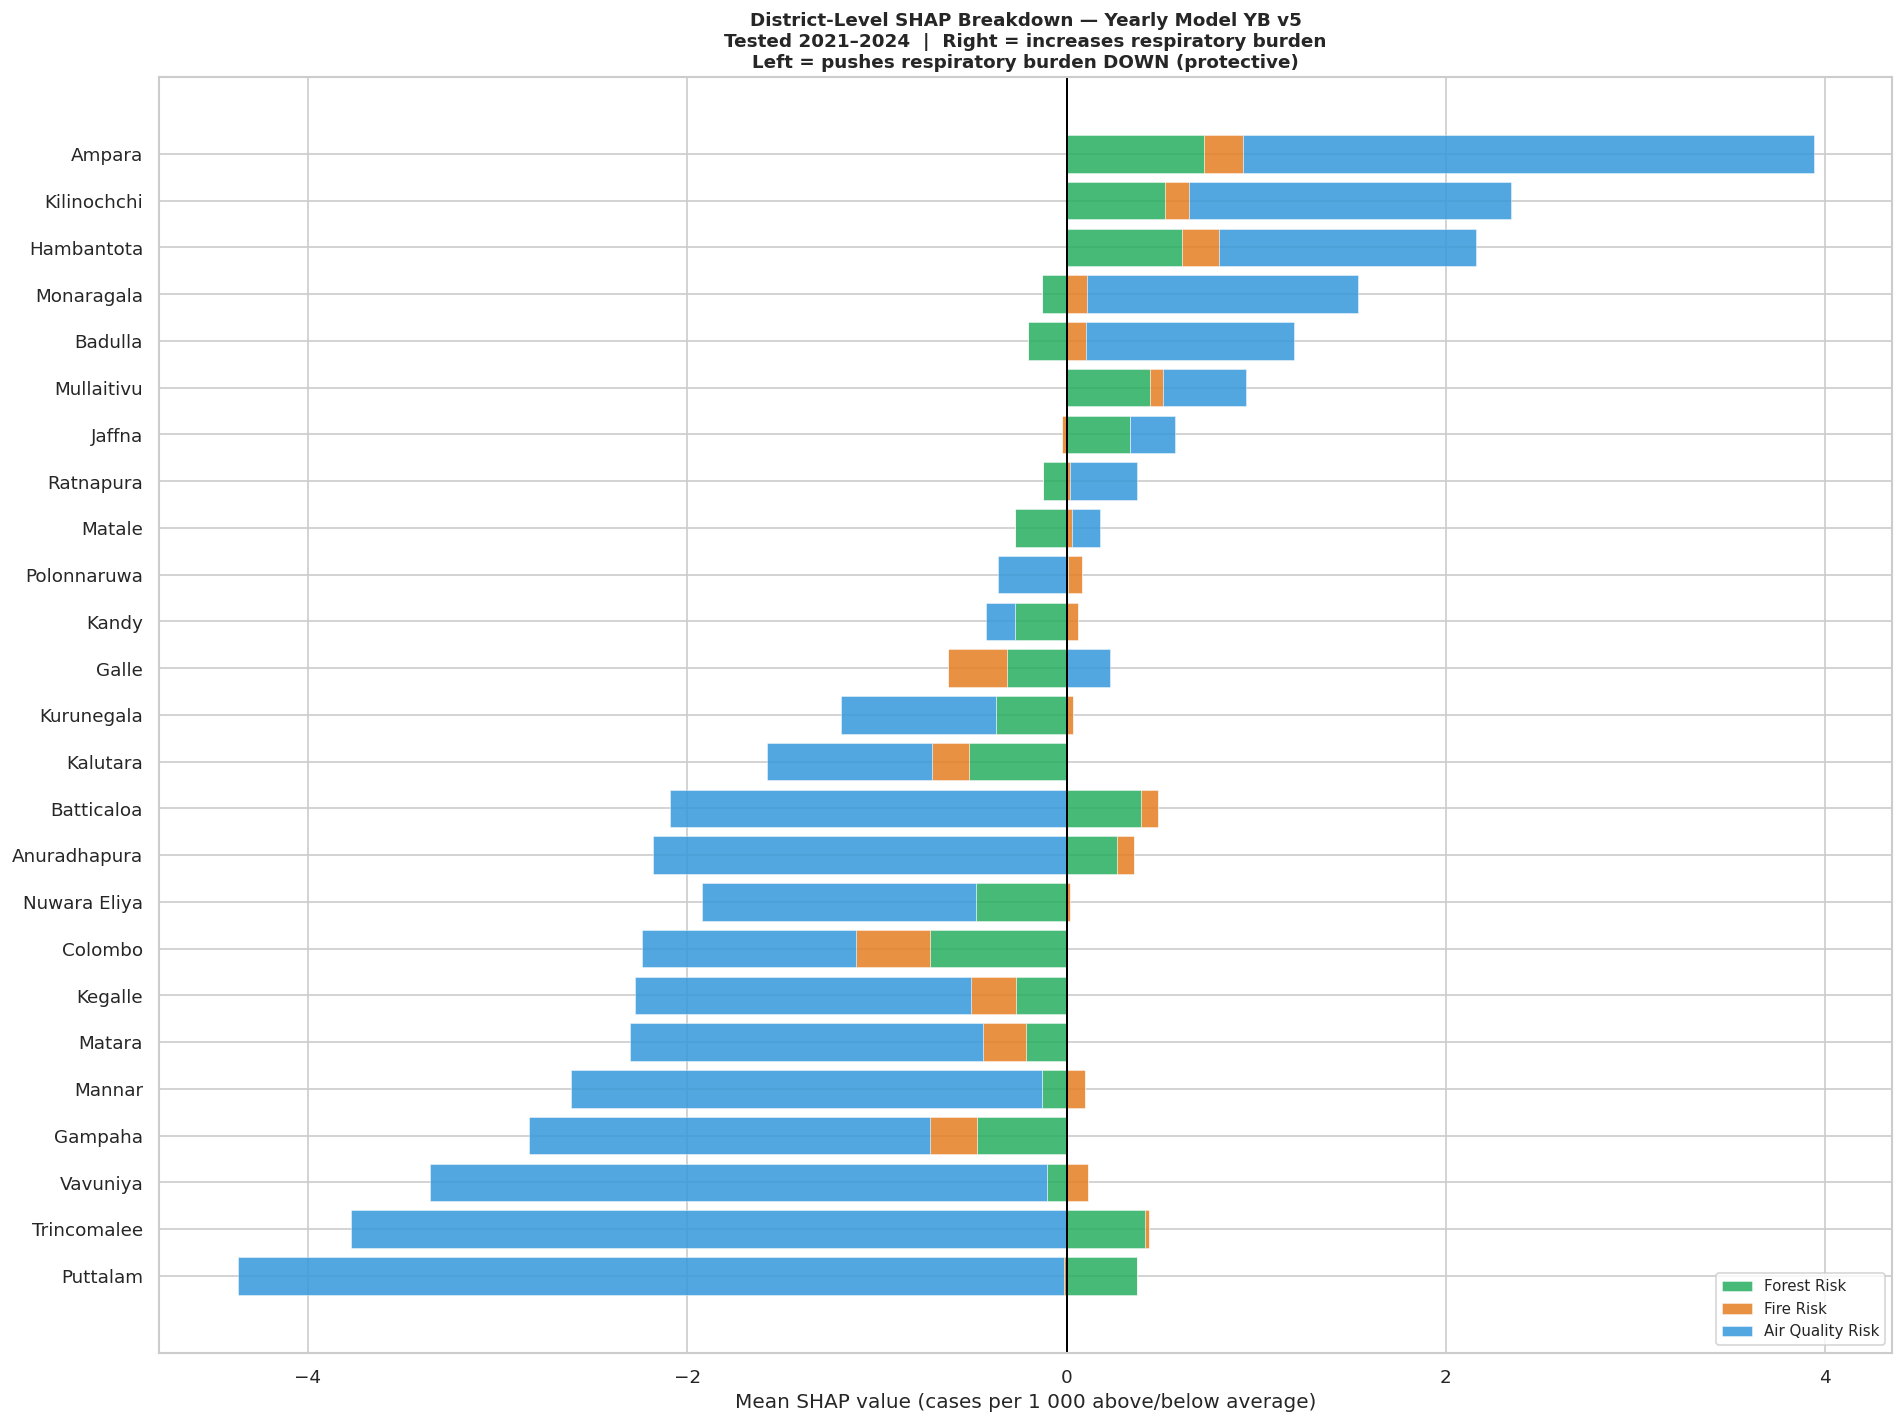
Figure 7: District-level SHAP FAH decomposition, showing the dominance of air quality risk in Western Province districts and protective effects elsewhere.
The Forest-Air-Health (FAH) Risk Index
Leveraging empirical SHAP weights rather than assuming equal component contributions, the FAH Risk Index provides a transparent, data-driven compositing of normalized environmental risk sub-indicators at the district level: FAH=0.156⋅Fforest+0.043⋅Ffire+0.801⋅Fair
Colombo (0.802), Gampaha (0.708), and Kalutara (0.682) are classified as high-risk, driven almost exclusively by air pollution; Kegalle, Ratnapura, Kurunegala, and Nuwara Eliya are moderate-risk. The spatial granularity and explainability of the index make it actionable for policy stakeholders, though it should be interpreted as a composite environmental risk metric—not a direct proxy for disease burden, which is confounded by unmeasured healthcare access.
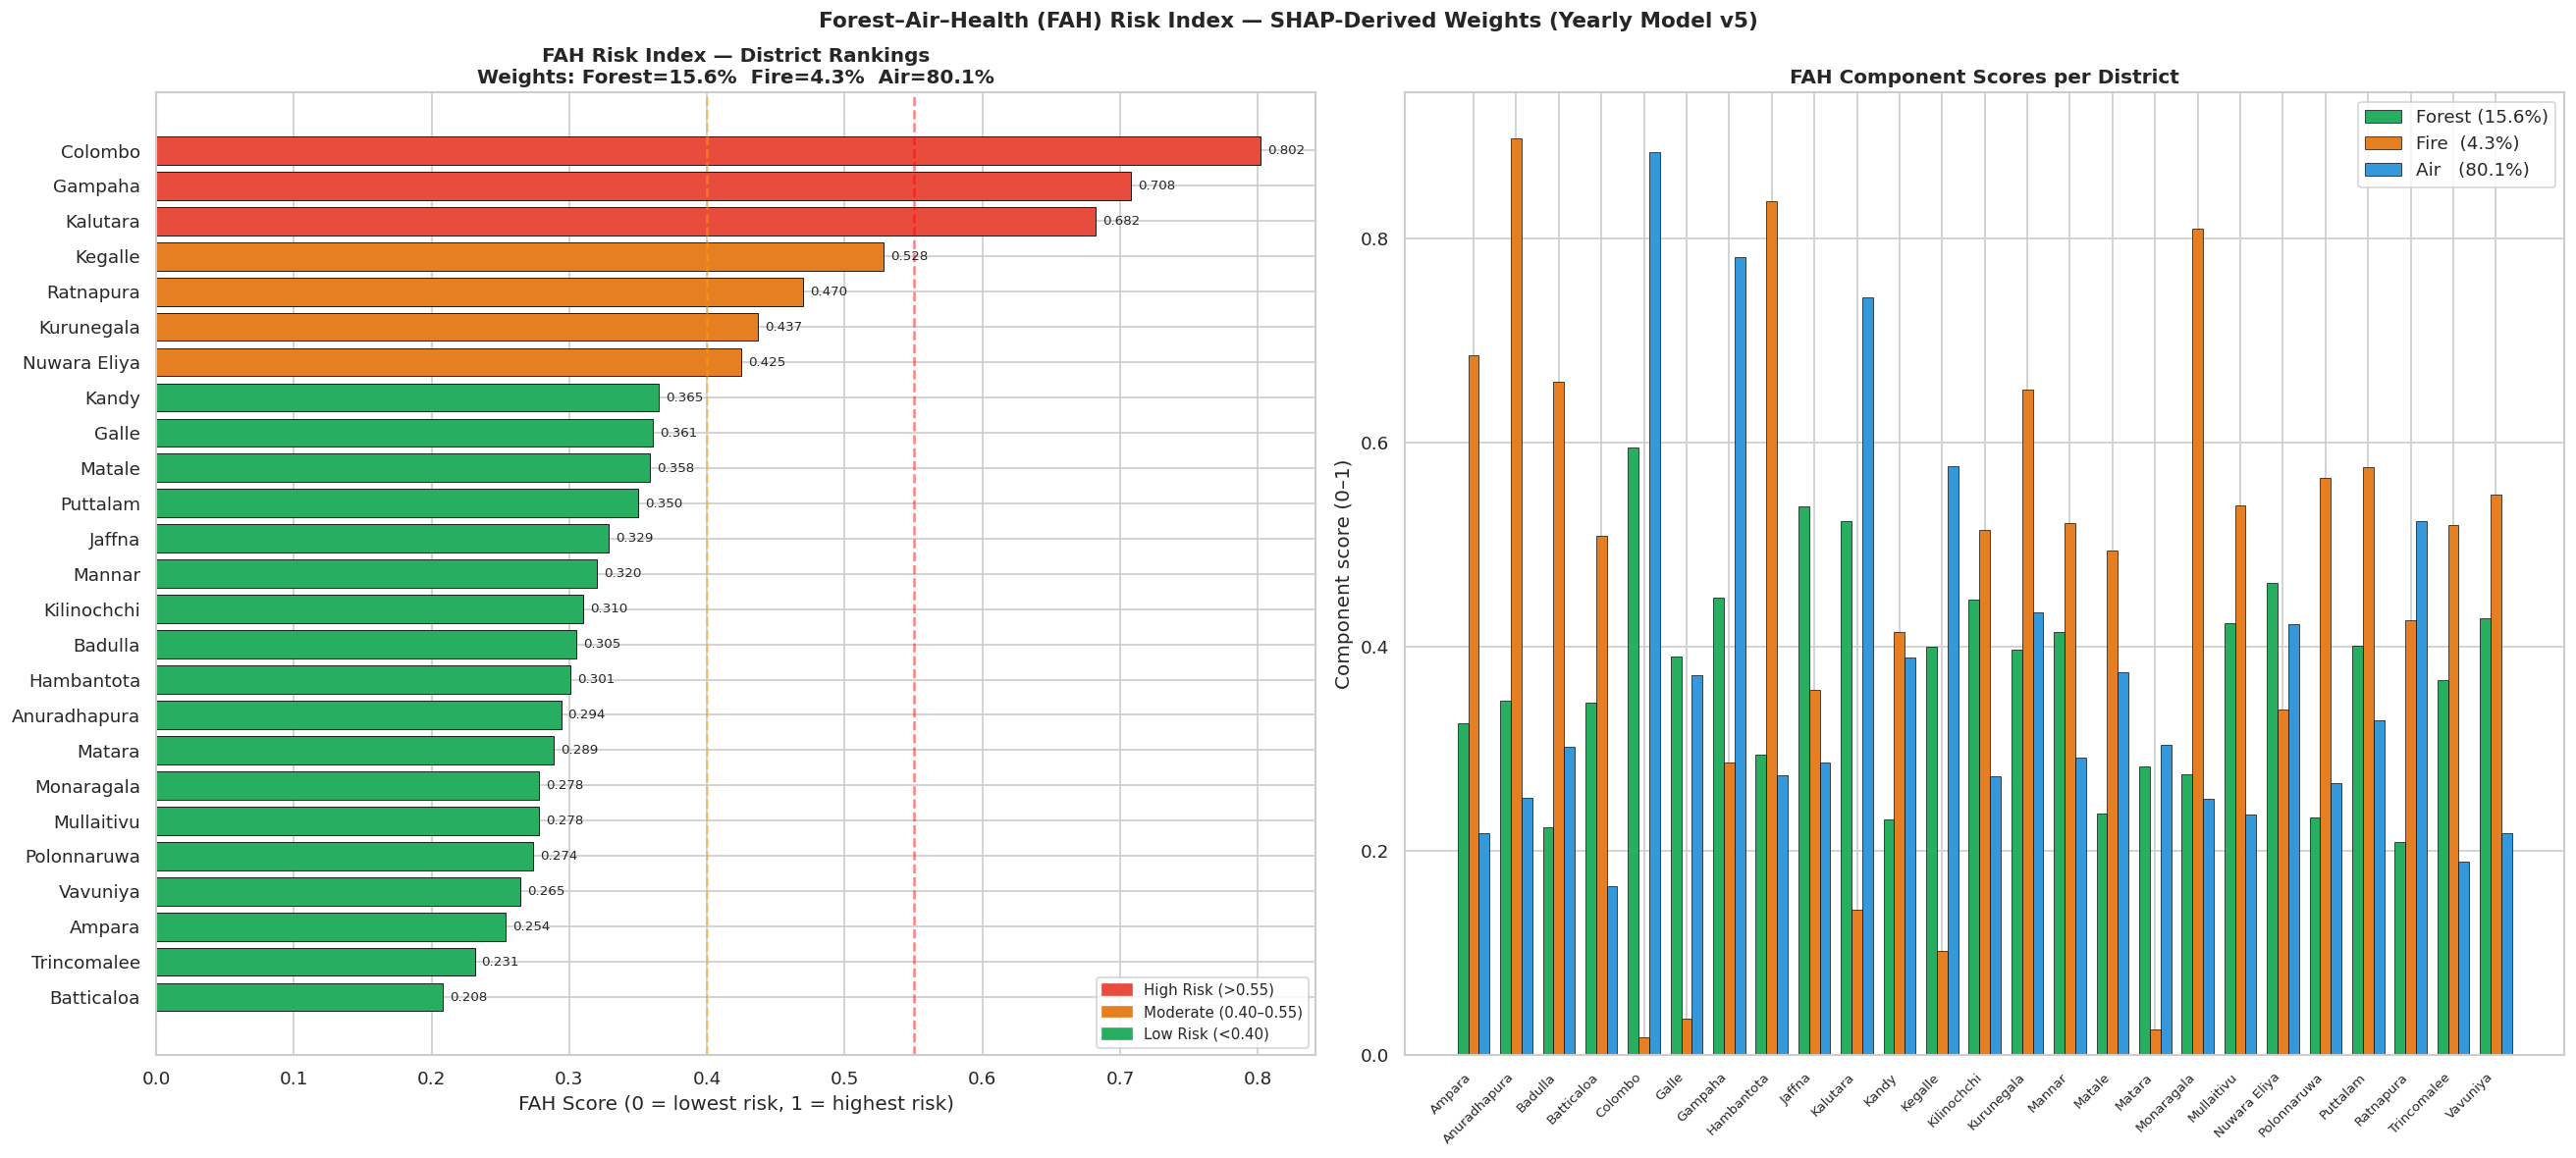
Figure 8: District FAH Risk Index and decomposed component scores, visualizing the dominance of the air quality domain and district-level risk tiers.
Limitations and Prospects for Future Research
A major limitation is the absence of explicit causal inference and direct adjustment for district-level healthcare access, urbanization, and socioeconomic factors. Annualized health data imposed aggregation, preventing sub-annual analysis of seasonality, and the spatial resolution of atmospheric models likely smooths over intra-district exposure heterogeneity. Moreover, the models cannot capture cross-boundary particulate transport or micro-environmental factors such as indoor air pollution.
Future work should incorporate disaggregated health utilization records, richer demographic covariates, vehicular and industrial emissions, as well as more granular atmospheric dispersion modeling. Extending to time-series forecasting with ARIMA or LSTM architectures and operationalizing the FAH Index as a real-time surveillance tool are promising directions.
Conclusion
This study establishes five principal findings: (1) air quality metrics, not forest loss or fire activity, overwhelmingly drive district-level variability in predicted respiratory hospital admissions; (2) the SHAP-weighted FAH Index enables nuanced, explainable stratification of environmental health risk; (3) temporal XGBoost models yield robust predictive performance given carefully engineered panel data; (4) spatial and statistical analyses delineate fundamental environmental risk archetypes in Sri Lanka; and (5) the observed decline in respiratory admissions, despite persistent environmental degradation, underscores the confounding significance of healthcare access. These insights provide a methodological and empirical foundation for targeted public health interventions and environmental regulation in rapidly urbanizing, biodiverse tropical contexts.

