Published 30 Jun 2026 in stat.AP, physics.ao-ph, and stat.ME | (2606.31957v1)
Abstract: Argo profiling floats measure seawater temperature and salinity in the upper 2000 meters of the ocean. These floats are uniquely capable of measuring the global Ocean Heat Content (OHC), a quantity that is of central importance for understanding Earth Energy Imbalance. Yet, producing Argo-based OHC estimates with reliable uncertainties is statistically challenging due to the complex structure and large size of the Argo dataset. Here we present an end-to-end mapping and uncertainty quantification framework for Argo-based OHC estimation using state-of-the-art methods from spatio-temporal statistics. The framework is based on modeling vertically integrated Argo temperature profiles as a locally stationary Gaussian process defined over space and time. This enables us to produce computationally tractable OHC anomaly maps based on data-driven decorrelation scales estimated from the Argo observations. Our modeling choices are validated using statistical cross-validation, which demonstrates the importance of including a climatological time trend in the mean field and accounting for time in the covariance function. We quantify the uncertainty of these maps using local conditional simulation ensembles, a novel approach that leads to principled spatially and temporally correlated uncertainty quantification. A new paired cross-validation technique is presented to validate these uncertainties. The mapping framework is implemented in an open-source codebase that is designed to be modular, reproducible and extensible. To demonstrate the mapping and uncertainty quantification capabilities of this approach, we present new Argo OHC maps with uncertainties for 2004-2022 and report on various downstream climatological estimates and their uncertainties.
The paper introduces a locally stationary spatio-temporal Gaussian process framework that transforms Argo profile data into uncertainty-quantified ocean heat content estimates globally and regionally.
It utilizes conditional simulation ensembles with moving-window kernel convolution to propagate spatio-temporal uncertainties and validate prediction accuracy through novel cross-validation techniques.
The methodology provides a validated global OHC trend estimate with rigorous uncertainty quantification and offers an open-source, modular pipeline for future extensions in oceanographic research.
Locally Stationary Spatio-Temporal Modeling of Argo-Based Ocean Heat Content: Methodology, Validation, and Uncertainty Quantification
Introduction and Problem Context
Quantifying ocean heat content (OHC) is central for constraining the Earth's energy imbalance (EEI), diagnosing climate system state, and evaluating mitigation efficacy. The Argo array of autonomous profiling floats, with near-global spatio-temporal coverage of upper-ocean temperature and salinity, underpins contemporary OHC estimates. However, translating raw Argo profile data into accurate, uncertainty-quantified spatio-temporal OHC fields is statistically and computationally challenging due to irregular spatial sampling, complex regional dynamics, and variable time-dependent coverage. Existing mapping products employ varied statistical strategies, but often lack end-to-end uncertainty propagation, data-driven decorrelation modeling, or reproducible open-source implementations.
This manuscript proposes a locally stationary spatio-temporal Gaussian process (GP) modeling framework, combined with a robust conditional simulation uncertainty quantification approach, for mapping vertically integrated OHC fields using Argo data. The method is validated across multiple modeling variants and delivers comprehensive global and regional OHC fields with rigorous uncertainties, spanning 2004–2022. The technique is fully open-source and modular, intended for both research reproducibility and future methodological extension.
Methodological Framework
Statistical Model Formulation
The vertical integral of OHC between depths zu and zd at position (x,y) and time t is modeled as: OHCzuzd(x,y,t)=μ(x,y,t)+a(x,y,t)+ε(x,y,t)
where μ captures the mean climatological field (seasonally varying with optional linear/quadratic time trends), a represents zero-mean spatio-temporal anomalies, and ε reflects nugget (unresolved small-scale variability).
The methodology comprises:
Vertical integration using PCHIP interpolation for robust handling of heterogeneous vertical profiles.
Mean field estimation via local polynomial regression, incorporating seasonal harmonics and potentially nonzero linear/quadratic temporal trends.
Anomaly mapping through moving-window locally stationary GP regression, with all model parameters, including spatial (longitude, latitude) and temporal decorrelation scales, estimated adaptively from local data.
Uncertainty quantification using conditional simulation ensembles derived via local kernel convolution approaches, producing spatially and temporally correlated samples consistent with the local GP model.
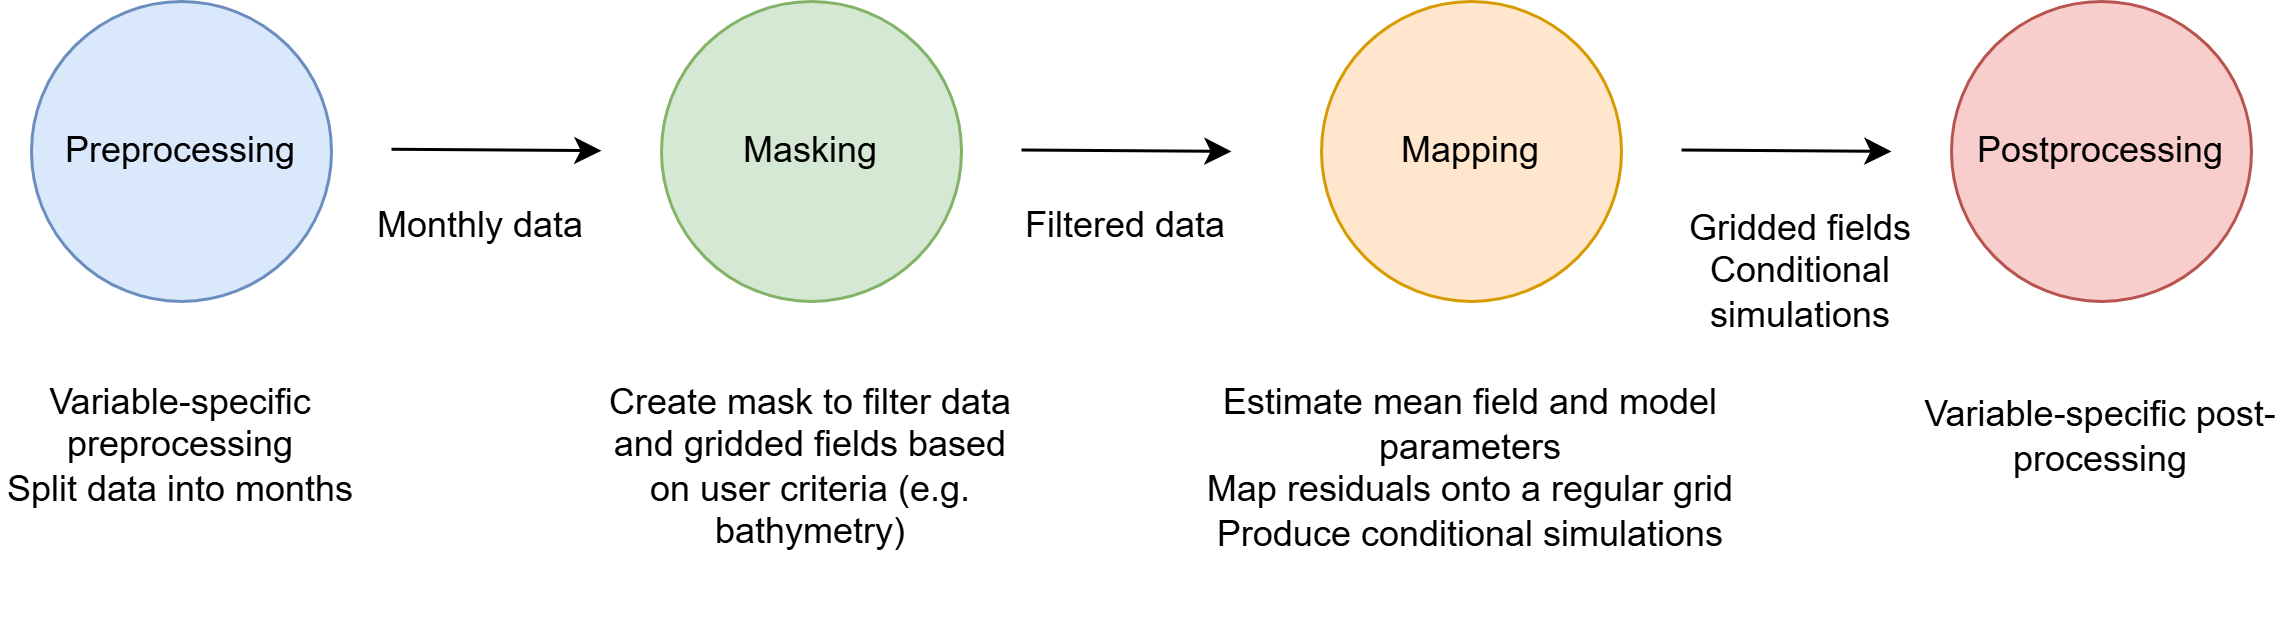
Figure 1: Four-stage software pipeline supporting preprocessing, spatial-temporal masking, mapping, and postprocessing for OHC mapping with Argo data.
The software pipeline is modular, enabling each step's reproducibility, extensibility, and application to other oceanographic fields.
Local Conditional Simulation
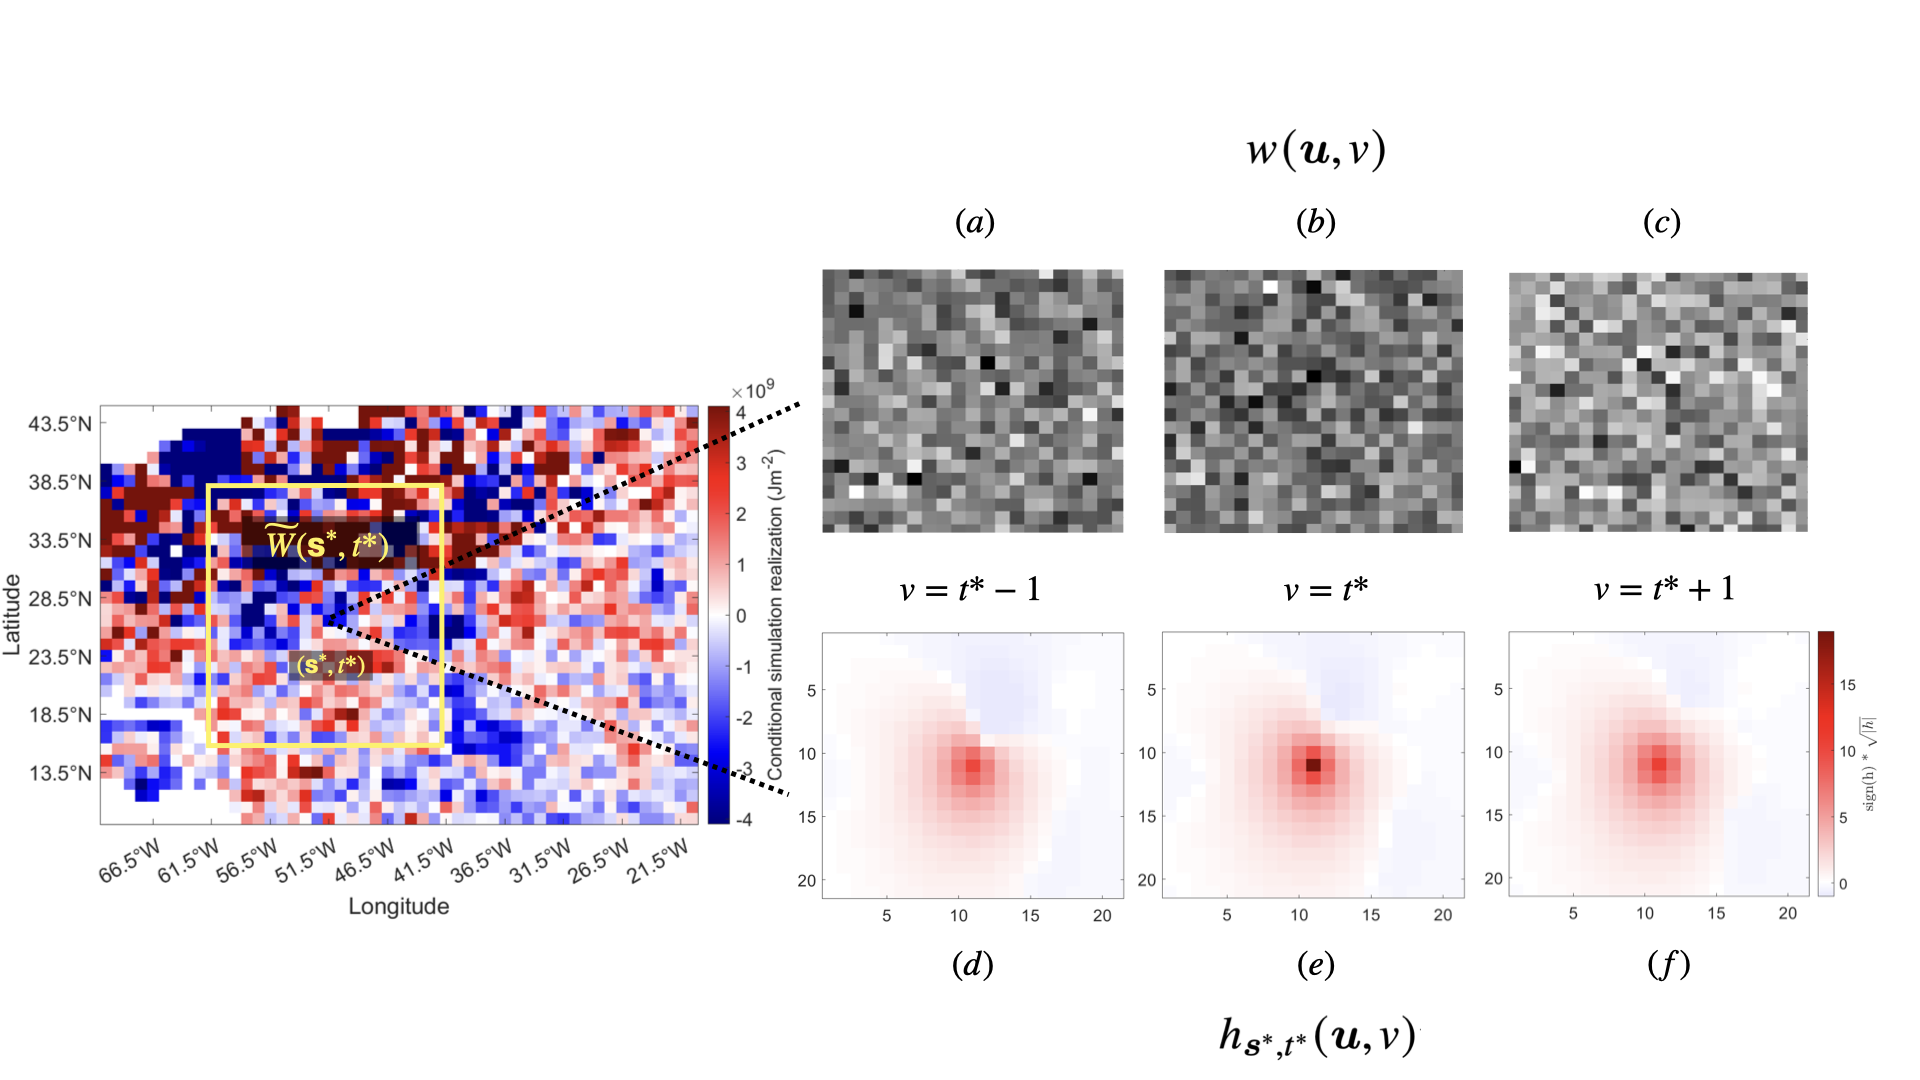
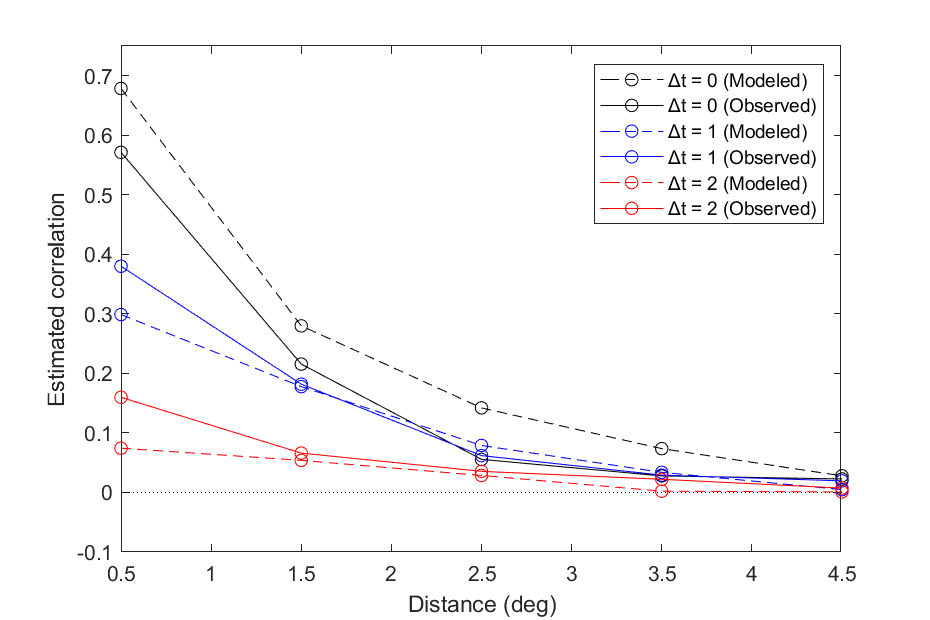
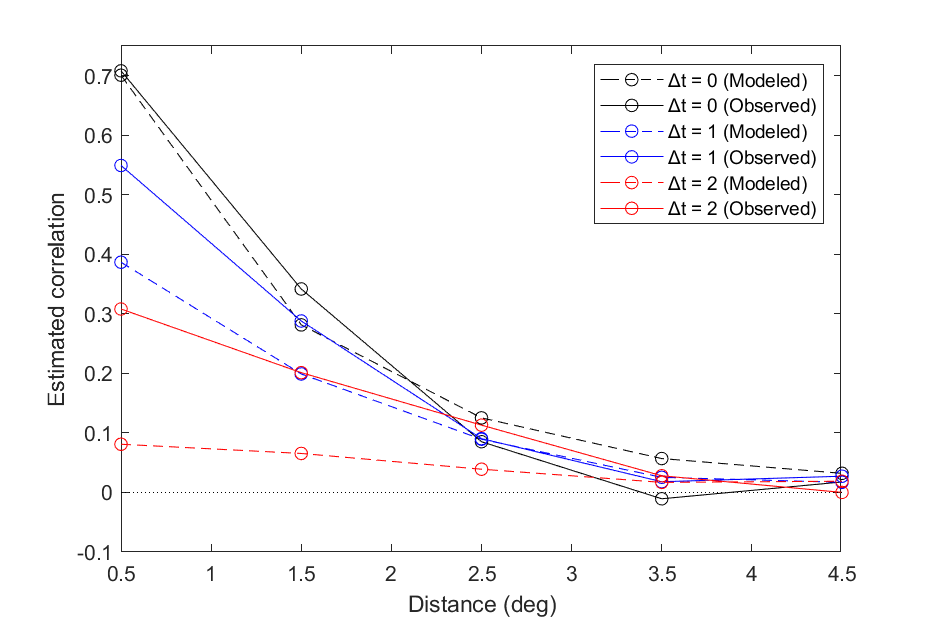
Uncertainty quantification proceeds by generating conditional realizations from the multivariate field GP, efficiently approximated using a moving-window convolutional approach. This permits full spatio-temporal covariance propagation into ensemble-based uncertainty estimates of downstream quantities (e.g., global OHC integrals, regional trends, derivatives). The conditional simulations are cross-validated using a novel paired leave-one-float-out approach to confirm that simulated correlations match empirical ones across space–time lags.
Figure 2: Schematic of local conditional simulation in a North Atlantic region; the simulated value at the center (yellow) is generated by convolution of white noise with window-specific kernel.
Validation and Sensitivity Analysis
Impact of Mean Field Time Trend
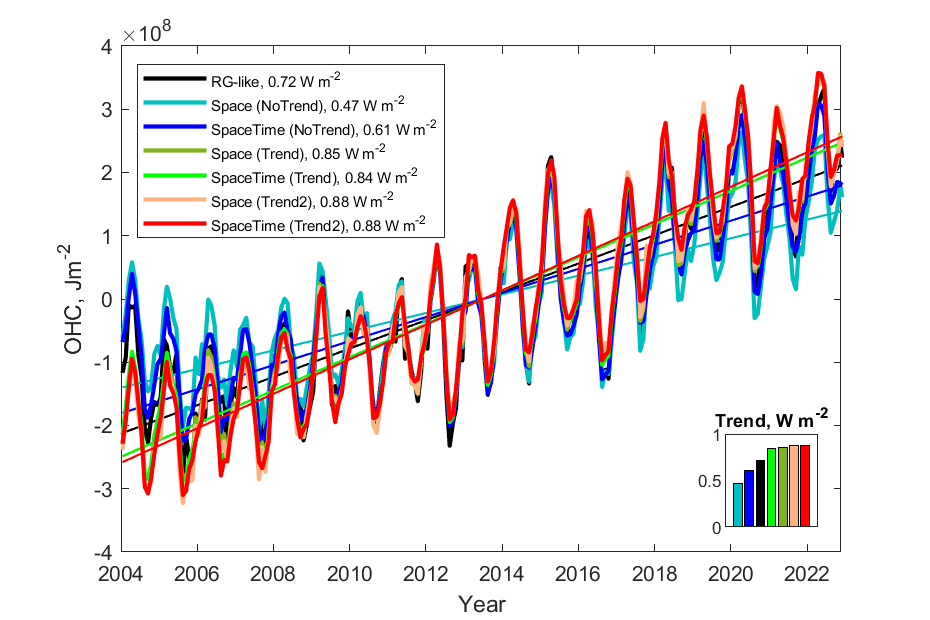
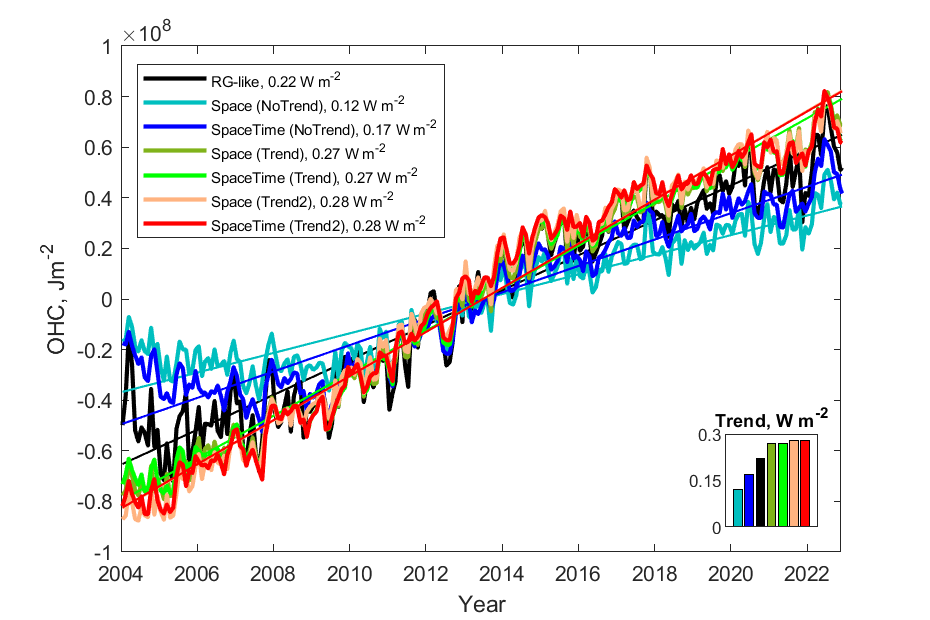
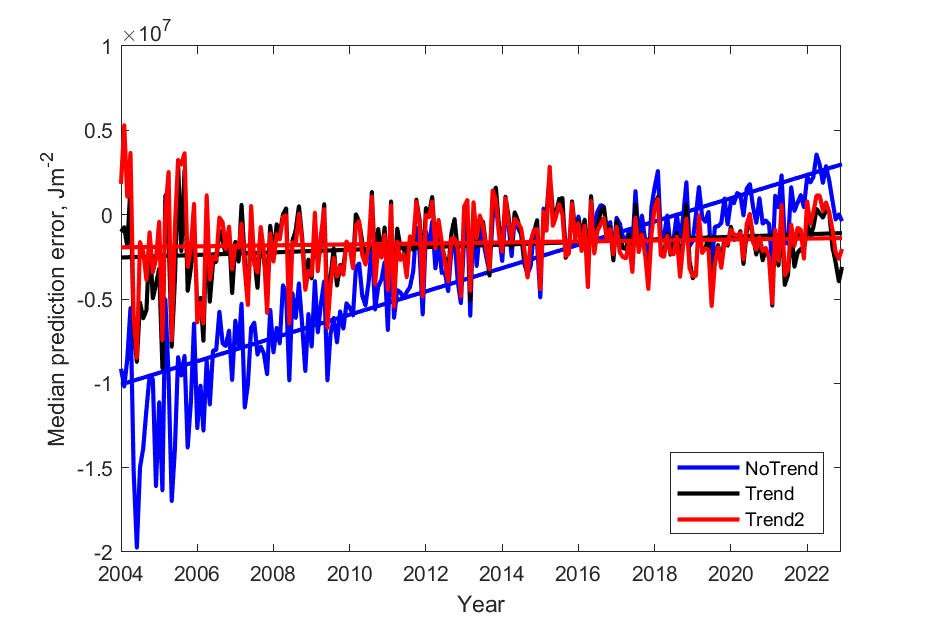
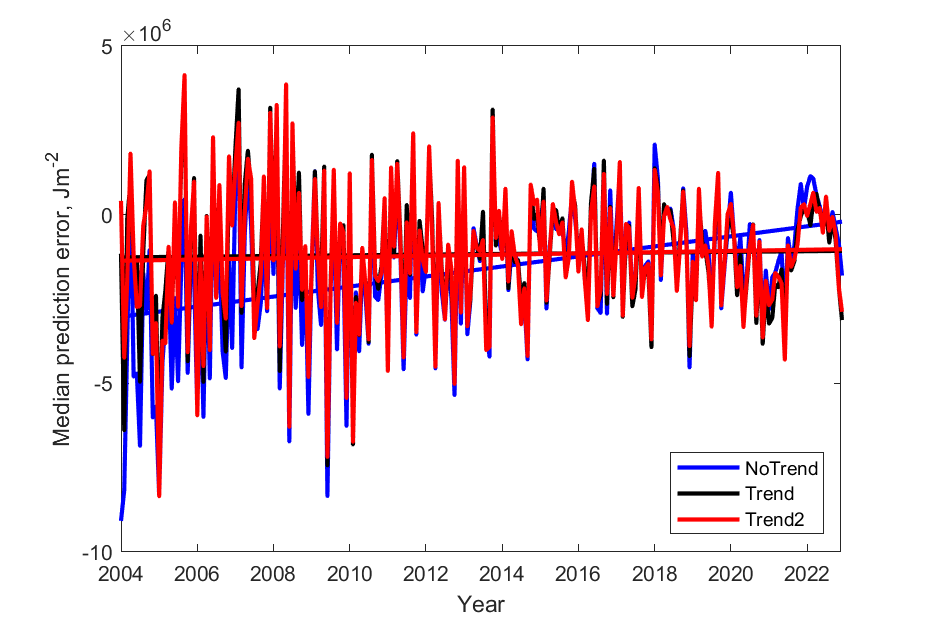
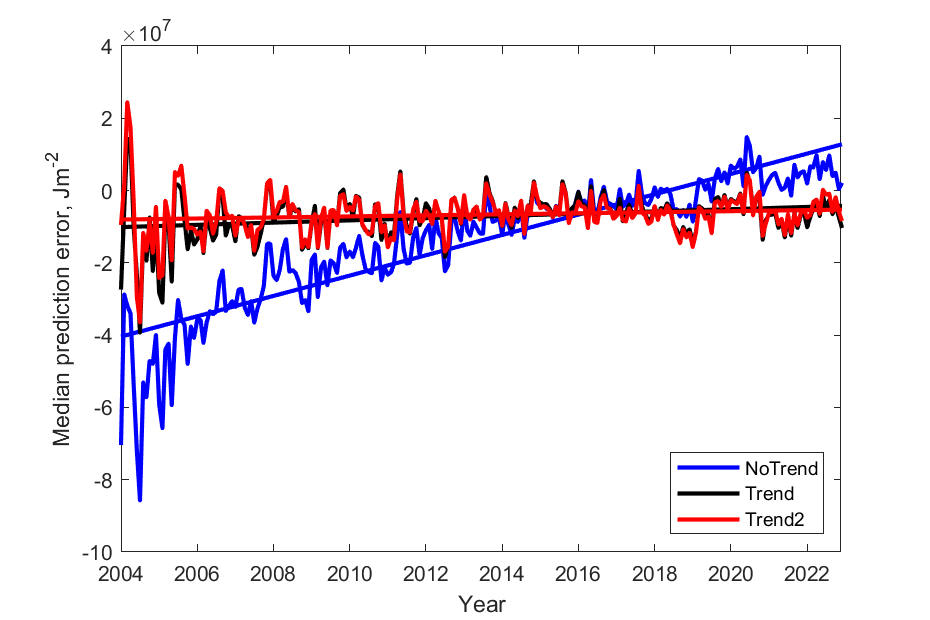
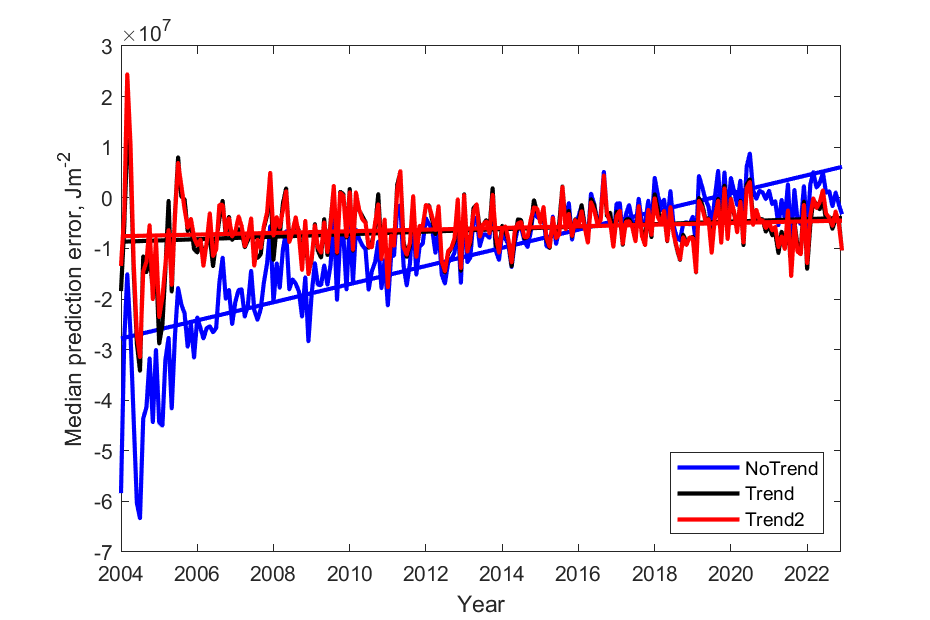
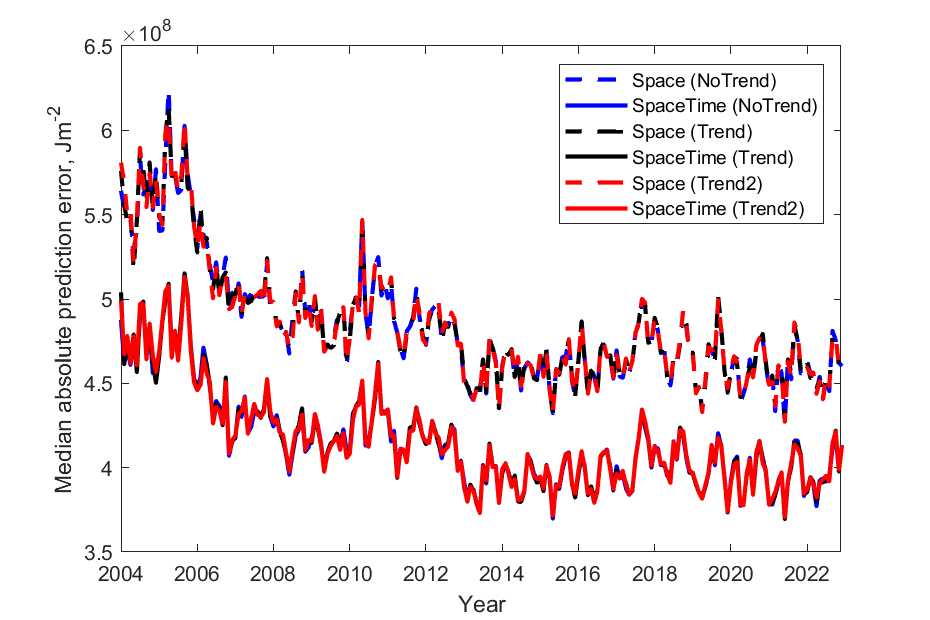
Comparisons across mean field configurations (no trend, linear, quadratic) reveal that excluding time trends yields severely underestimated global OHC trends—with magnitude differences of nearly 87–133% in the upper and mid-ocean, respectively. Cross-validated prediction errors display systematic temporally varying bias only for no-trend models, indicating statistical misspecification. Including at least a linear trend removes bias and is empirically favored.
Figure 3: Ocean heat content time series and trends under different mean field and covariance modeling choices.
Figure 4: Cross-validated monthly median prediction errors (midocean) for different modeling choices, demonstrating bias in the absence of a time trend.
Space-Time Covariance Structure
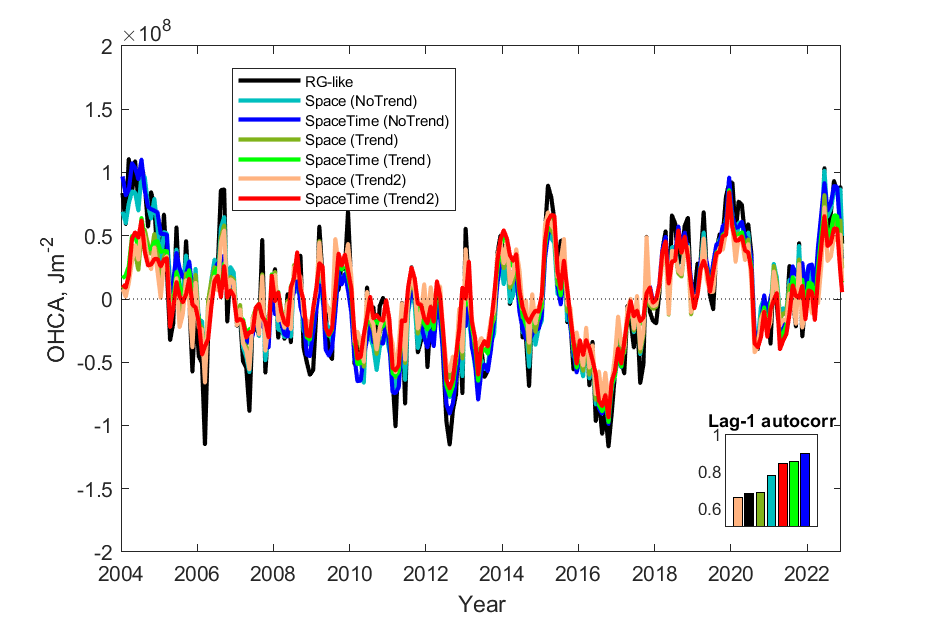
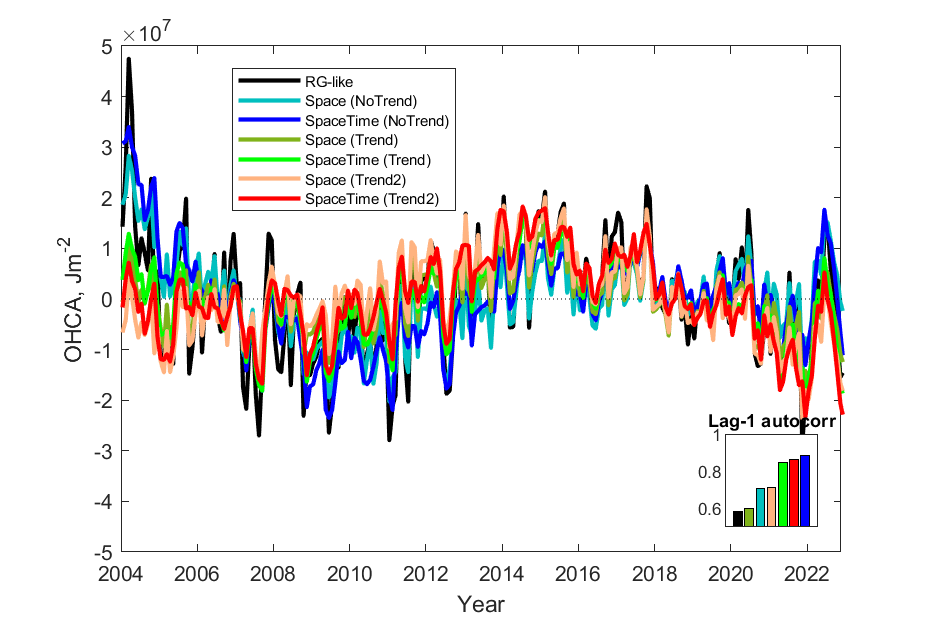
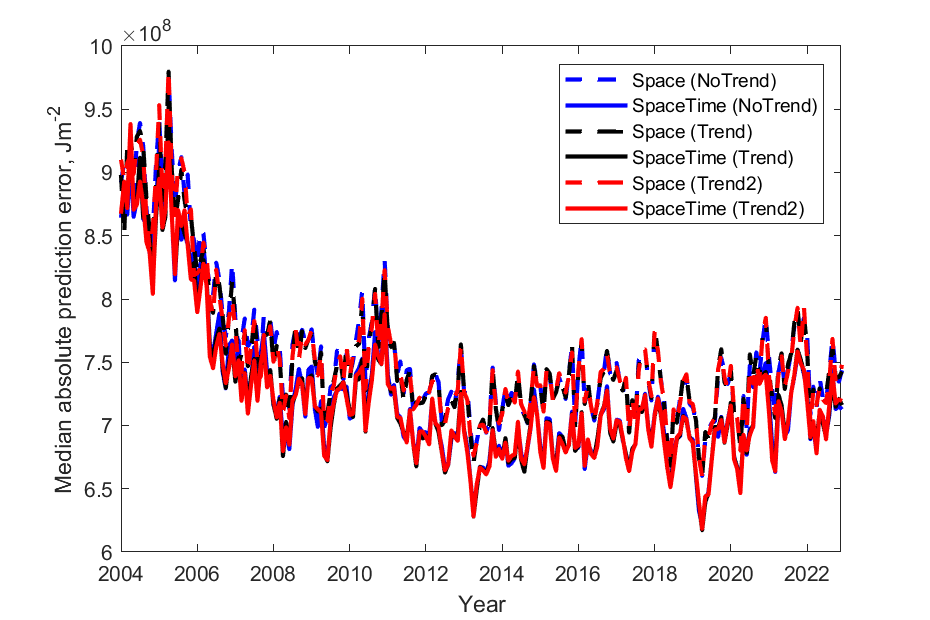
Including temporal decorrelation in the GP covariance function yields smoother mapped anomaly time series and more realistic lag-1 autocorrelation, especially at fine time scales. Cross-validation demonstrates a consistent reduction in prediction errors with space-time (vs. space-only) covariance, most pronounced in optimized local windows.
Figure 5: OHC anomalies for different modeling choices, with insets displaying lag-1 autocorrelation. Space-time models produce smoother, more correlated fields.
Figure 6: Cross-validated monthly median absolute prediction errors (upper ocean) for different modeling choices, highlighting improved accuracy with space-time covariance.
Uncertainty Quantification Validation
Cross-validation of the conditional simulation ensembles indicates that simulated and observed spatio-temporal correlation decay curves agree closely, confirming that the approach captures spatial and temporal autocorrelation structure faithfully, particularly in the upper ocean. Residual discrepancies, especially for midocean and larger lags, point to potential for further covariance structure refinement.
Figure 7: Observed (solid) vs. simulation-modeled (dashed) spatio-temporal conditional dependence for upper ocean and midocean anomaly pairs.
Applied Results: OHC Fields, Uncertainties, and Downstream Metrics
Global OHC Time Series and Trends
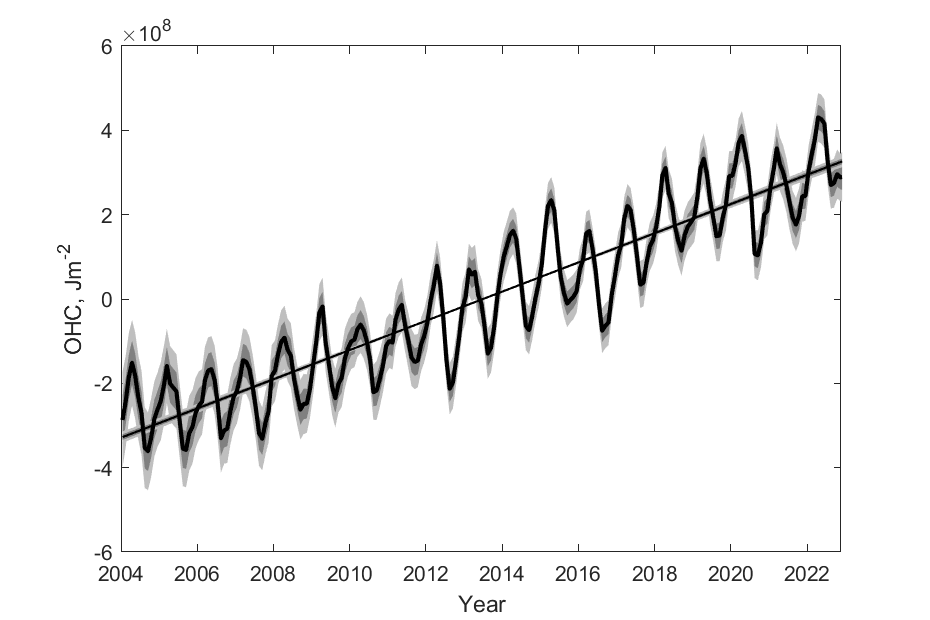
Applying the pipeline to 2004–2022 Argo data produces a global OHC trend estimate of 1.114±0.024 W/m2 (68% uncertainty, relative to Argo-sampled global area) for the 15–1850 dbar domain. Uncertainties, rigorously propagated via the conditional simulation ensemble, narrow with increasing data density post-Argo array maturity.
Figure 8: Total global OHC (15–1850 dbar) with fitted trend and conditional simulation-derived 68% and 95% confidence intervals.
Anomalies and Ocean Heat Uptake (OHU)
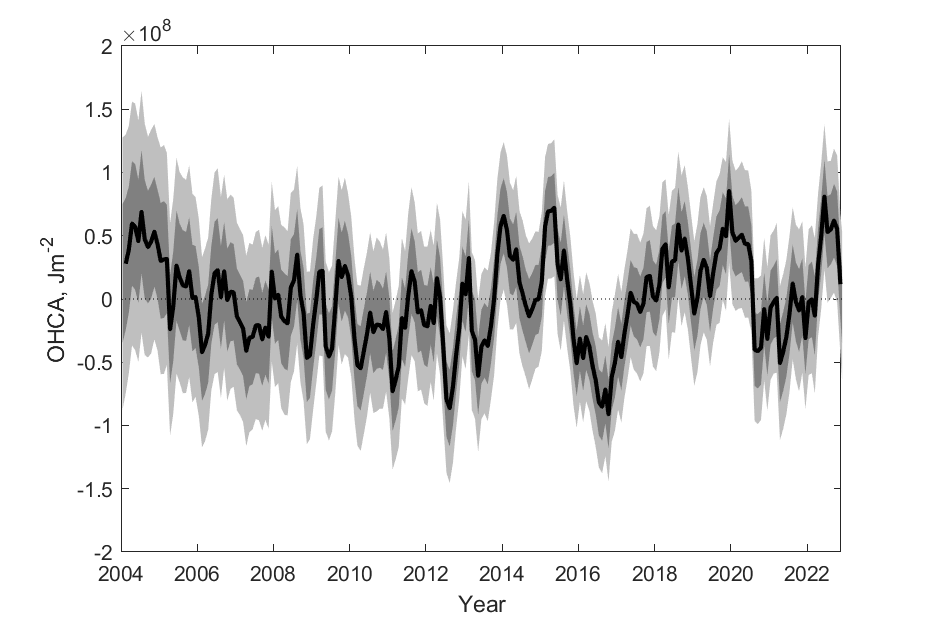
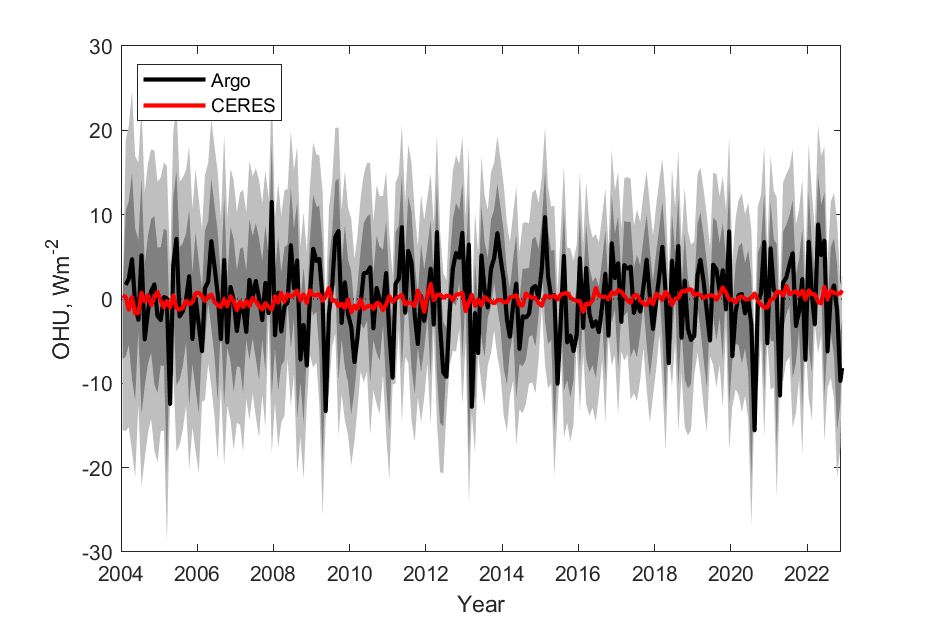
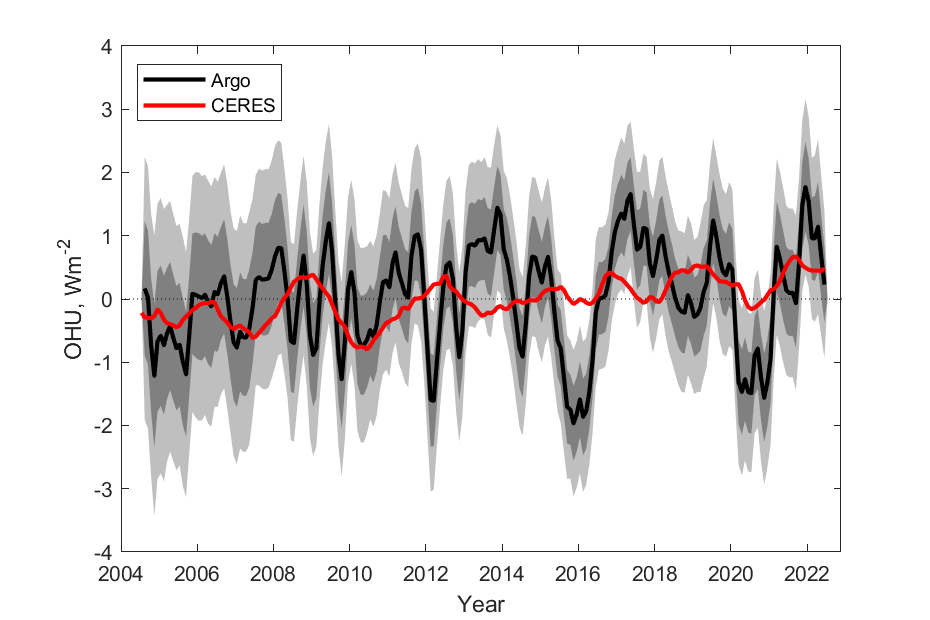
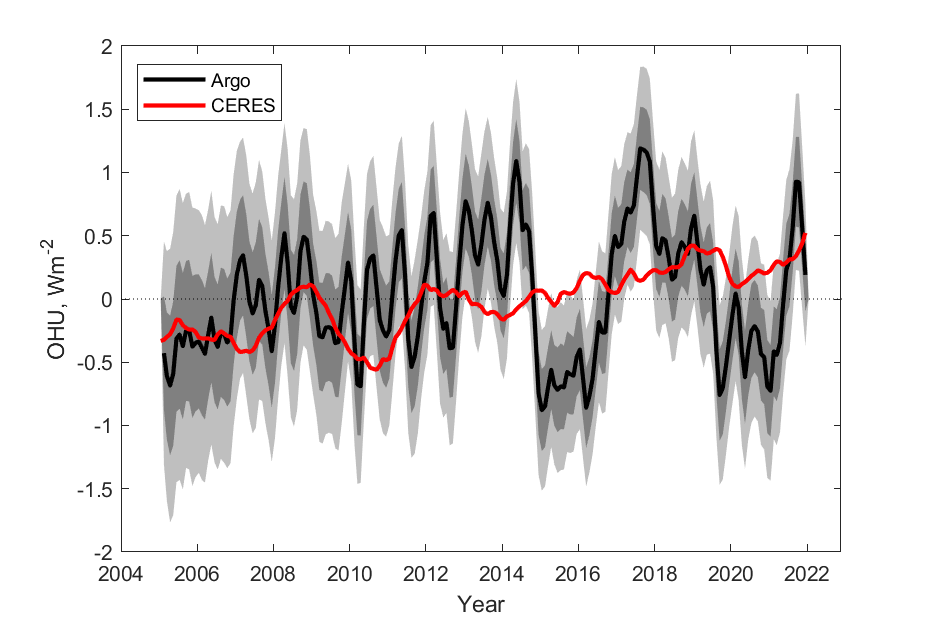
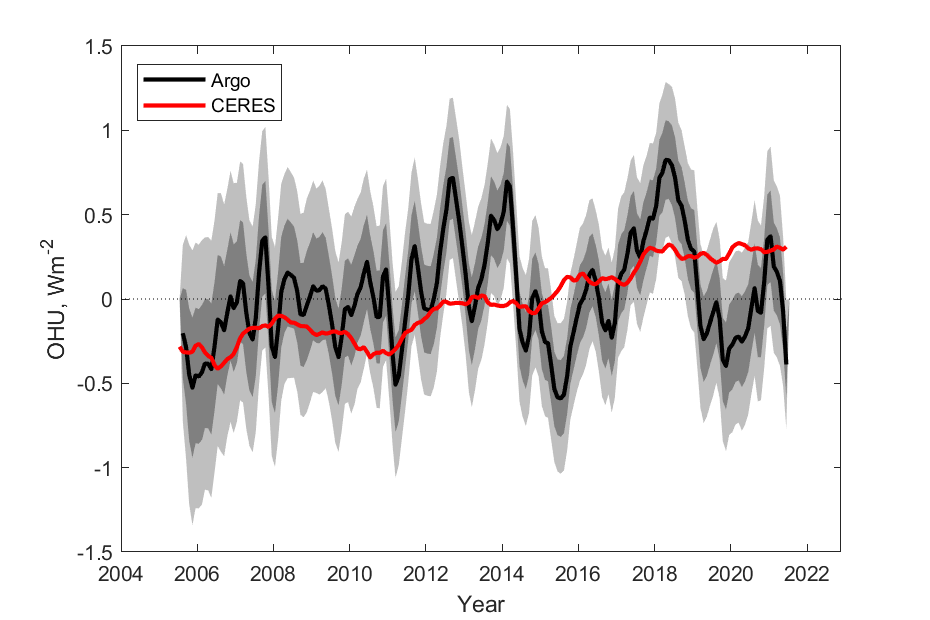
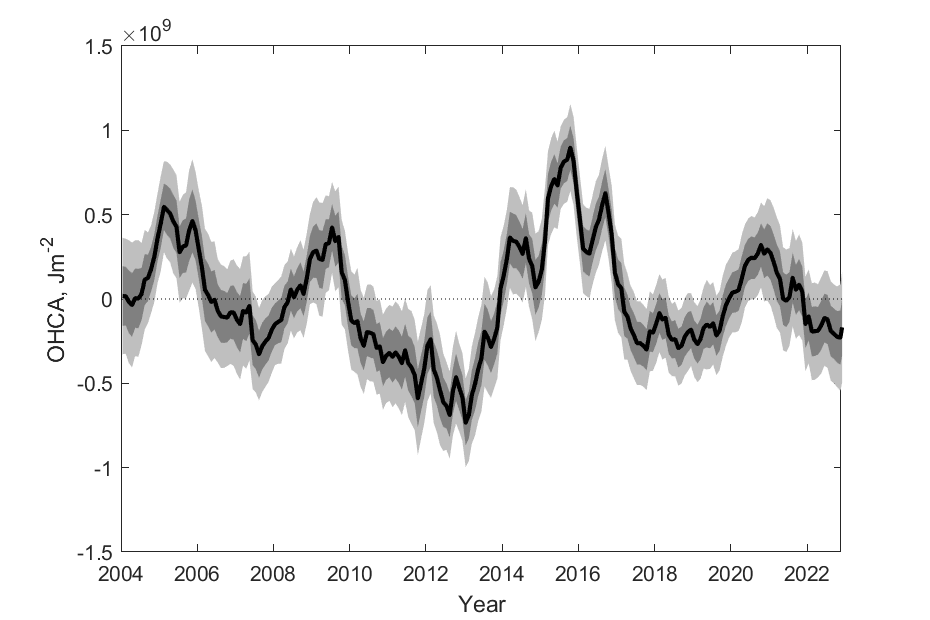
Deseasonalized, detrended OHC anomaly time series exhibit reduced uncertainty in later years. Moving-average filtering sharpens interannual signals, making statistically significant events (e.g., post-2016 El Niño cooling) more apparent. First-difference OHU estimates, compared to satellite-observed TOA net flux, display consistent multi-year variations, although high-frequency variance patterns differ.
Figure 9: Total global OHC (15–1850 dbar) anomalies with conditional simulation ensemble-derived uncertainties.
Figure 10: Ocean heat uptake (OHU; 15–1850 dbar) anomalies with uncertainties, compared against CERES TOA net flux anomalies.
Regional Patterns and Significance
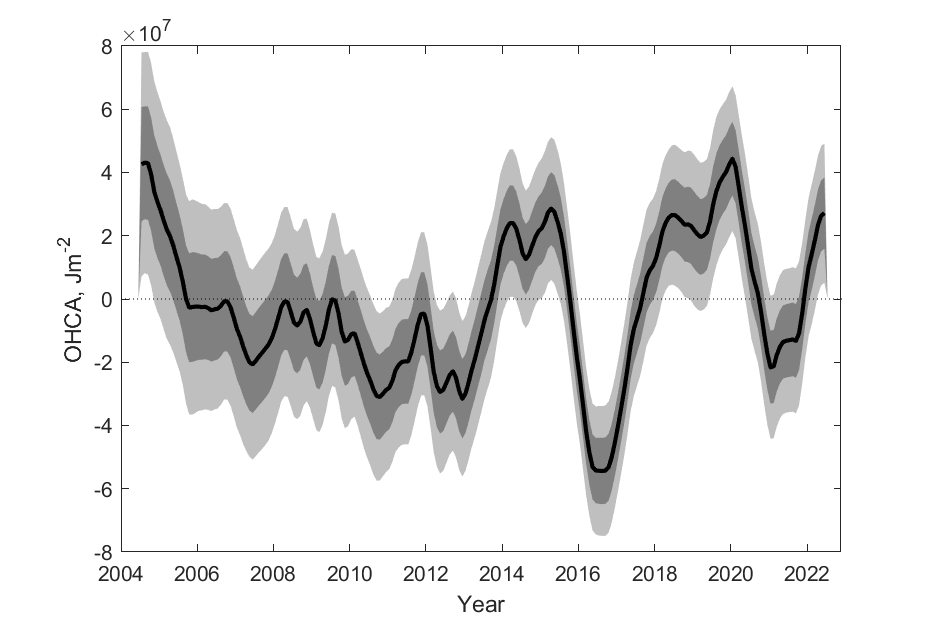
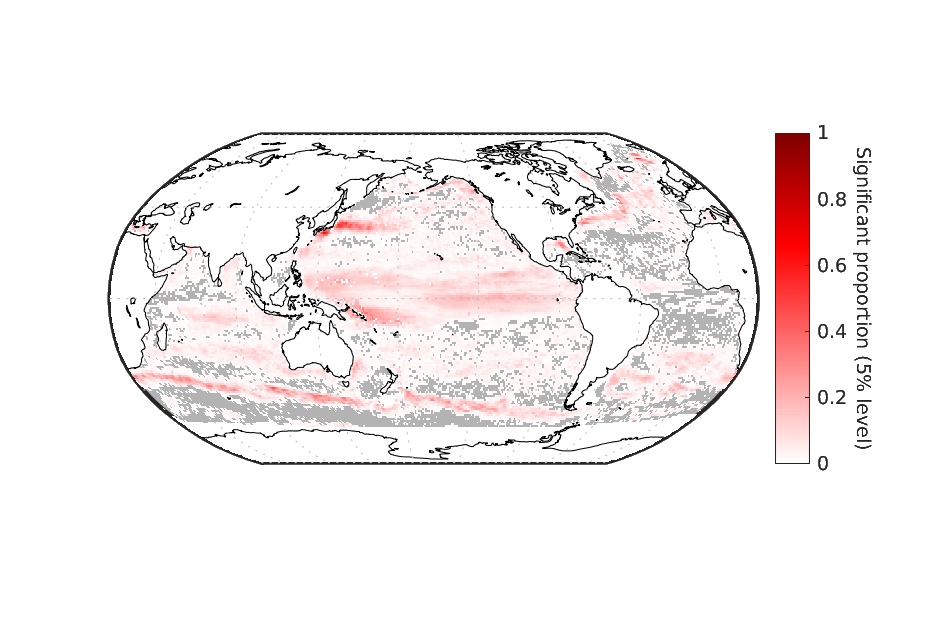
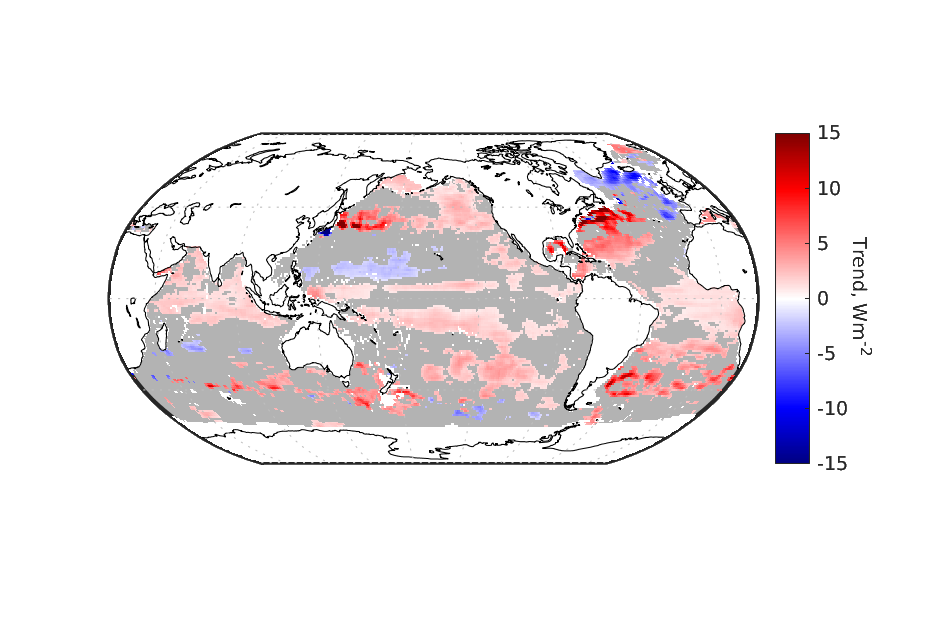
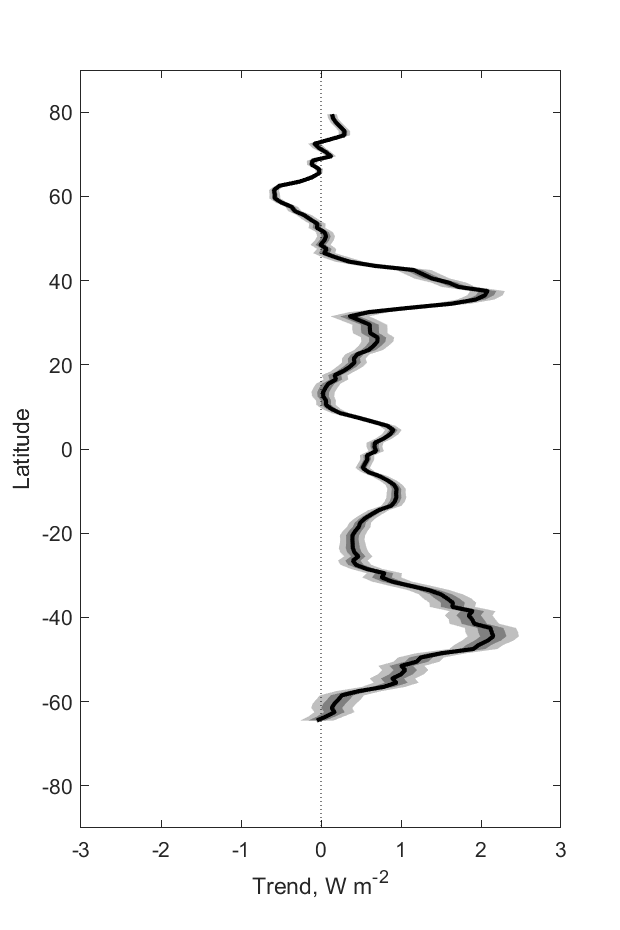
Regionally resolved significance maps reveal highest rates of statistically significant monthly OHC anomalies in dynamic zones such as the ACC and western boundary currents. Zonal trend decomposition highlights hemispheric asymmetries and locates the strongest warming at mid-latitudes, consistent with the distribution of Argo coverage and regional dynamical regimes.
Figure 12: Regional OHC linear trend map at 5% significance, and zonal contributions to the global trend with uncertainty bands.
Regional Time Series and Cross-Correlation
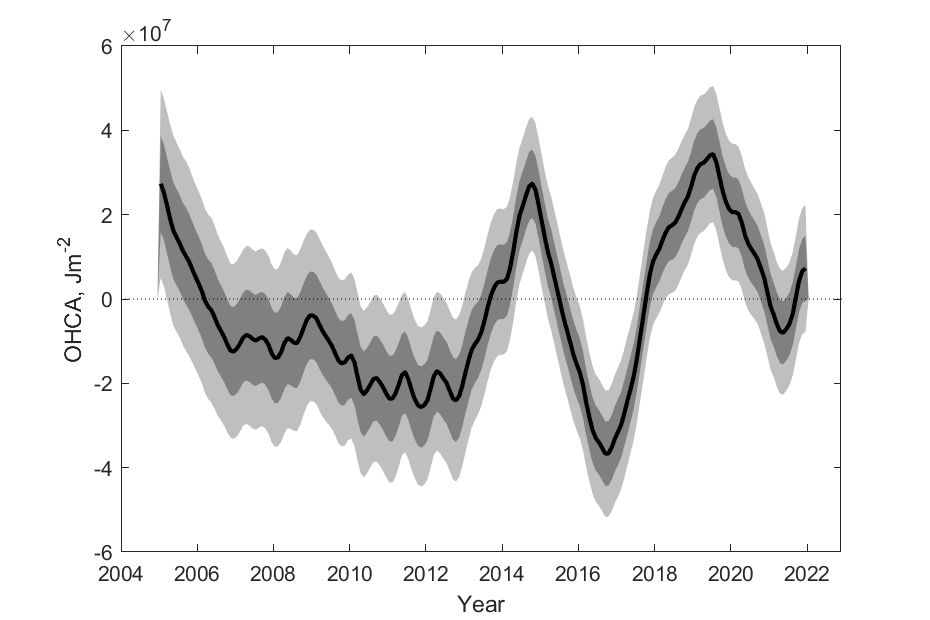
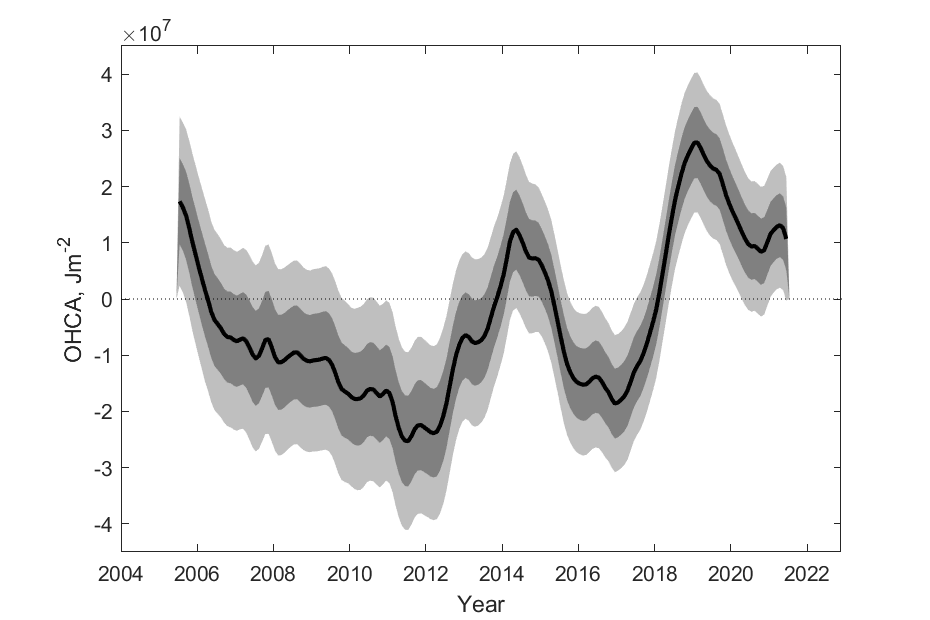
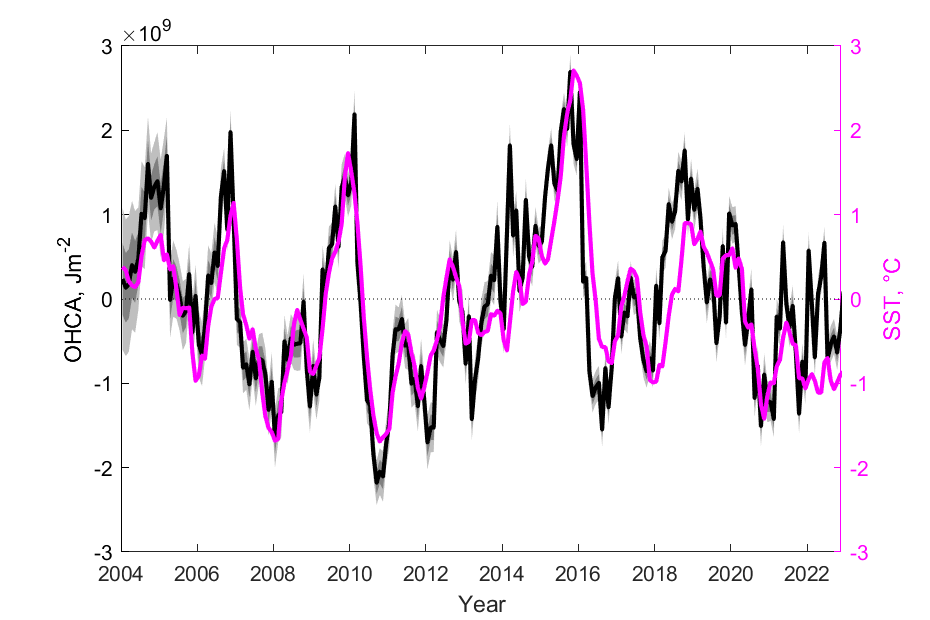
Time series for climatologically significant regions—e.g., Niño 3.4 and the Northeast Pacific "Blob"—capture key interannual variability and marine heatwave signatures, with region-specific uncertainty envelopes reflecting both data density and intrinsic spatio-temporal decorrelation scales.
Figure 13: Regional OHC (15–1850 dbar) anomaly time series (area-normalized) with uncertainties for Niño 3.4 and Northeast Pacific regions.
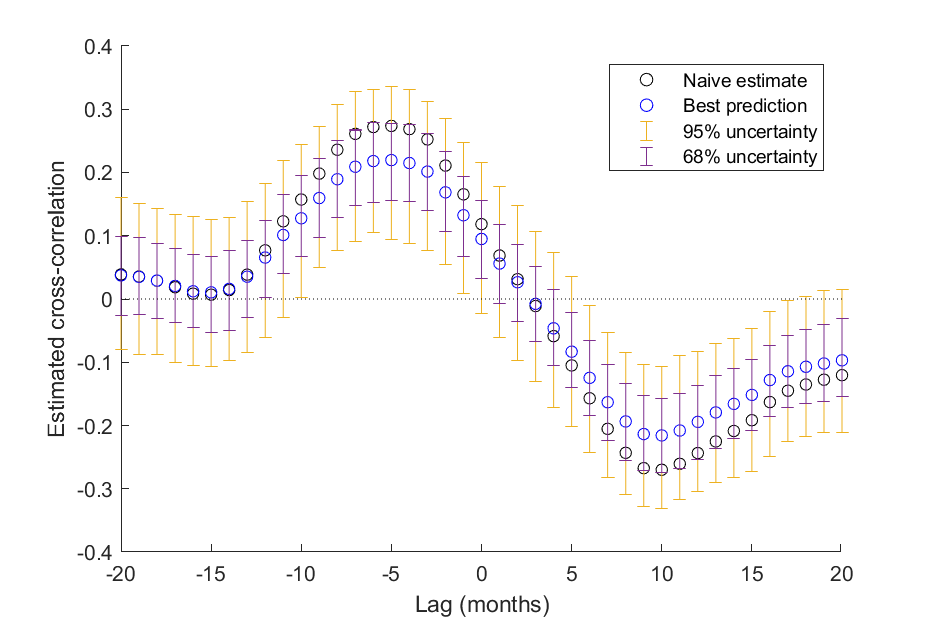
Lagged cross-correlation analysis between global upper-ocean OHC anomalies and Niño 3.4 SST demonstrates maximal correlation at lags near –5 and +10 months, implicating global-scale OHC as a leading indicator for ENSO-related SST anomalies.
Figure 14: Cross-correlation between global upper ocean (15–975 dbar) OHC anomalies and Niño 3.4 SST, showing ensemble-based uncertainty intervals.
Implications and Future Directions
The proposed framework establishes a robust, data-driven baseline for physical ocean mapping under realistic data coverage scenarios. Key implications include:
Practical: The mapping pipeline is open-source, modular, and already accepted by the climate science community for use in multi-product assessments, providing a transparent tool for both global trend monitoring and regional process study.
Theoretical: This work formalizes the essential role of locally estimated spatio-temporal covariance and explicit mean trend modeling for credible OHC trend extraction. It also demonstrates the necessity of ensemble-based uncertainty propagation for credible uncertainty intervals on any nonlinear metric derived from mapped fields.
Future developments may involve:
Hierarchical modeling of vertical section covariance for improved full-depth uncertainty quantification.
Integration of satellite-based sea surface observations directly in a coherent spatio-temporal statistical modeling framework.
Extension to higher vertical resolution and/or mapping of additional biogeochemical or dynamical fields with the same methodology.
Leveraging recent advances in neural spatial process approximation for scalability to truly global, multivariable, high-resolution datasets.
Conclusion
This work introduces and validates a statistically rigorous, locally stationary spatio-temporal GP framework for Argo-based OHC mapping with comprehensive, ensemble-based uncertainty quantification. The methodology demonstrates strong empirical performance across a range of mapping tasks, resolves several previously open modeling issues (notably mean trend correction and spatio-temporal resolution), and is now available as a reproducible research toolkit. The approach sets a high standard for future inference-ready ocean climate products and establishes a solid foundation for next-generation uncertainty-aware process-based oceanographic studies.