- The paper introduces a novel safety index that integrates multi-year crash data with real-time connected-vehicle telemetry using EB stabilization and hybrid MCDM.
- The methodology employs parallel RT–SI and MCDM pipelines with CRITIC weighting and operational uplift factors to compute 15-minute safety scores.
- Results demonstrate robust diurnal risk trends and strong correlations among exposure variables, supporting applications in agency monitoring and autonomous systems.
Virginia Tech Transportation Safety Index: Real-Time Hybrid Safety Assessment
Motivation and Context
Conventional intersection safety assessment relies on retrospective multi-year crash records, lacking real-time adaptability to evolving operational conditions. Commercial routing platforms prioritize travel time, omitting granular, safety-aware signals. Modern vendor systems are typically opaque, limited to a narrow set of operational metrics, and do not transparently integrate long-term crash data with real-time multimodal exposure or behavioral features. The proliferation of high-frequency connected-vehicle telemetry and IoT sensing has created an opportunity for real-time safety quantification, yet existing frameworks inadequately unify historical crash risk and dynamic behavioral signals.
The Virginia Tech Transportation Safety Index (VTTSI) was developed as a cloud-native, interpretable, and exposure-adjusted safety framework, blending Empirical Bayes (EB) crash stabilization, operational uplift factors, and a CRITIC-weighted hybrid Multi-Criteria Decision-Making (MCDM) pipeline. The index responds to multimodal, real-time telemetry, yielding a 15-minute interval safety score suitable for agency monitoring, fleet management, and autonomous vehicle integration.
Methodological Architecture
The VTTSI is structured around two parallel safety index engines:
- RT–SI: Anchored in severity-weighted historical crash statistics, stabilized by EB estimation, and dynamically adjusted by operational uplift factors reflecting speed deficit, speed variance, and conflict activity.
- Hybrid MCDM: Synthesizes instantaneous operational signals using SAW, EDAS, and CODAS methods, weighted objectively via the CRITIC approach to handle feature correlation and criterion informativeness.
The blended output (α-controlled) harmonizes both deep temporal risk and instantaneous disturbance, producing a unified safety metric.
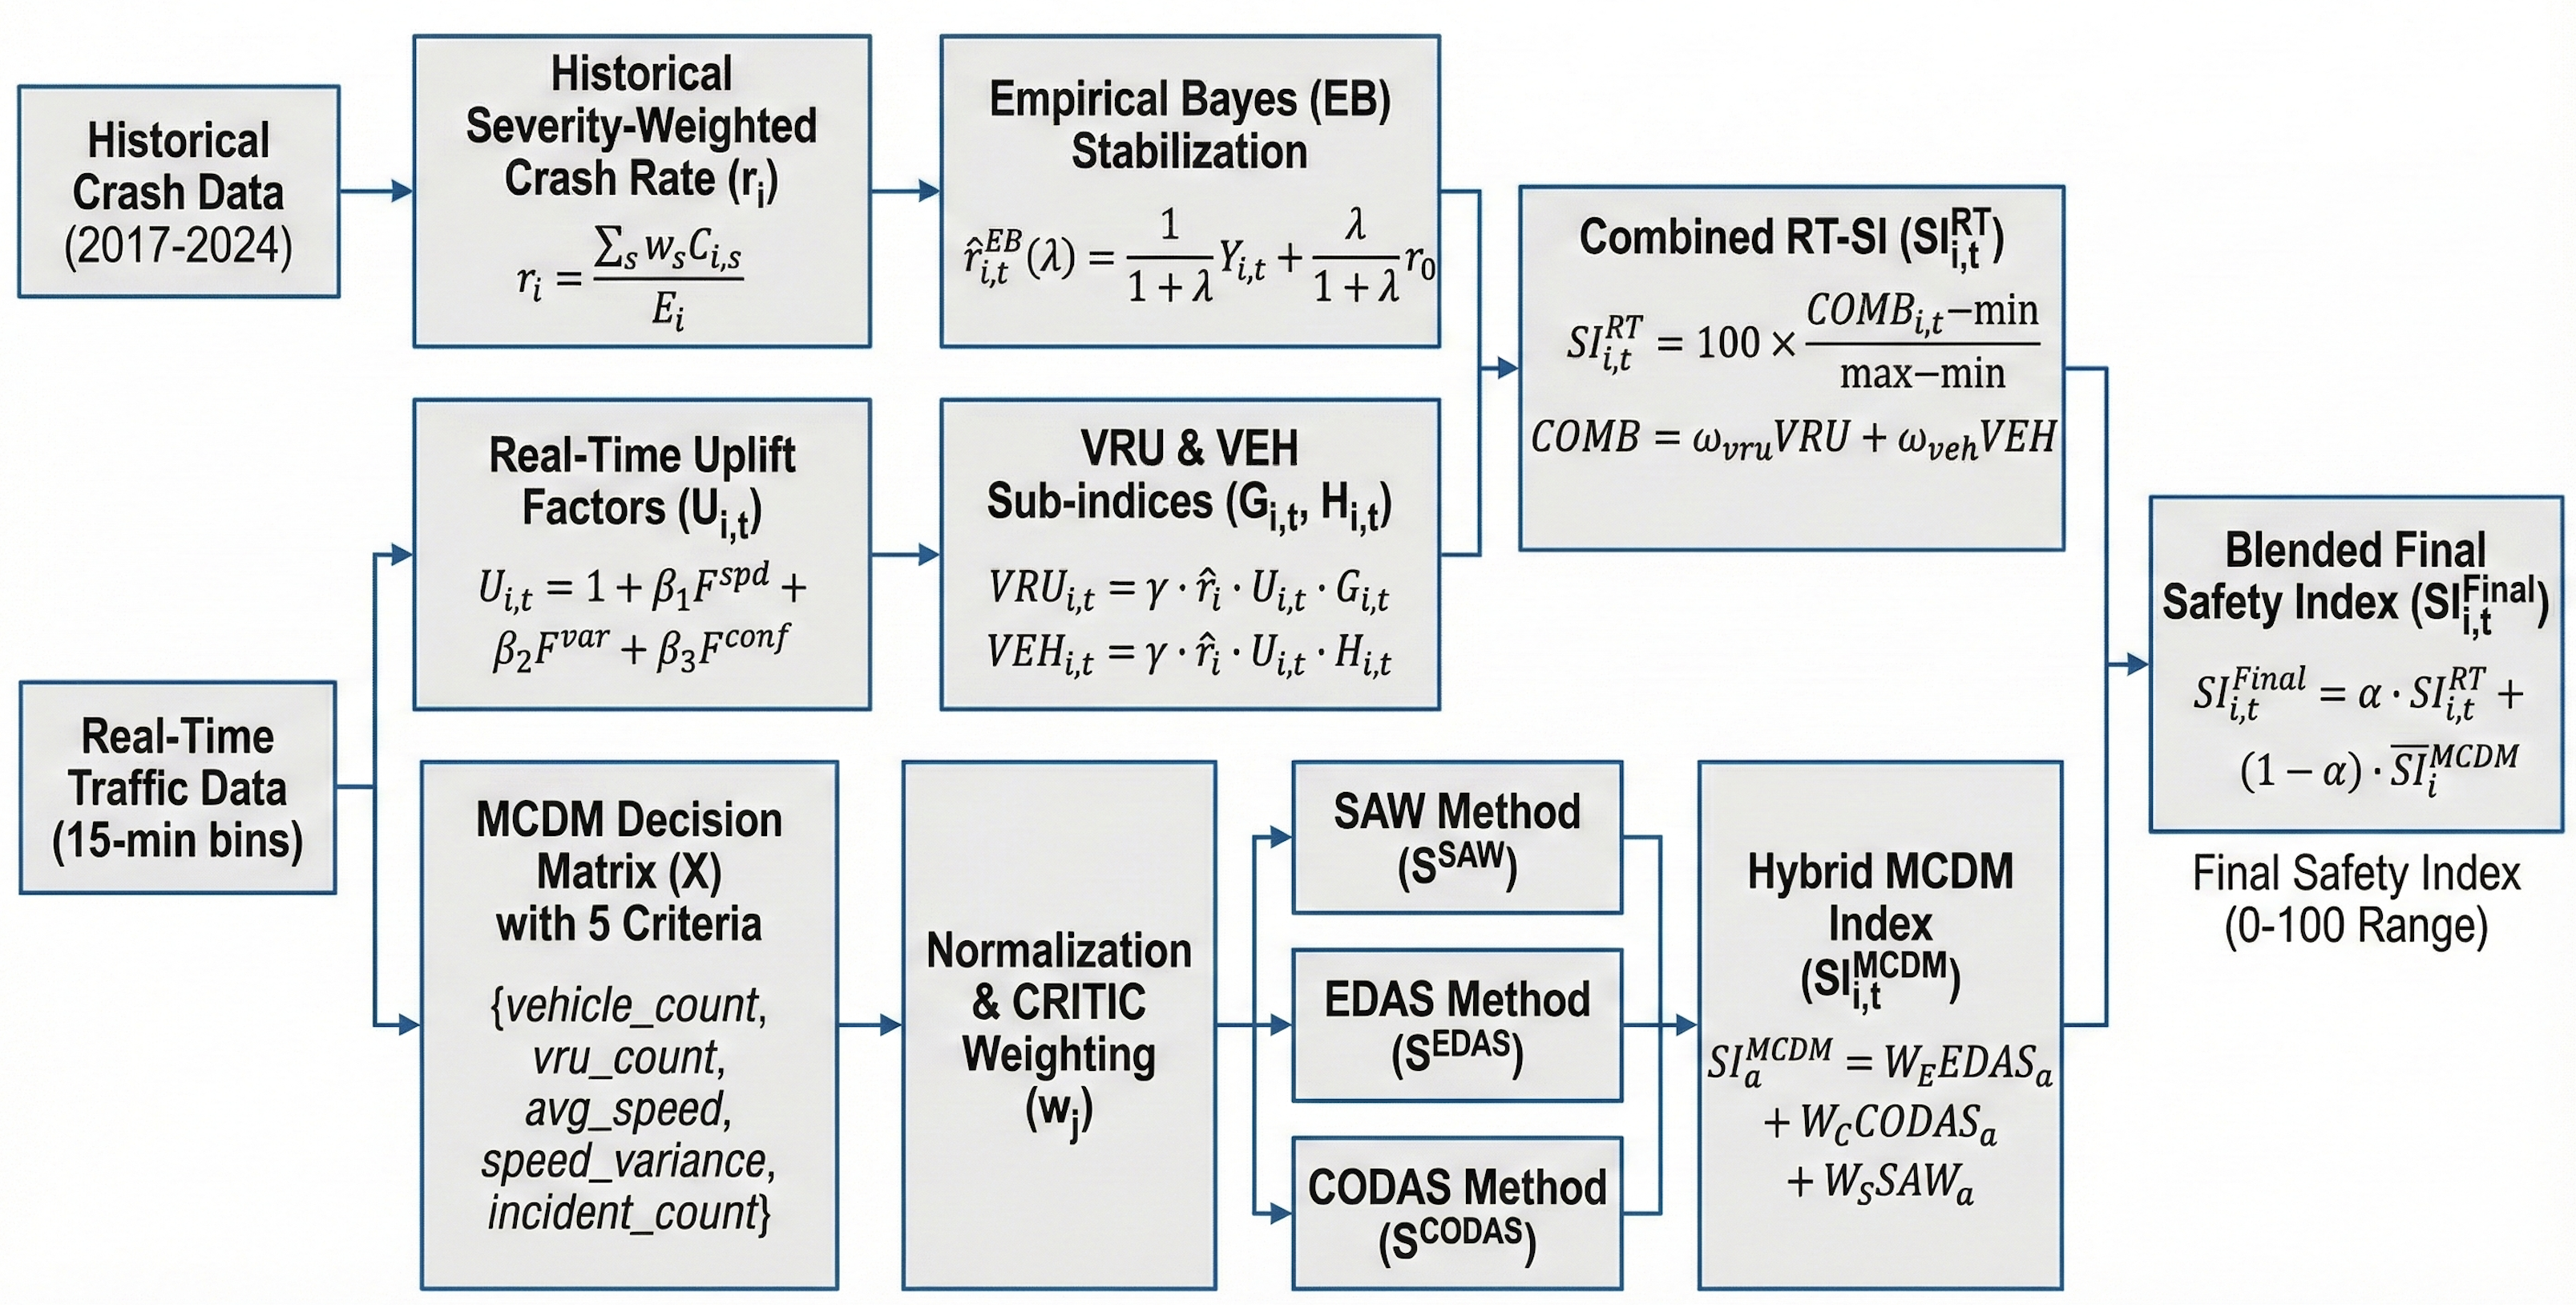
Figure 1: VTTSI methodology overview—parallel computation pipelines (RT–SI, Hybrid MCDM), followed by blending into the final Safety Index.
RT–SI Pipeline
Historical crash rates are exposure- and severity-weighted, EB-stabilized (optimal λ⋆ determined via temporal cross-validation), and then uplifted by bounded operational factors. Sub-indices for VRU and vehicle are blended by fixed policy-driven weights:
- Real-time uplift factors: bounded magnifiers for speed drop, speed variance, and VRU–vehicle conflicts.
- Final scaling: normalized to 0–100, with higher indicating elevated risk.
MCDM Pipeline
A decision matrix aggregates five operational criteria per intersection–time bin:
- Vehicle count
- VRU count
- Average speed
- Speed variance
- Incident (conflict/event) count
CRITIC weights minimize redundancy and maximize informativeness. SAW, EDAS, and CODAS scores are calculated and aggregated with method-level CRITIC weights to form the hybrid operational index. Scores are scaled identically (0–100) for compatibility.
Blending
The final Safety Index is computed as:
SIi,tFinal=α⋅SIi,tRT+(1−α)⋅SIiMCDM
where α is adjustable for operational deployment (driver-facing, agency monitoring, etc.).
Cloud-Native System and Data Integration
VTTSI is deployed via a modular client–server architecture comprising cloud-hosted FastAPI backend, Streamlit frontend, and PostgreSQL/PostGIS database. Real-time tables ingest connected-vehicle telemetry (BSM, PSM), vehicle and VRU counts, speed distributions, and safety-event detections, aligned in 15-minute bins. Historical crash data (VDOT, 2017–2024) is spatially joined for intersection-level EB modeling.
Operational workflow: user dashboards query blended safety indices, parameterized by α, visualizing risk maps and score time-series. REST endpoints deliver structured JSON, enabling scalable, interactive analytics.
Validation and Analysis
Temporal Dynamics
The indices exhibit consistent diurnal structure, modulated primarily by exposure variables (vehicle/VRU count), perturbed in periods of speed turbulence or incident spikes. Sites with zero historical crashes (e.g., Glebe–Potomac) display low RT–SI baselines, confirming EB stabilization, and respond to uplift only when operational turbulence is present.
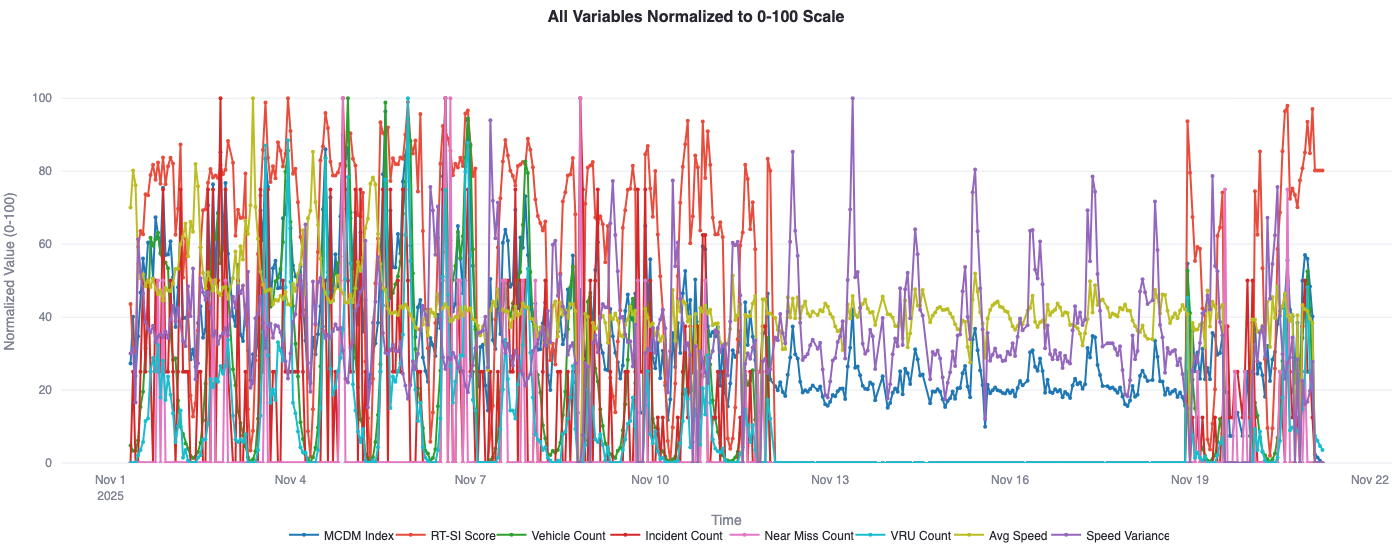
Figure 2: Normalized trend analysis at Glebe–Potomac; diurnal peaks in exposure dominate risk signals.
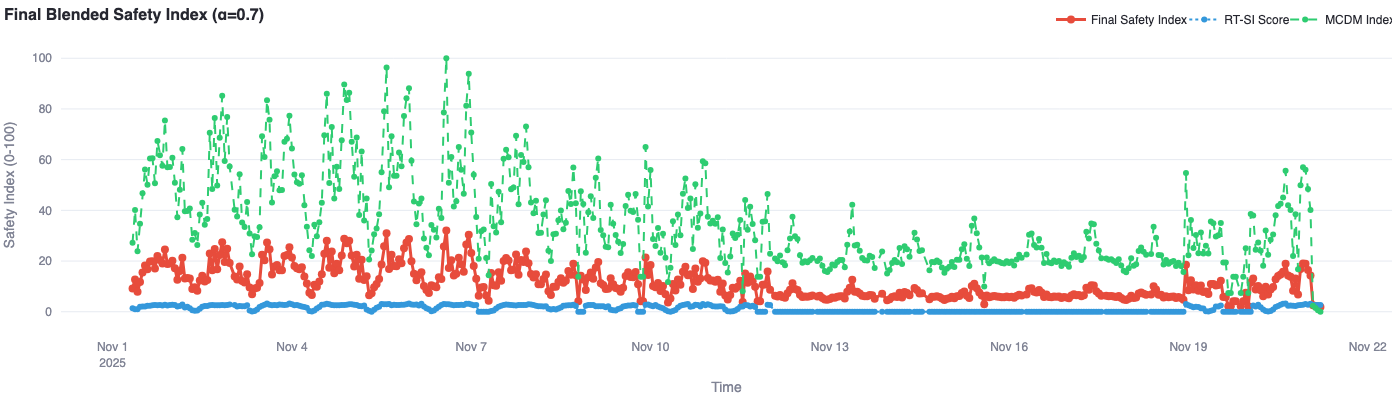
Figure 3: Final blended Safety Index at Glebe–Potomac, integrating RT–SI and MCDM signals.
Correlation and Consistency
SAW, EDAS, CODAS methods are highly correlated post-CRITIC weighting, confirming consistent operational-risk ordering. Operational features (exposure, speed variance, event counts) are tightly linked to MCDM scores.
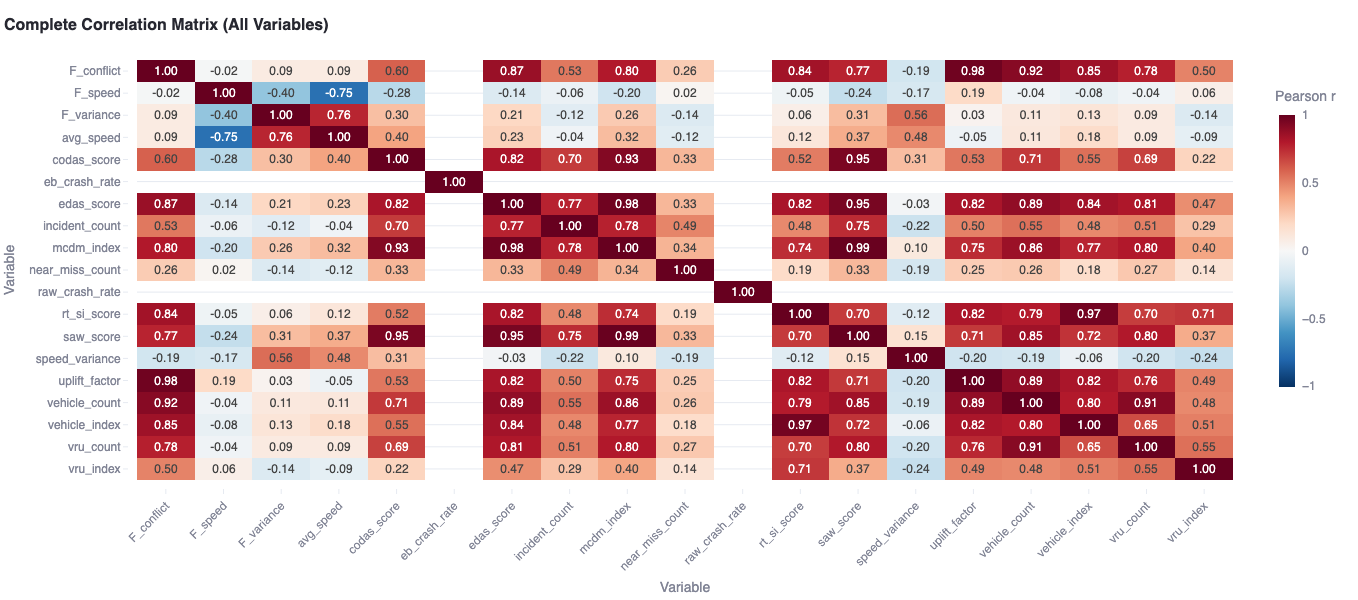
Figure 4: Pearson correlation matrix showing strong association between exposure variables and safety scores.
Robustness and Sensitivity
Joint ±25% perturbations of RT–SI parameters yielded deviations below 1 point (on 0–100 scale) for crash-free intersections; index structure is preserved (dominance of blending weights, bounded influence of uplift coefficients). EB parameters are minimally influential at low-crash sites.
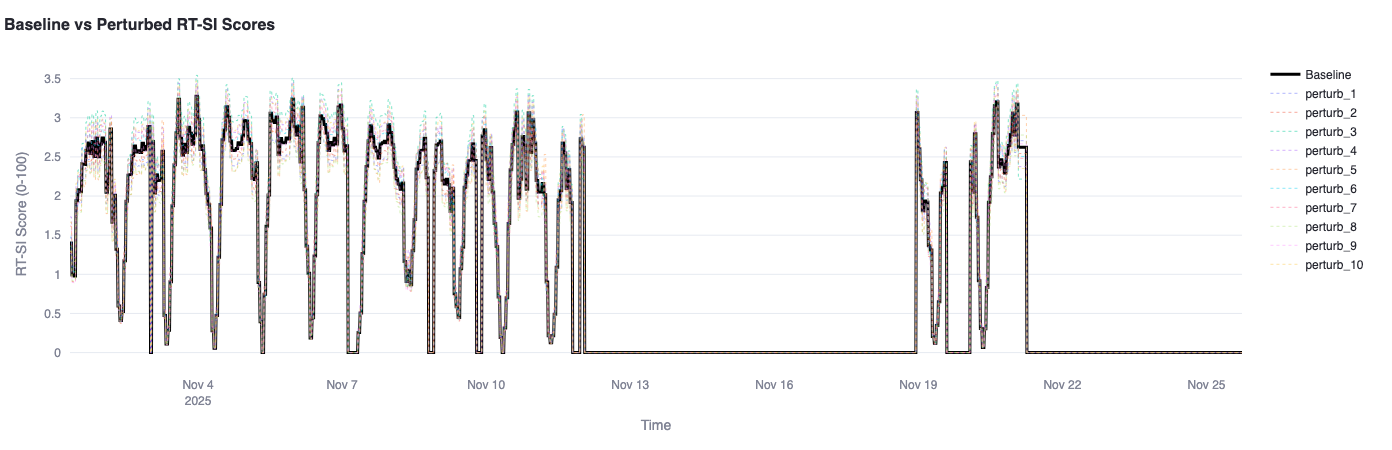
Figure 5: RT–SI trajectory comparison under parameter perturbations—trend is preserved.
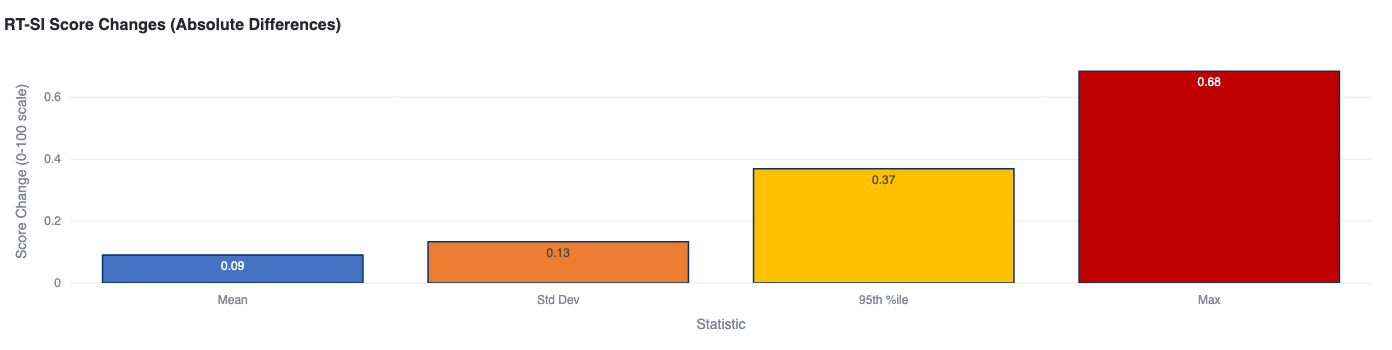
Figure 6: Distribution of absolute deviations between baseline and perturbed RT–SI; deviations are minimal.
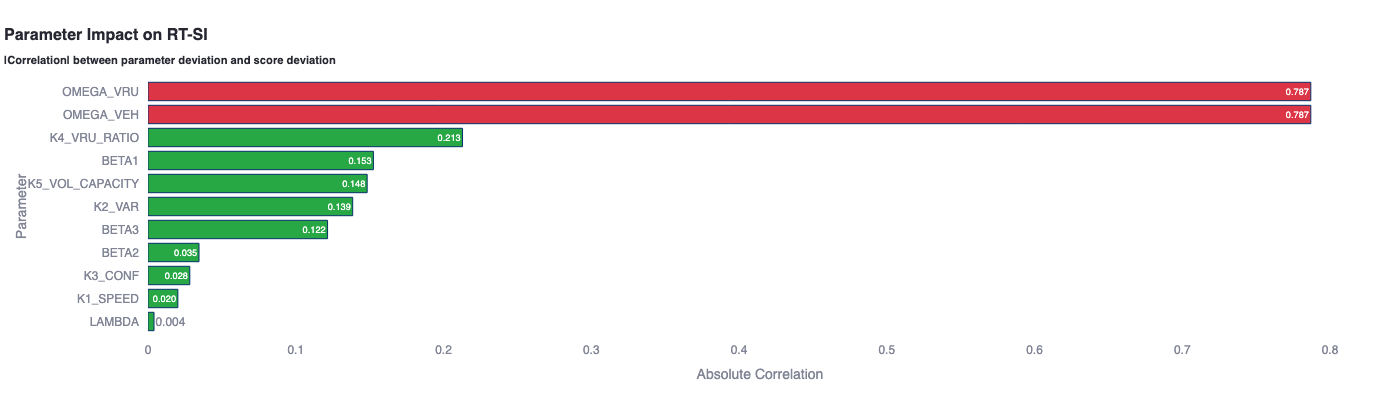
Figure 7: Weight-correlation analysis—VRU vs. vehicle blend parameters dominate RT–SI sensitivity.
Results and Implications
VTTSI delivers:
- Real-time, exposure-adjusted intersection safety quantification.
- Robustness to sensor dropout and parameter uncertainty.
- Interpretable operational insights—volume, speed variance, VRU presence are principal short-term risk predictors.
- Blended indices capture complementary views: RT–SI is anchored to historic risk; MCDM rapidly signals anomaly via operational metrics.
The system is suitable for agency dashboards, TMC operations, CAV system integration, and risk-aware navigation. The modular architecture supports extension to statewide deployments and integration with real-time fleet data.
Limitations and Research Trajectory
Current VTTSI architecture relies on tabular numeric representations, omitting relational geometry, multimodal trajectory context, and causal topology. VRU under-penetration and intermittent telemetry impair multimodal risk identification. Future enhancement will employ Traffic Safety Knowledge Graph (TS–KG) structures for semantic richness, causal inference, and agentic reasoning, as well as policy-aware equity calibration.
Conclusion
The VTTSI represents a rigorously validated, cloud-native hybrid model for intersection safety assessment, unifying multi-year crash data and real-time connected-vehicle telemetry through EB, uplift, and hybrid MCDM computation. The index is numerically robust, interpretable, and operationally responsive; it delivers actionable safety intelligence suitable for deployment by transportation agencies and adaptive vehicle systems. Future advancements will focus on semantic, relational, and agentic model architectures for deeper causal and contextual safety reasoning.

