Percolation and clustering in ecological communities: A dynamical theory
Abstract: Ecological communities with structured interactions exhibit collective phenomena such as percolation and clustering of occupied sites. While these effects have been documented in experiments and simulations, systematic analytical understanding has remained limited. In this paper, we develop a dynamical theory of these phenomena for competitive ecological systems defined on random interaction graphs. We introduce a discrete version of the generalized Lotka-Volterra model that preserves key macroscopic features of continuous ecological dynamics while enabling analytical treatment. Within this framework, we characterize the emergence of percolating clusters and describe the spatial organization of surviving sites. Our analysis uncovers which equilibria can be reached by the dynamics and shows how this dynamical accessibility governs the onset of clustering and percolation. In doing so, our framework complements classical Lotka-Volterra theory by providing a dynamical perspective on the collective organization of structured communities.
Paper Prompts
Sign up for free to create and run prompts on this paper using GPT-5.
Top Community Prompts
Explain it Like I'm 14
Percolation and clustering in ecological communities: a simple explanation
What is this paper about?
This paper asks a big question: how do simple, local interactions between nearby patches of life (like grass, shrubs, or microbes) create large-scale patterns across a landscape? The authors build a simple, step-by-step model of how patches compete with their neighbors and then use new math tools to predict when the living patches will:
- cover everything,
- connect into one giant “web” that spans the whole area, or
- break apart into many small, isolated islands.
These large-scale changes are called percolation (one giant connected cluster) and clustering (many separate patches).
What questions are the authors trying to answer?
In plain terms, they want to know:
- When do some locations become empty (no biomass) because of competition?
- When do the remaining living locations still connect into one large, path-like network (percolation), and when do they fragment into small, isolated patches?
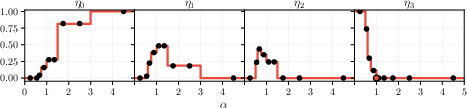
- What shapes do the surviving patches take (for example, long chains vs. more bushy shapes)?
- Which final states are actually reached from random starting conditions, and which exist only if you carefully prepare the system?
- Can a fully covered ecosystem still be possible even when typical conditions lead to empty spots?
How did they study this? (Methods in everyday language)
The authors use a simple model inspired by a classic ecological idea (the generalized Lotka–Volterra model), but they make it “discrete” and step-by-step to make it easier to analyze.
- Think of the landscape as a network (like a map of towns connected by roads). Each “site” (town) holds some biomass (like the amount of vegetation).
- Time moves in steps (like days). At each step, each site’s biomass goes up, stays the same, or goes down by one unit, depending on a simple rule: it grows if there’s room (carrying capacity), but it’s held back by its own size and by competition from neighbors. A single parameter, α (alpha), controls how strongly neighbors compete.
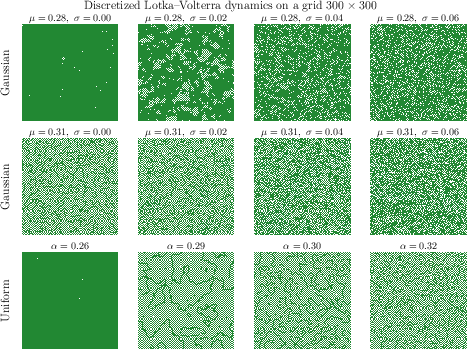
- They mostly study random networks where every site has the same number of neighbors (called d-regular graphs). They also check that similar behavior shows up on grids (like a map with squares).
- To analyze the model without running huge simulations, they use “message passing” methods:
- Backtracking Dynamical Cavity Method (BDCM): Imagine each site asking its neighbors, “What will you do?” and neighbors answering back. By passing these “messages” across the network, you can figure out the typical long-term behavior without simulating every possible starting point.
- A new percolation calculation: They extend message passing to handle the fact that which edges/sites are “active” (occupied) are not independent but are shaped by the dynamics itself. This lets them compute the size of the largest connected cluster (percolation) even when there are complex correlations.
Two helpful ideas:
- Attractor: a stable long-term pattern the system settles into. The model often settles into a simple 2-step cycle (it flips back and forth between two states).
- Entropy (here): a count of how many starting setups lead to a given kind of outcome. High entropy means many starts lead there; low means you need special starting conditions.
What did they find, and why is it important?
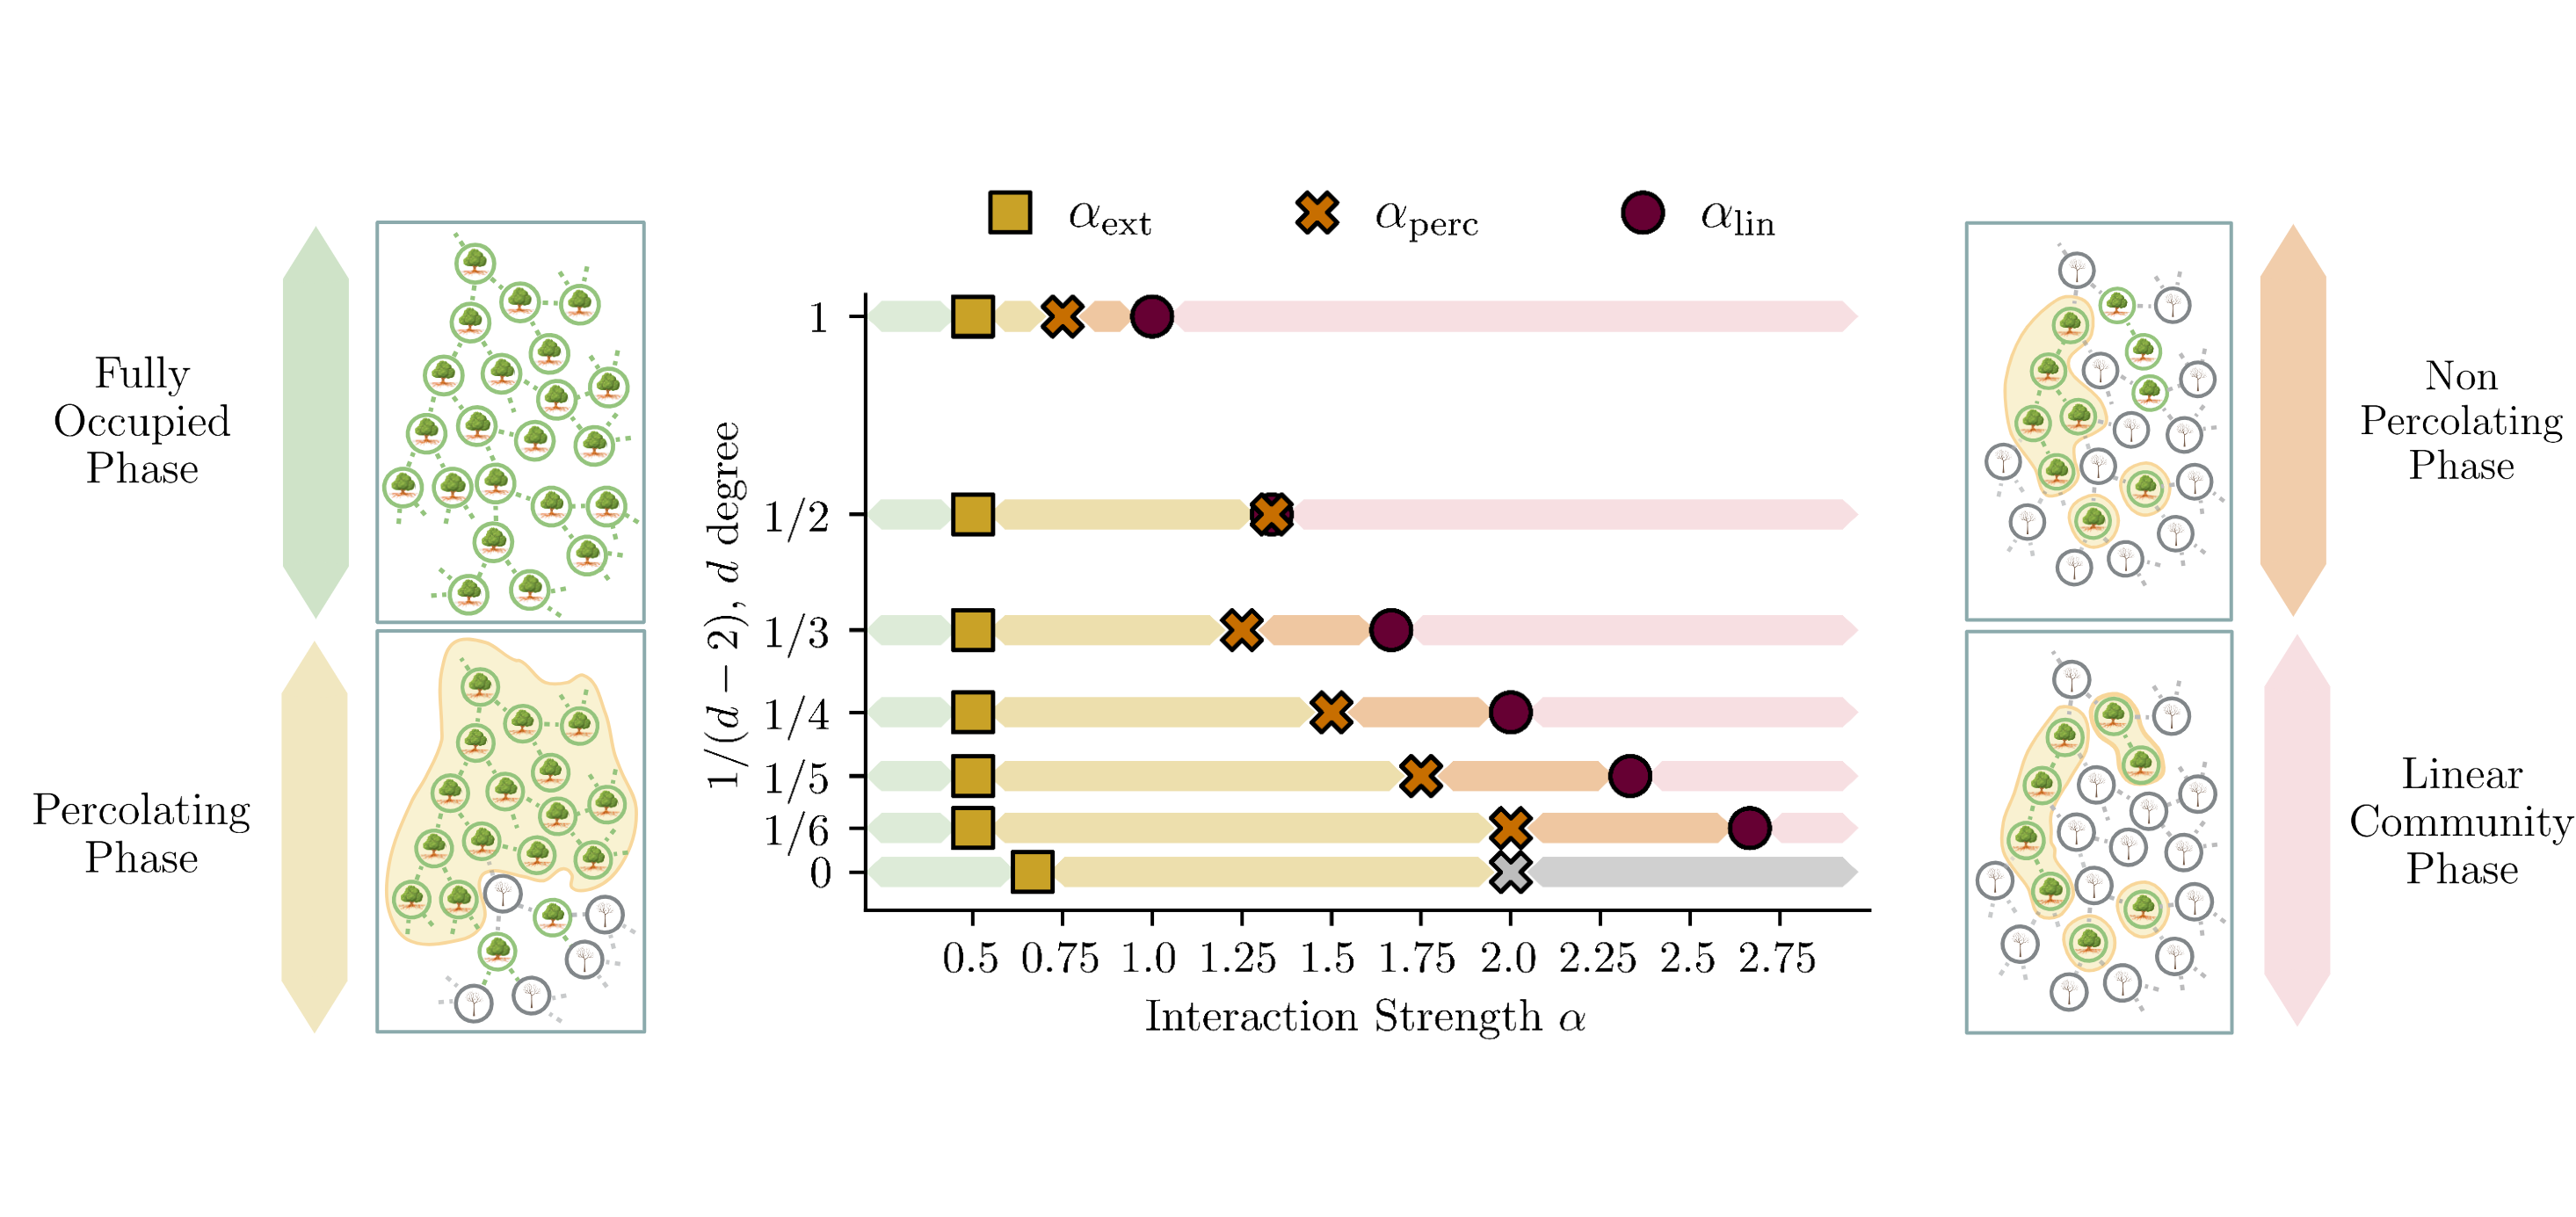
They map out a “phase diagram” describing four main regimes as competition strength α increases (for fixed neighbor count d):
- Fully occupied phase (low competition): Almost every site stays alive (no big empty patches).
- Percolating phase (medium competition): Some sites go empty, but the remaining living sites still connect into one giant cluster that spans the area (you can “travel” through living sites across the landscape).
- Non-percolating phase (higher competition): Living sites break into many small, isolated clusters (no giant connected region).
- Linear community phase (even higher competition): Surviving clusters become chain-like (think of narrow strings rather than blobs).
Key details and insights:
- There are clear thresholds:
- α_ext: the point where empty sites first appear.
- α_perc: the point where the living network stops spanning the whole system (percolation is lost).
- α_lin: the point where surviving clusters become chain-like.
- The percolation threshold α_perc grows with d (more neighbors make it easier to stay connected).
- For modest neighbor counts (like d between 3 and 8), the extinction threshold α_ext looks roughly constant, but for very high d it changes—so the “constant” behavior doesn’t hold forever.
- Typical final states are 2-cycles: the system usually flips between two similar patterns rather than freezing to a single fixed picture.
- Fast convergence: From random starts, the system settles into its long-term behavior quickly, and the theory matches large-scale simulations very well.
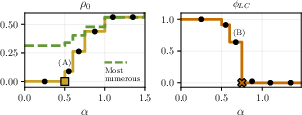
- Most numerous ≠ most likely: The attractors that exist in the largest number aren’t the ones you typically end up in from random beginnings. What matters for nature is where you actually land from natural starting conditions.
- Hope for restoration: Even beyond the point where random starts produce empty sites, there still exist carefully prepared starting patterns that lead to fully covered ecosystems. That means smart “seeding” or restoration plans could tip a fragmented system back into a healthier, connected state.
Why it matters:
- Ecology: This gives a clear, mathematical explanation for how local competition can create large-scale patterns like patchiness and connectivity loss—patterns seen in drylands under increasing grazing or lower rainfall.
- Early warning: Knowing where the percolation threshold sits helps identify when a landscape is close to fragmenting.
- Restoration: The existence of “hidden” fully occupied outcomes suggests targeted interventions (like where and how to replant) can matter a lot.
What could this change or inspire?
- Practical ecology: Helps link simple, local rules (competition strength, neighbor effects) to big-picture outcomes (connected vs. fragmented habitats), guiding monitoring and restoration.
- Beyond ecology: The new percolation method works for any system where the network structure depends on dynamics—like opinion spread, social influence, or epidemics—because it can handle correlations that standard percolation models ignore.
- Research tools: Provides an analytical (not just simulation-based) way to predict connectivity in complex, interacting systems.
Takeaway
With a simple, step-by-step model and powerful message-passing math, the paper shows exactly how local competition can make ecosystems stay fully covered, form one big connected web, or break into isolated patches—and how smart starting conditions might help repair fragmented landscapes.
Knowledge Gaps
Knowledge gaps, limitations, and open questions
The paper proposes a dynamical theory for percolation and clustering in a discrete gLV model on random regular graphs and develops a message-passing framework for dynamics-induced percolation. While it advances analytical understanding, several issues remain unresolved:
- Analytical scope limited to locally tree-like networks
- No analytical treatment for finite-dimensional lattices or graphs with many short loops; robustness is only shown numerically. Can the BDCM and percolation framework be extended or corrected for loopy topologies?
- Reliance on the replica-symmetric (RS) assumption
- Validity of RS is not established; potential replica-symmetry breaking near thresholds is not assessed. How would RSB affect predicted thresholds, cluster structure, or percolation?
- Synchronous, deterministic updates as a core assumption
- Realistic ecological models often use asynchronous and/or stochastic updates. How robust are phase boundaries and dominant-attractor properties to update schedules and stochasticity?
- Interaction structure restricted to uniform, competitive couplings
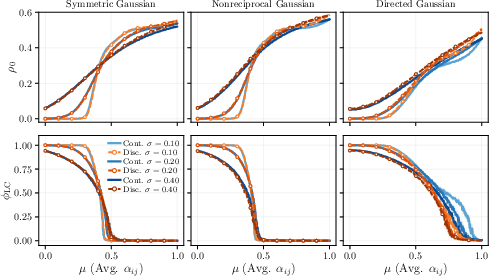
- Analytical results assume α_ij = α/d on d-regular graphs. How do thresholds and clustering change with heterogeneous degree distributions (e.g., Poisson, power-law), spatially embedded networks, or heterogeneous/structured α_ij?
- Positive (facilitative) interactions and mixed-sign interaction matrices—common in dryland vegetation—are not treated. Do facilitation or mixed interactions induce qualitatively new phases or change percolation universality?
- Limited exploration of the discretization parameter K
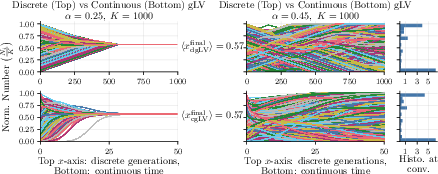
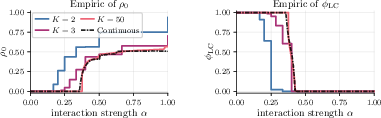
- Most analytical and numerical results focus on K=2 (with some K=3). There is no systematic analysis of how thresholds, dominant cycle structure, and entropy convergence scale with K, or rigorous connection to the continuous-time gLV in the K→∞ limit.
- Percolation characterization is threshold-centric
- Critical exponents, cluster size distributions, and universality class of the percolation transition are not computed. Are the percolation transitions mean-field, or do dynamics-induced correlations alter critical behavior?
- Finite-size effects and convergence rates
- Results are framed in the thermodynamic limit with S≈104 simulations. Finite-size scaling of α_ext, α_perc, and α_lin, and critical slowing down near transitions are not quantified.
- Transient phenomena not systematically analyzed
- Although the framework tracks short transients (small p), it does not quantify time-to-percolation, transient clustering, or transient extinction patterns. How do transient percolation and cluster lifetimes depend on α, d, and K?
- Subdominant (atypical) fully occupied attractors
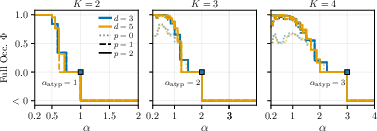
- The paper indicates existence of fully occupied subdominant attractors beyond α_ext but does not fully characterize:
- The threshold α_atyp across d, K (beyond partial results), or its dependence on topology/heterogeneity.
- Basin geometry/size for these attractors as α varies.
- Constructive strategies to reach them (e.g., minimal seeding sets, targeted interventions), relevant for restoration ecology.
- Lack of closed-form thresholds
- Most thresholds (α_ext, α_perc, α_lin) are obtained numerically via BDCM. Can tight analytical bounds or asymptotic expressions in d, K be derived beyond the large-d limit?
- Uniqueness of the giant component assumed
- The percolation calculation assumes a unique largest component; conditions ensuring uniqueness under dynamics-induced correlations are not provided, especially on non-tree-like graphs.
- Sensitivity to initial conditions and absorbing states
- Initializations exclude empty sites to avoid topology changes via absorbing states. How do initial vacancies, clustered seeding, or spatial gradients in initial biomass affect long-term percolation and clustering?
- Environmental and demographic stochasticity omitted
- Robustness of thresholds and clustering to noise in growth rates, carrying capacities, or temporally fluctuating α(t) is not explored.
- Spatially heterogeneous carrying capacities and multi-species occupancy
- The model assumes a single biomass variable N_i with uniform K. How do heterogeneous K_i or multiple species per site (with local interspecific interactions) alter percolation and cluster morphology?
- Directionality and asymmetry of interactions
- Asymmetric or directed interactions (e.g., prevailing wind-driven dispersal, slope effects) are not analyzed. How do directed graphs or non-reciprocal α_ij affect accessibility of attractors and percolation thresholds?
- Mechanistic explanation for α_lin vs α_perc relationships
- In some cases α_lin coincides with α_perc; the underlying mechanism (e.g., local constraints on degrees of occupied nodes) is not analytically explained. Can one predict when and why clusters become linear precisely at fragmentation?
- Generality and validation of the dynamics-induced percolation framework
- The new percolation method is proposed as broadly applicable, but no benchmark on other dynamics (e.g., SIR, voter models) is provided. What are the method’s limitations when correlations are strong or RS breaks?
- Parameter-to-environment mapping and empirical validation
- While α is linked to environmental drivers (e.g., grazing, rainfall) conceptually, the paper does not address parameter inference from data or validate predictions (e.g., α_perc) against field measurements.
- Computational limitations of BDCM for larger p and K
- Complexity grows as O(d K{p+c}), restricting p≤4 and small K. Are there algorithmic accelerations (e.g., coarse-graining, low-rank messages) or rigorous arguments ensuring small-p sufficiency near critical points?
- Possible connections to graph optimization at large α
- At very large α, attractors approach independent sets. The relationship between dominant attractors and maximum (or typical) independent sets is not analyzed; could complexity-theoretic insights bound α_lin or guide predictions?
Practical Applications
Immediate Applications
The paper introduces a discrete generalized Lotka–Volterra (gLV) model and a message-passing framework (BDCM) to analytically predict extinction, clustering, and percolation in interacting systems on sparse graphs. These tools can be deployed now in several settings, especially where interaction structures and pressure variables can be estimated.
- Ecological restoration and conservation planning
- Use case: Estimate critical grazing/water-extraction thresholds that preserve landscape connectivity; identify when vegetation patches percolate versus fragment; design seeding/reintroduction strategies that steer systems into “fully occupied” attractors even beyond typical extinction thresholds.
- Sector(s): Environment/ecology; public policy; land management.
- Potential tools/products/workflows:
- A GIS plug-in that ingests landscape topology and drivers (e.g., grazing, rainfall), runs BDCM to compute α_ext, α_perc, α_lin, and outputs percolation maps and corridor recommendations.
- Scenario planning workflow: calibrate α_ij from environmental data → run BDCM (p≈3–4) → compute extinction and percolation thresholds → recommend stocking rates, water policies, and spatial seeding layouts.
- Assumptions/dependencies: Locally tree-like approximations or use on lattices with empirically validated robustness; interaction strengths or proxies (e.g., from consumer–resource mapping) available; synchronous-update approximation; large-system behavior approximates the managed area.
- Rangeland and dryland management
- Use case: Set stocking densities and rotational grazing schedules to remain below α_ext and α_perc, preventing fragmentation and desertification.
- Sector(s): Agriculture; environment/policy.
- Potential tools/products: Decision-support dashboards that track proximity to critical thresholds and prescribe adaptive stocking.
- Assumptions/dependencies: Parameter calibration (α vs. grazing/rainfall) from local data; spatial graph representation of sites.
- Microbial consortia design and bioprocess control
- Use case: Tune nutrient supply/interaction strengths and inoculation patterns to maintain desired community connectivity and avoid collapse or unwanted isolations in bioreactors or soil amendments.
- Sector(s): Biotechnology; biomanufacturing; agriculture (soil microbiome).
- Potential tools/products: Process-control modules that map media composition to effective α_ij and predict percolation of functional taxa.
- Assumptions/dependencies: Estimation of α_ij from consumer–resource relations; synchronous deterministic approximation acceptable for design screening.
- Epidemic and information-spread modeling with dependent percolation
- Use case: Incorporate dynamics-dependent (correlated) edge activation into outbreak size predictions or online information cascades; improve giant-component estimates beyond independent percolation assumptions.
- Sector(s): Public health; social media analytics.
- Potential tools/products: A message-passing module that plugs into existing network epidemiology/information diffusion simulators to estimate percolation in the presence of correlations.
- Assumptions/dependencies: Contact or interaction networks available; mapping from disease or content dynamics to local update rules that fit the factor-graph representation.
- Network resilience prototyping (telecom, IT systems)
- Use case: Assess fragmentation risk under dynamics-dependent failures (e.g., correlated overloads); identify thresholds where the network loses a giant component.
- Sector(s): Software/IT; network operations.
- Potential tools/products: Prototype libraries using the recursion for dynamics-dependent percolation to stress-test network designs.
- Assumptions/dependencies: System-specific mapping of load/attack dynamics to local update rules; sparse, locally tree-like topology or validated approximation.
- Academic research and teaching
- Use case: Analyze clustering and percolation in cellular automata, opinion dynamics, and ecology with correlated edge occupations; teach coupled dynamics–percolation concepts.
- Sector(s): Academia/education.
- Potential tools/products: Open-source Python/R implementations of BDCM for small p (e.g., p≤4) and the percolation recursion; interactive notebooks and classroom modules.
- Assumptions/dependencies: Adoption of the replica-symmetric (RS) solution; validation on specific models where RS holds.
Long-Term Applications
These applications require further data, scaling, or integration work (e.g., parameter estimation pipelines, validation on non-tree-like topologies, engineering integrations).
- Operational ecological digital twins
- Use case: Real-time monitoring and control of fragmentation risk in landscapes (forests, rangelands), with automated policy recommendations (e.g., dynamic grazing limits, targeted irrigation).
- Sector(s): Environment; government; climate adaptation.
- Potential tools/products: Cloud-based digital twins with sensor/data assimilation, BDCM backends, and policy optimization loops.
- Assumptions/dependencies: Continuous calibration of α_ij from remote sensing and in situ measurements; robust handling of spatial loops and heterogeneity.
- Autonomous/precision restoration
- Use case: Drone- or robot-assisted seeding/reintroduction that leverages the “subdominant fully occupied attractors” insight to push systems into desirable states via coordinated initial-condition design.
- Sector(s): Robotics; conservation technology.
- Potential tools/products: Mission planners that compute minimal intervention sets (who/where to seed) to switch basins of attraction.
- Assumptions/dependencies: Reliable mapping from actions to effective initial conditions; robust predictions under environmental stochasticity.
- Urban green infrastructure and biodiversity corridors
- Use case: Design and maintenance of urban green networks to preserve percolation of habitat patches and ecosystem services.
- Sector(s): Urban planning; civil infrastructure.
- Potential tools/products: Planning tools integrating road networks, parcels, and green spaces into the percolation analysis with policy constraints.
- Assumptions/dependencies: High-resolution spatial graphs and interaction proxies; stakeholder constraint modeling.
- Public health nowcasting with correlated contact dynamics
- Use case: Replace independence assumptions in percolation-based outbreak thresholds with dynamics-dependent message passing in real-time surveillance.
- Sector(s): Public health.
- Potential tools/products: Integrated dashboards that fuse mobility, contact data, and behavioral dynamics into dependent-percolation predictions.
- Assumptions/dependencies: Access to up-to-date contact/mobility data; validated mappings of transmission dynamics to local rules; privacy-preserving data pipelines.
- Swarm robotics and multi-agent systems
- Use case: Guarantee connectivity and avoid fragmentation in swarms by tuning interaction rules and initial deployments; compute fragmentation thresholds with correlated couplings (interference, local failures).
- Sector(s): Robotics; defense; logistics.
- Potential tools/products: Pre-deployment analyzers using dynamics-dependent percolation to certify connectivity under operational constraints.
- Assumptions/dependencies: Accurate interaction models; validation on non-tree-like spatial communication networks.
- Energy and infrastructure resilience
- Use case: Model cascading failures with correlated dependencies (e.g., common-mode stresses), identify percolation thresholds for blackout/islanding risks.
- Sector(s): Energy; critical infrastructure.
- Potential tools/products: Planning tools that integrate load-flow simulators with message-passing percolation modules to assess large-component loss risk.
- Assumptions/dependencies: High-fidelity mapping from physical dynamics to factor-graph updates; handling dense topologies and cycles beyond tree-like approximations.
- Financial contagion and supply-chain robustness
- Use case: Analyze correlated default or disruption dynamics and thresholds for systemic fragmentation versus resilience of the giant component.
- Sector(s): Finance; manufacturing/logistics.
- Potential tools/products: Risk analytics platforms augmenting network models with dynamics-dependent percolation estimators for stress testing.
- Assumptions/dependencies: Reliable exposure/interaction data; validated local rules for contagion dynamics; dealing with dense, loopy networks.
Cross-cutting assumptions and dependencies to monitor
- Structural assumptions: Many analytical results assume sparse, locally tree-like graphs; while the authors report qualitative robustness on grids and heterogeneous couplings, formal guarantees on loopy/clustered networks remain an open area.
- Dynamics assumptions: Synchronous updates, discrete-time/biomass discretization (small K), and deterministic dynamics; real systems may be asynchronous, stochastic, and continuous—requiring calibration and robustness checks.
- Replica symmetry (RS): Calculations rely on the RS Ansatz; where RS breaks, predictions may need replica-symmetry-breaking or alternative methods.
- Parameter estimation: Mapping environmental drivers or interventions to α_ij must be constructed (e.g., via consumer–resource models, experiments, or inference).
- Scale and initialization: The theory is asymptotic (S→∞) and characterizes dominant vs. subdominant attractors; interventions that exploit subdominant basins require spatially coordinated initializations and may be sensitive to noise.
- Data integration: For operational use, workflows must integrate GIS data, remote sensing, contact/mobility networks, or operational telemetry to instantiate the model.
These applications leverage two core contributions of the paper: (1) a discrete, analytically tractable gLV framework that predicts extinction and clustering thresholds in structured communities, and (2) a general, dynamics-dependent percolation method that handles correlated edge occupations—both applicable well beyond ecology to any interacting dynamical system on a network.
Glossary
- attractor (dynamical attractor): A recurring long-time behavior (fixed point or periodic cycle) that the system’s dynamics converges to. "A dynamical attractor of length (or -cycle) of the dynamics in Eq.~\eqref{discrete_glv} is a periodic sequence of system states"
- backtracking attractor ((p/c)-backtracking attractor): A trajectory that, after a transient of p steps, enters a periodic cycle of length c and is used to count basins of attraction analytically. "we define -backtracking attractors as dynamical trajectories of total length that, after a transient of steps, enter a cycle of length ."
- backtracking dynamical cavity method (BDCM): A message-passing framework tailored to analyze dynamics on sparse, locally tree-like graphs, enabling tractable computation of attractor properties. "We first deploy the backtracking dynamical cavity method (BDCM) introduced in \cite{BDCM,CellAuto}"
- basin of attraction: The set of initial conditions that converge to a given attractor under the system’s dynamics. "We call the basin of attraction of a dynamical attractor the set of initial conditions that converge"
- Belief Propagation (BP): An iterative message-passing algorithm on graphical models used here to compute approximate entropy and observable averages for dynamics on sparse graphs. "we can bypass this difficulty by using Belief Propagation (in the BDCM form \cite{CellAuto,BDCM, InfoPhysComp})"
- Bethe approximation: A mean-field-like approximation (exact on trees) for the free entropy and marginals of graphical models. "to compute the Bethe approximation of and the averages of local observables."
- bond percolation: A percolation model where edges are randomly present/absent independently; used as a reference for their generalized percolation analysis. "we generalize the approach in~\cite{PercolationBP}, developed to study bond percolation."
- carrying capacity: The maximum sustainable biomass at a site given the local environment and interactions. " represents the carrying capacity, i.e., the maximal biomass that a site can sustain at long times."
- discrete gLV model: A discrete-time, integer-valued version of the generalized Lotka–Volterra model preserving key ecological features while enabling analysis. "We introduce a discrete version of the generalized Lotka–Volterra model that preserves key macroscopic features of continuous ecological dynamics while enabling analytical treatment."
- dynamics-dependent percolation: Percolation where the presence of edges/nodes in the effective network depends on correlated outcomes of an underlying dynamics. "Theory of dynamics-dependent percolation"
- edge-occupation probability: The probability that an edge effectively connects occupied sites; here these probabilities are correlated by the dynamics. "non-independent edge-occupation probability;"
- entropy density: The per-site logarithm of the number of admissible trajectories/initial conditions satisfying given dynamical constraints or attractor properties. "We then introduce the entropy density for the size of the basin of attraction for the -attractor"
- extinction fraction: The fraction of sites with zero biomass at convergence (i.e., vacant or extinct). "The density is also referred to as the extinction fraction"
- factor graph: A bipartite graph representing variable–factor dependencies; used to justify BP on locally tree-like representations of the dynamics. "admits a locally tree-like factor graph representation"
- fixed point: An attractor of period 1 where the system’s state no longer changes over time. "whether the dominant attractors are fixed points or 2-cycles ."
- fully connected limit: The limit where every node connects to all others (degree d→∞), simplifying percolation and extinction thresholds. "The critical extinction threshold in the fully connected limit () is also shown"
- generalized Lotka-Volterra (gLV) model: A canonical model of interacting species or sites with competitive (or other) interactions shaping their growth. "A classic mathematical framework for describing ecological competition is the generalized Lotka-Volterra (gLV) model"
- independent set (fixed point): A configuration where all occupied sites are isolated from each other, forming a fixed point at high competition. "the dominant attractor is a (trivial) independent set fixed point"
- largest connected component (LC): The largest cluster of occupied, mutually connected sites used to detect percolation. "The largest connected component (LC) is then the largest cluster."
- linear community phase: A regime where all occupied clusters are linear chains (no sites with ≥3 occupied neighbors). "for , all the clusters become linear."
- locally tree-like topologies: Sparse graphs with negligible short loops in the large-size limit, making tree-based approximations accurate. "could be applied to general locally tree-like topologies"
- MacArthur consumer–resource model: A mechanistic ecological model from which gLV can be derived in a limit, linking interactions to environmental conditions. "the MacArthur consumerâresource model (see Appendix~\ref{Appendix_CR} or \cite{MacArthur,MacArthurLotkaVolterraCR,Fant})."
- message-passing scheme: An algorithmic framework (e.g., BP/BDCM) propagating local information to compute global properties like percolation on dynamics-induced graphs. "We then extend the BDCM analysis with a message-passing scheme to study percolation and clustering throughout the dynamics"
- non-percolating phase: A regime where all occupied clusters remain sub-extensive (do not span a finite fraction of the system). "then the system is in a non-percolating phase"
- partition function: The total count (or weighted sum) of admissible trajectories/initial conditions satisfying dynamical constraints, used to define entropies. "The partition function counts the number of initial conditions that lead to a -backtracking attractor"
- percolating cluster: A connected set of occupied sites whose size scales linearly with system size (spans the system). "we characterize the emergence of percolating clusters and describe the spatial organization of surviving sites."
- percolating phase: A regime where the largest connected component of occupied sites contains a finite fraction of all sites. "the system contains a non-zero fraction of vacant sites, but is in a percolating phase."
- percolation: The emergence of large-scale connectivity among occupied sites due to local interaction rules. "percolation and clustering of occupied sites."
- percolation transition: The critical change from non-percolating to percolating behavior as a parameter varies. "at which the percolation transition occurs ()"
- phase diagram: A map of qualitative system regimes (phases) as parameters vary, highlighting transitions like extinction and percolation. "Spatial phase diagram of the discrete gLV model"
- probability generating function: A formal power series encoding the distribution of finite cluster sizes, used to compute percolation properties. "We consider the probability generating function defined as "
- random d-regular graph: A graph chosen uniformly among those where every node has exactly d neighbors. "a uniformly sampled random -regular graph"
- replica symmetric Ansatz: An assumption that a single thermodynamic state dominates, enabling BP/Bethe computations without replica symmetry breaking. "under the replica symmetric Ansatz (see Appendix~\ref{BP_theory_appendix})."
- site percolation: A percolation model where nodes are present independently; the authors relate their dependent case to this classical setting. "this equation reduces to ordinary site percolation (see~\cite{Site_percolation})"
- structure function: A statistic giving the fraction of occupied sites with exactly l occupied neighbors, used to characterize cluster shapes. "We define the structure function as the fraction of occupied sites that have exactly occupied neighbors"
- sub-extensive: Scaling slower than linearly in system size; indicates clusters that do not span a macroscopic fraction. "If as , then all clusters are sub-extensive"
- thermodynamic limit: The asymptotic regime of infinitely many sites, where typical behaviors and sharp phase transitions are defined. "in the thermodynamic limit "
Collections
Sign up for free to add this paper to one or more collections.

