- The paper introduces a graph-centric framework that converts memory pipelines into bipartite execution graphs to precisely trace and attribute failures in LLM memory systems.
- The methodology combines hybrid dense-sparse retrieval with iterative subgraph exploration to efficiently localize faulty operations, achieving notable improvements in error type and operation identification accuracy.
- Empirical evaluations on MemTraceBench demonstrate reduced diagnostic costs and improved prompt optimization, highlighting the framework's practical impact on advanced LLM agents.
MemTrace: A Framework for Failure Attribution in LLM Memory Systems
Memory augmentation enables LLMs to transition from stateless task solvers toward advanced agent architectures capable of long-horizon reasoning and continual learning. However, as memory pipelines increase in complexity, their unreliability and diagnostic opacity have become fundamental limitations. Conventional diagnostic approaches—linear execution logs and outcome-oriented benchmarks—fail to recover causal paths of information loss, transformation, and propagation typically responsible for delayed failures. A key unaddressed challenge is identifying—precisely, efficiently, and automatically—the faulty operation(s) that induce errors in non-parametric LLM memory systems (e.g., long-context, RAG, Mem0, EverMemOS), which may manifest long after their actual introduction.
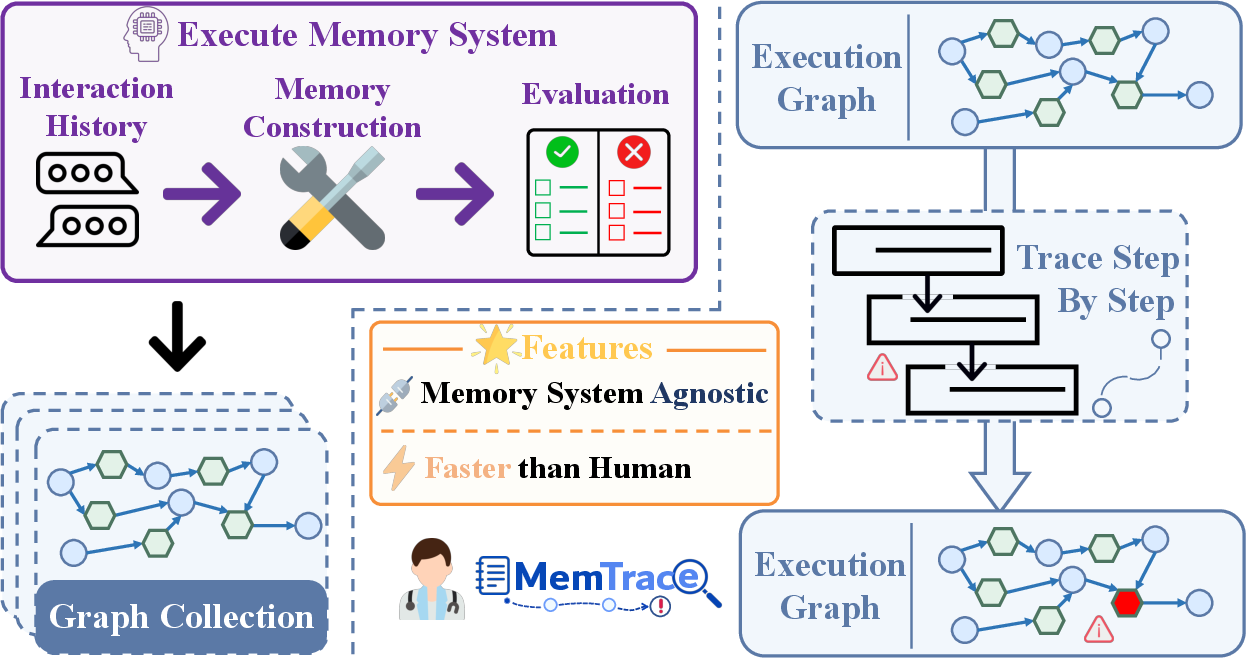
Figure 1: MemTrace diagnostic framework constructs execution graphs and localizes failures via step-wise tracing, generalizable across different memory systems.
MemTrace Methodology: Fine-Grained Attribution via Execution Graphs
MemTrace addresses the traceability gap by instrumenting memory system source code to convert the entire pipeline into a bipartite execution graph: nodes represent variables and operations, edges encode information flow and dependencies. This graph-centric approach exposes the precise causal links between memory construction, update, retrieval, and response. MemTrace formalizes decisive error attribution as discovering a minimal cut-set of faulty operations—those whose correction would suffice to rescue execution—using target-specific tracing, hybrid retrieval, and iterative graph exploration.
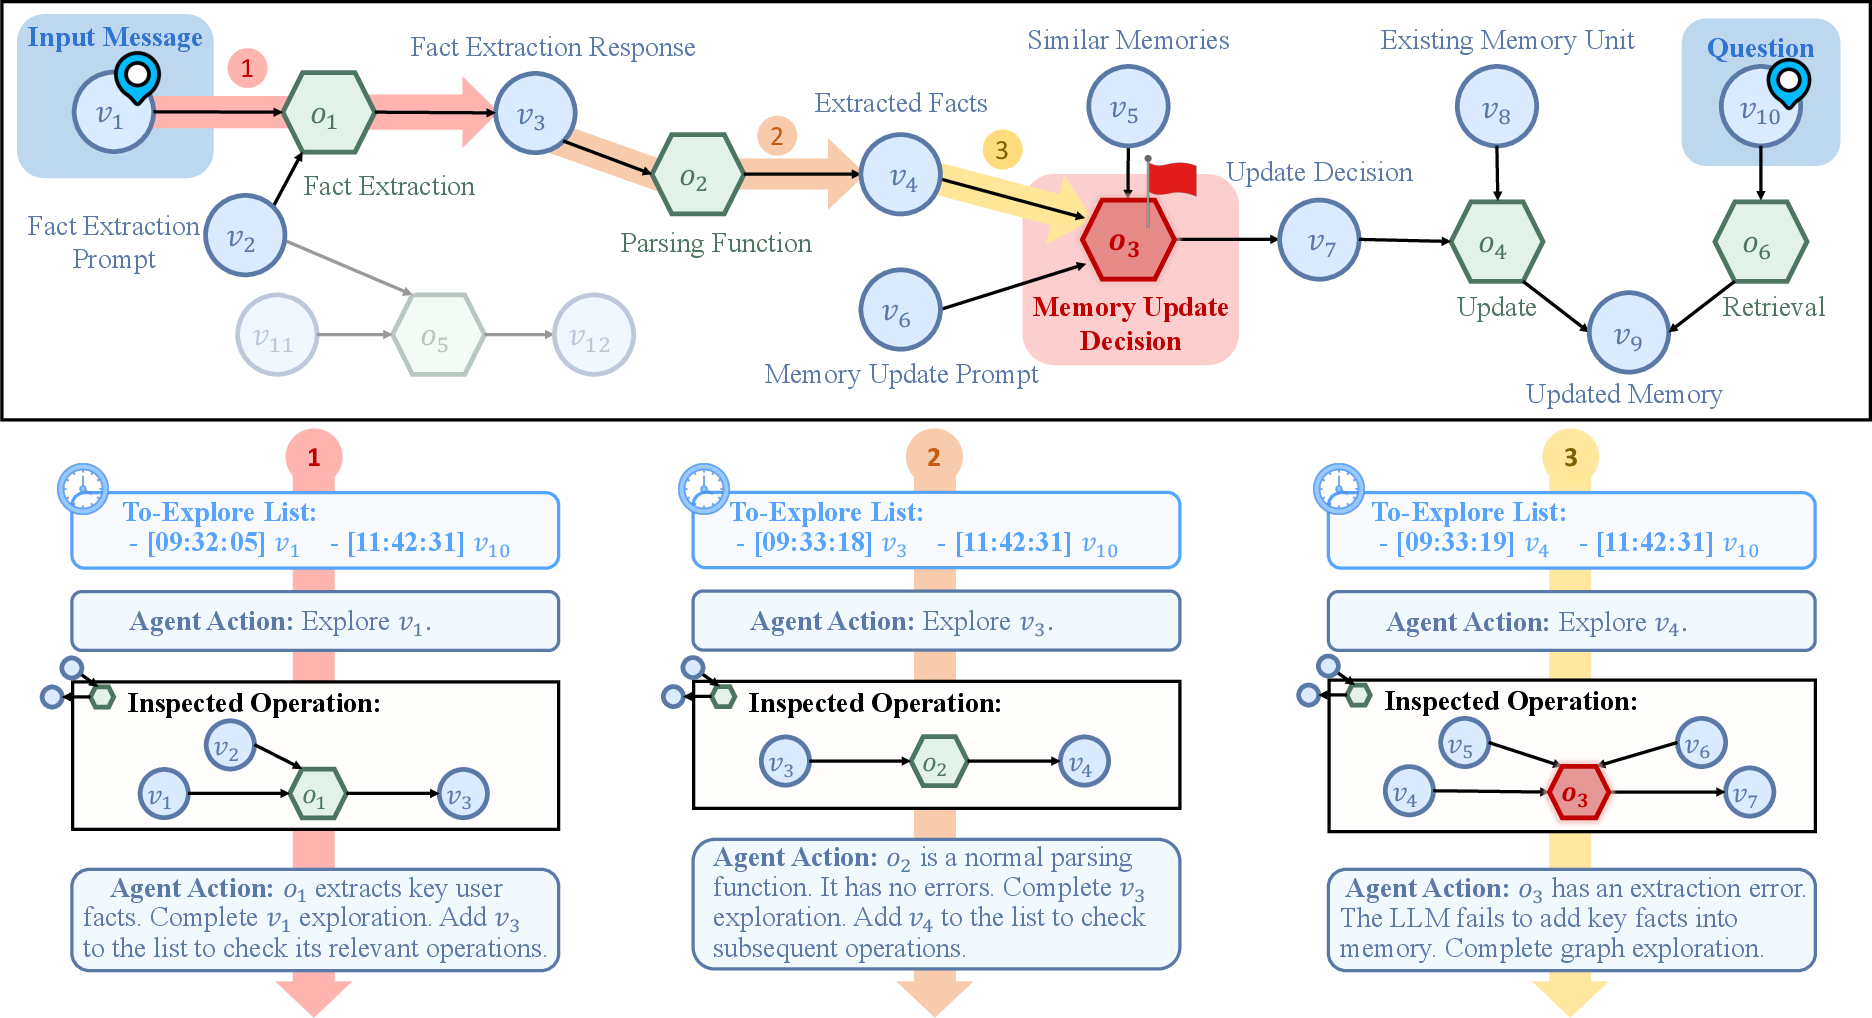
Figure 2: MemTrace's agentic graph exploration: the agent inspects operation subgraphs, prioritizing earlier timestamped nodes to pinpoint faults.
Initialization leverages hybrid retrieval (dense + sparse) with reciprocal rank fusion on question and golden answer concatenations, yielding a compact to-explore list and minimizing search space expansion. Graph exploration dynamically selects operation-local subgraphs for inspection, favoring temporal causality. Context management exploits preview modes, selective variable inspection, pagination, and threshold-based summarization to handle superlinear trace sizes, exceeding 106 tokens in advanced benchmarks.
MemTraceBench: Systematic Benchmarking of Failure Modes
MemTraceBench is constructed from LoCoMo, LongMemEval, and RealMem datasets, spanning four representative memory systems. It includes fully instrumented execution graphs, QA pairs, error labels, explanation, and system configuration metadata. Annotation involves detailed interface workflows enabling backward and forward tracing for efficient operation identification, despite heavy graph size and diverse schema.
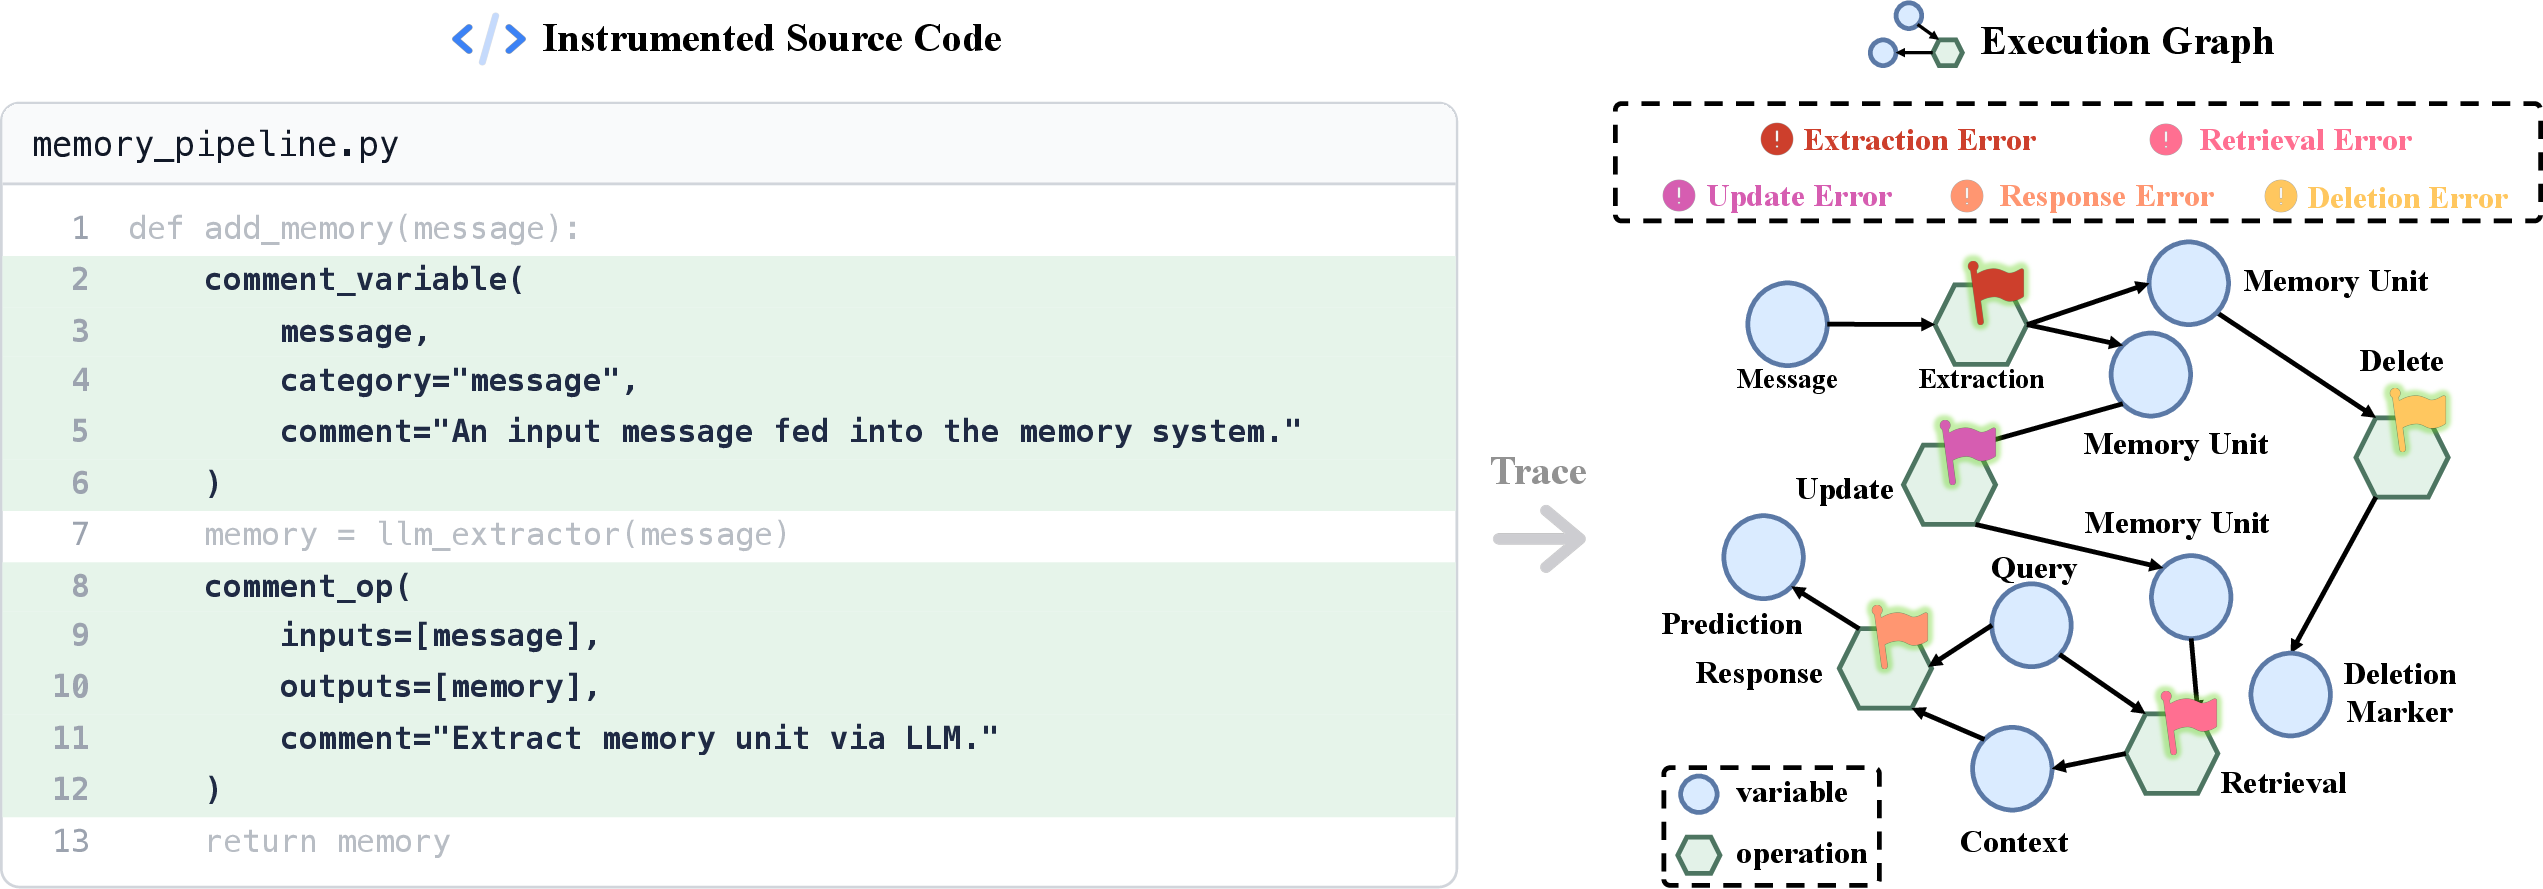
Figure 3: Dataset construction: error taxonomy definition, instrumentation, graph collection, annotation workflow for MemTraceBench.
Error taxonomy encompasses extraction, update, deletion, retrieval, response, annotation, and LLM-as-a-Judge errors, capturing all lifecycle failure points. High annotation difficulty and inter-annotator disagreement confirm inherent complexity of attribution tasks.
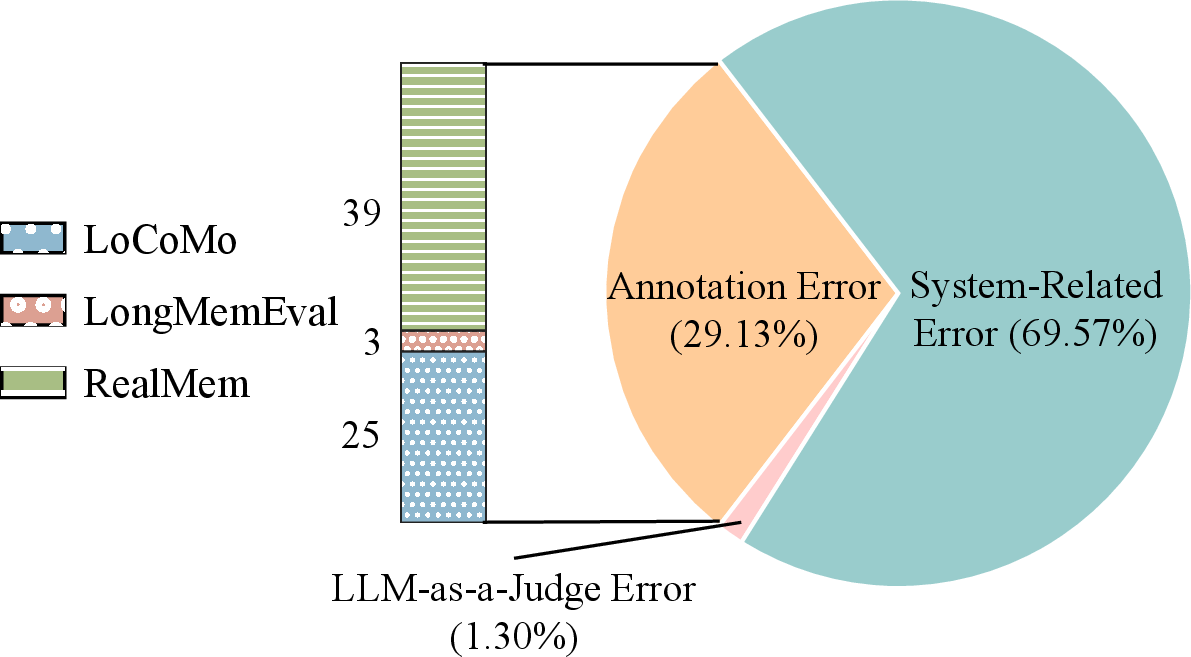
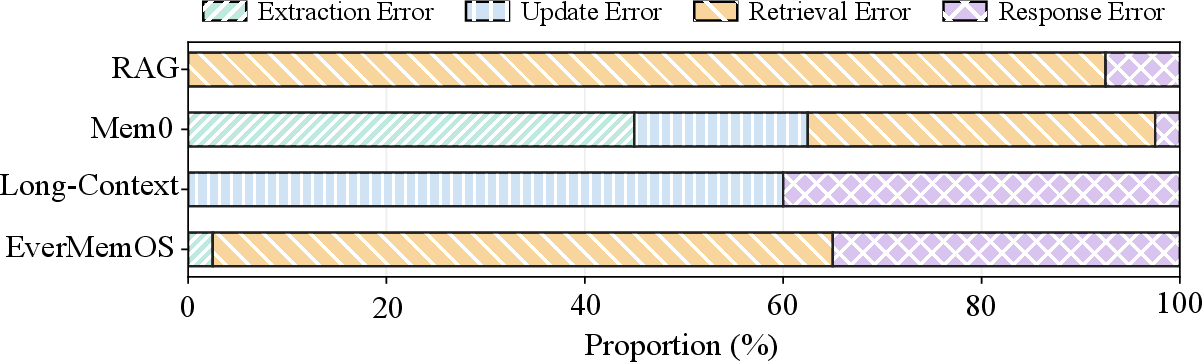
Figure 4: Distribution of error types across datasets, revealing diverse failure patterns.
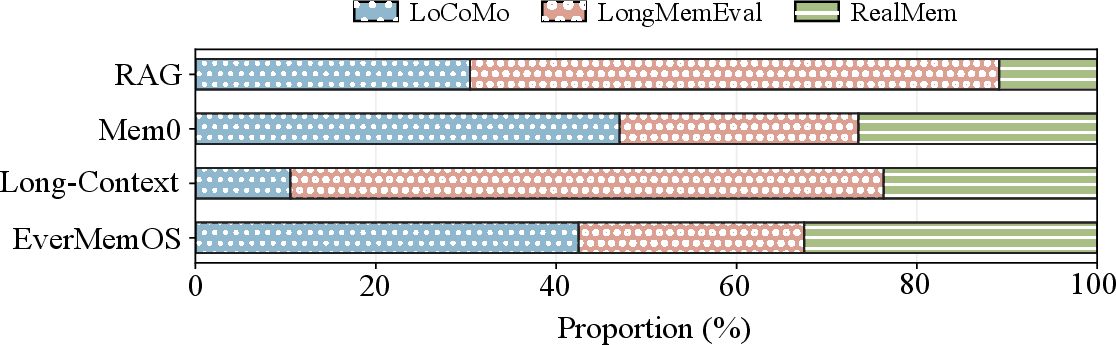
Figure 5: Distribution of system-related errors by dataset source for each memory system.
Numerical Evaluation and Empirical Results
MemTrace demonstrates strong improvement in error-type prediction accuracy (ETA) over search-driven baselines, especially for smaller LLM agents (e.g., GPT-4.1 mini: MemTrace boosts overall ETA to 36.46%). Operation identification accuracy (OIA) remains the harder subproblem, peaking at 46.25%, indicating fine localization is only partially solved. Graph-based exploration outperforms search-based approaches on structured traces, while search-based exploration is more scalable for weakly structured logs, using only 15.25% tokens and 27.94% runtime for long-context tasks. Attribution cost remains substantially lower than manual diagnostic review.
Systematic Failure Analysis and Diagnostic Reporting
MemTrace enables operation-level aggregation of errors, generating detailed diagnostic reports for each pipeline component. For Mem0, failures arise from memory updates corrupting event boundaries, extraction missing temporal and evaluative details, retrieval favoring semantically adjacent but not answer-bearing facts, and QA models providing plausible but unsupported synthesis. Compositionality of errors is evident: early extraction omissions prevent successful downstream retrieval and response aggregation.
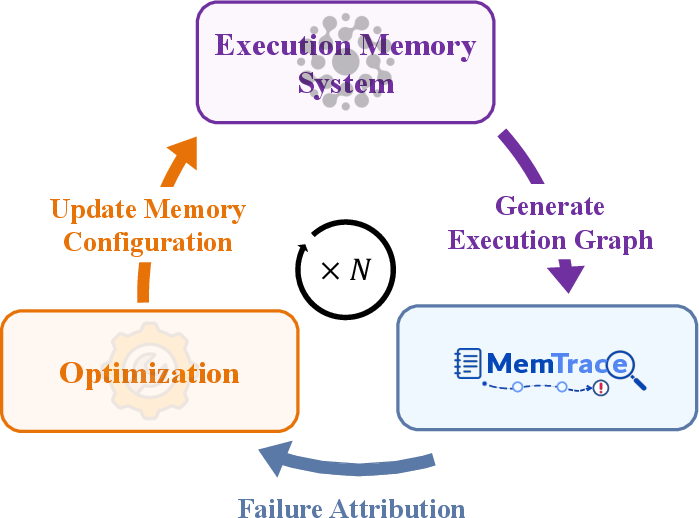
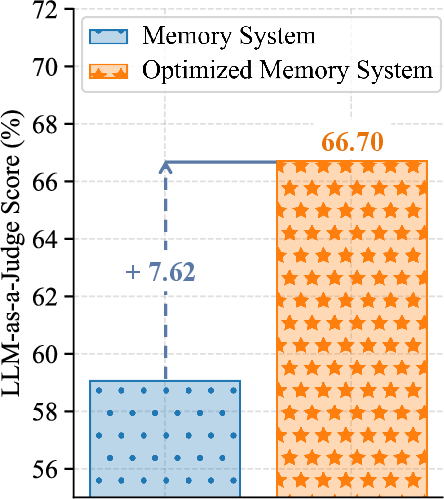
Figure 6: MemTrace pipeline overview: execution graph construction, agentic exploration, and prompt optimization.
Similarly, EverMemOS exhibits response-stage evidence misuse, retrieval controller errors (stale-state exclusion, off-target query generation), and state-tracking fragility in temporal and decision structure distinction.
Applications: Closed-Loop Prompt Optimization
MemTrace's fine attribution facilitates credit assignment for prompt optimization. By localizing errors to specific prompt-involved operations, optimization is reduced to small, tractable contexts. Automatic optimization with three rounds on Mem0 achieves a 7.62% performance improvement, despite imperfect attribution (~72.5% OIA), showing practical efficacy in multi-session settings.
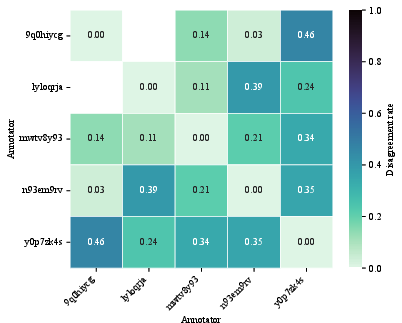
Figure 7: Token distribution in execution traces for each memory system (average exceeds 1M tokens per system).
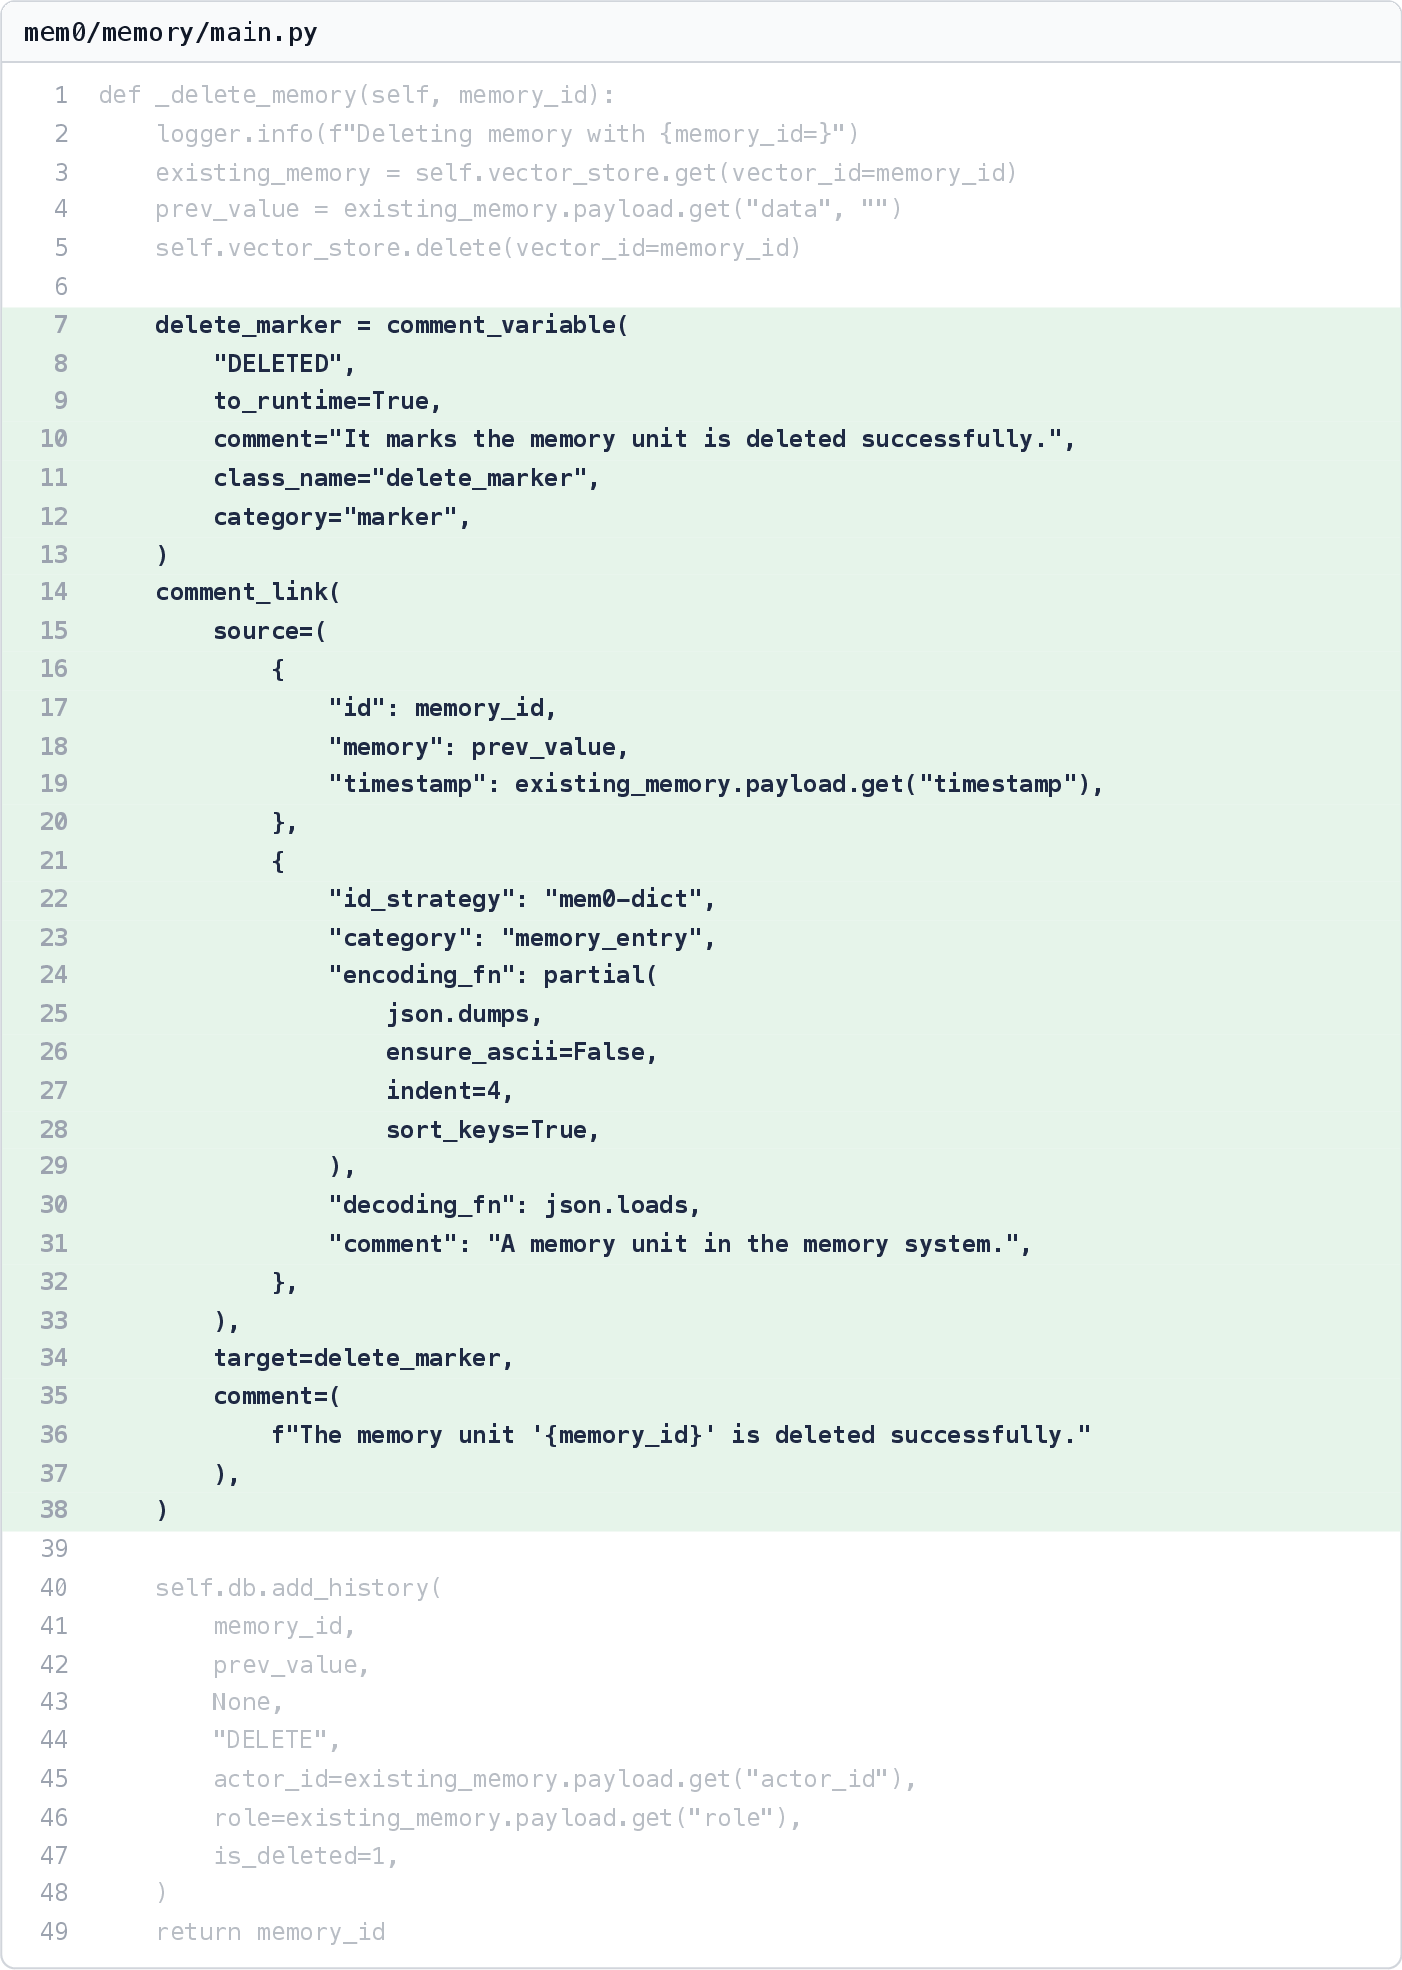
Figure 8: Example of smartcomment instrumentation for memory deletion in Mem0, demonstrating explicit traceability.
Implications and Future Directions
MemTrace shifts diagnostic paradigms for LLM memory systems, moving from static, outcome-oriented evaluation to granular, causal, operation-level attribution. The generality of execution graph tracing and agentic failure localization suggests applicability to broader compound systems (e.g., multimodal, workflow, multi-agent settings). Critical limitations include coverage of non-singleton decisive error sets, further benchmark scaling, and deeper integration of global and local search paradigms to improve OIA. Future research may explore causal feedback propagation for task memory, multimodal memory, and dynamic provenance tracking, toward scalable transparency and reliability for advanced agentic AI infrastructures.
Conclusion
MemTrace introduces a systematic, formal framework for tracing, attributing, and correcting errors in non-parametric LLM memory systems, supported by a domain-specific benchmark and efficient annotation infrastructure. Results confirm both the difficulty and value of fine-grained causal attribution, enabling closed-loop system optimization and actionable diagnostic guidance for advanced LLM agent development (2605.28732).

