- The paper presents the NetMob26 dataset, integrating GPS telemetry, ticketing, environmental, and socio-demographic data to capture both supply and demand facets of Niterói's bus mobility.
- It employs rigorous preprocessing and anonymization techniques to ensure privacy while enabling spatiotemporal analysis of fleet operations and commuter behaviors.
- Key findings include an average trip duration of 87.42 minutes, distinct commuting peaks, and identification of core transit corridors that inform potential urban transit optimizations.
NetMob26: A High-Resolution Multi-Source Urban Mobility Dataset for Niterói
Dataset Scope and Composition
The NetMob26 dataset constitutes an operational, system-level representation of urban mobility in Niterói, Brazil, capturing both supply and demand dimensions of the public bus network over March 2026. Its architecture integrates four principal data modalities:
- Bus fleet GPS telemetry: High-frequency geolocation traces (15–30s intervals) for real-time spatial-temporal vehicle movement reconstruction.
- Ticketing transactions: 7.2 million boarding records, including anonymized user identifiers, fare types, transfers, card classification, and temporal context.
- Auxiliary infrastructure and environmental data: Detailed georeferenced route geometries, bus stop locations, integration terminals, and meteorological records (hourly temperature, precipitation, wind).
- Socio-demographic and urban context: Neighborhood-level census data, locations of education and health facilities, and mobility-related assets (parking lots, bicycle stations).
The data underwent rigorous preprocessing and anonymization, including irreversible hashing of user IDs, exclusion of personally identifiable information, and cleaning for out-of-service vehicles and inconsistent telemetry. Operational records are organized as daily CSV files, conforming to GTFS standards and supporting direct spatiotemporal analysis.
Urban and Operational Context
Niterói is a dense metropolitan node in Rio de Janeiro state with pronounced commuting flows and multimodal integration. Its administrative structure—five regions, 52 neighborhoods (Figure 1)—facilitates granular mapping and urban service provision.
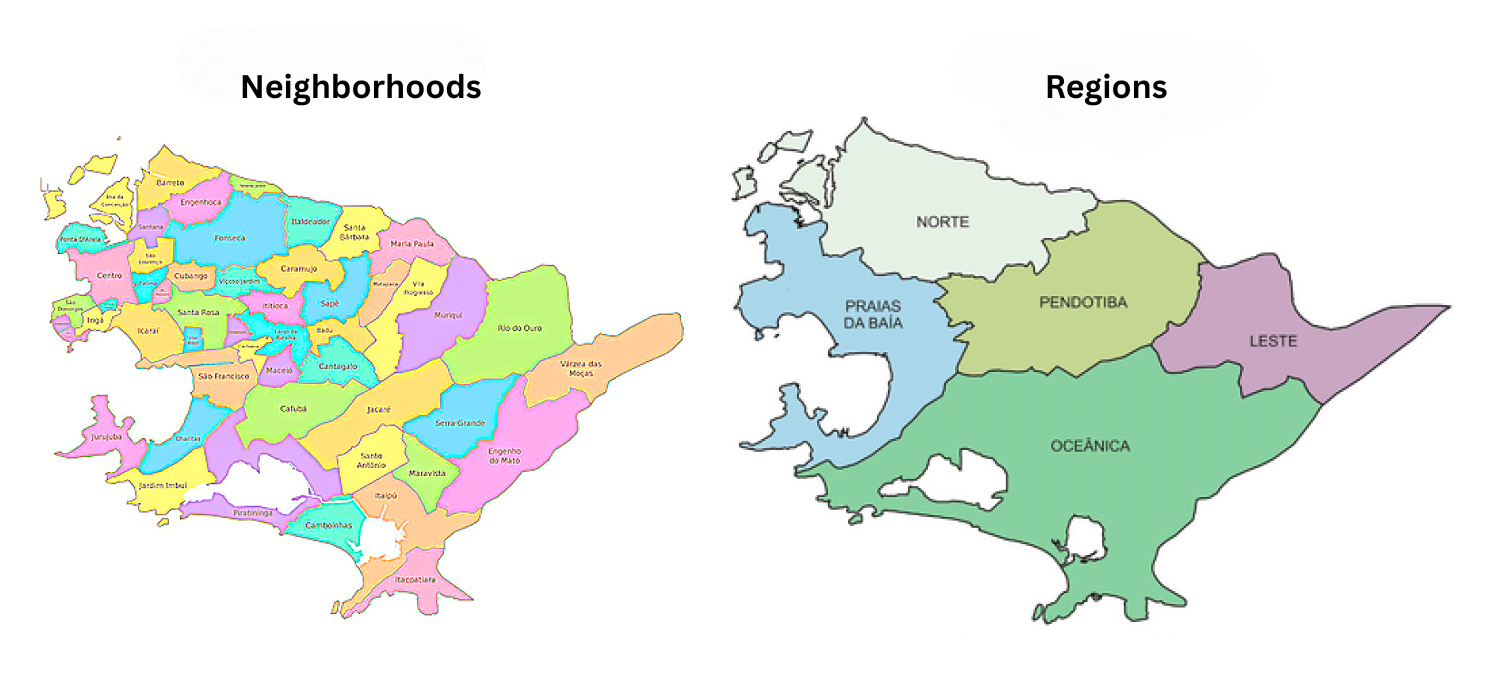
Figure 1: Administrative regions and neighborhoods of Niterói, Brazil, underpinning spatiotemporal sampling.
The Bilhete Único Niterói system, providing fare integration for two trips within a 60-minute window (excluding round-trips on the same line), enables detailed analysis of subsidy impact, integration effectiveness, and spatial accessibility.
Exploratory Characterization
Supply: Fleet Dynamics and Bus Trajectories
Spatial vehicle density visualizations reveal core transit corridors and operational coverage (Figure 2). Comprehensive trip-level statistics show an average trip duration of 87.42 minutes (σ = 42.12), with a right-skewed distribution towards longer commutes and outlier congestion events (Figures 3, 4).
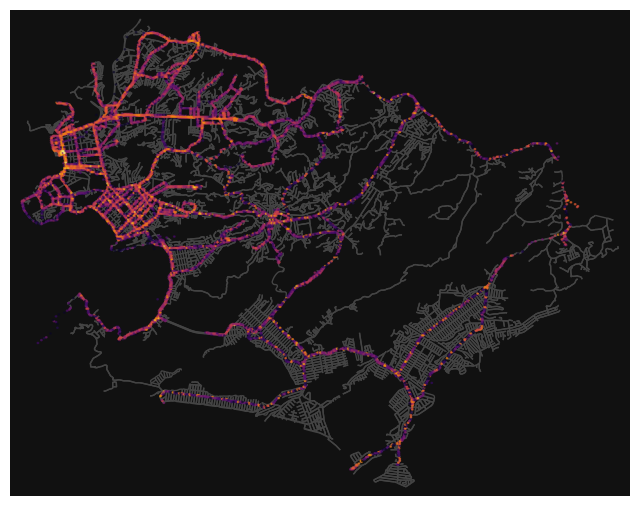
Figure 2: Transit density mapping for Niterói, March 11–14, highlighting major corridors and mobility flows.
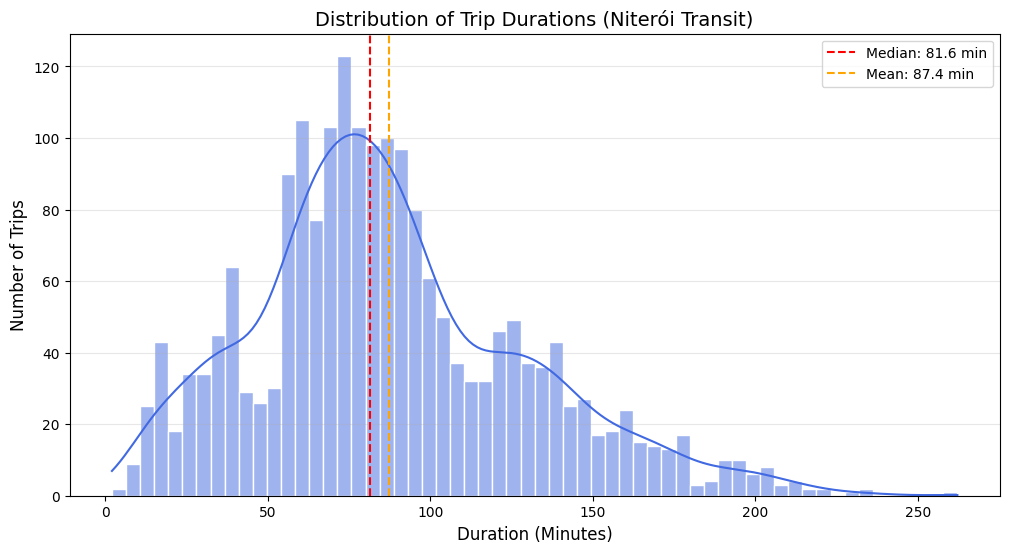
Figure 3: Empirical distribution of trip durations, evidencing variability and a long-tailed pattern.
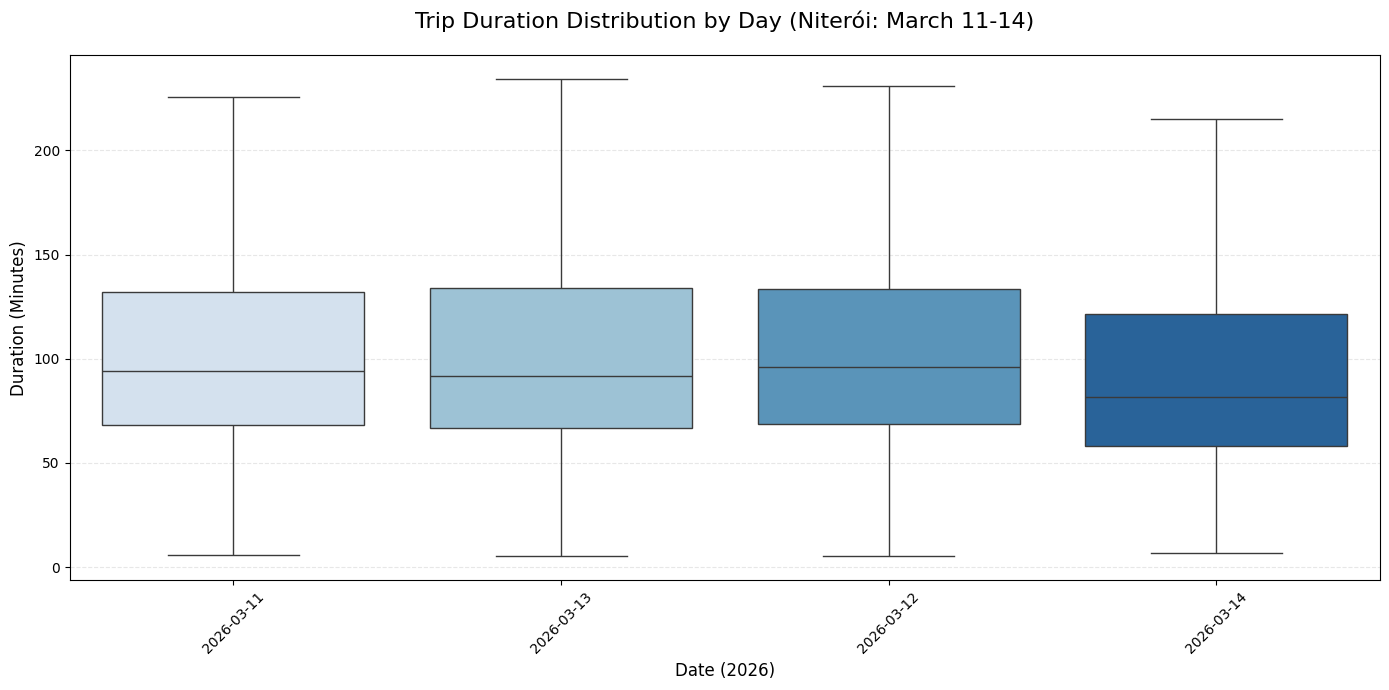
Figure 4: Trip duration per day, showing stability in median values but reduction in event counts toward weekends.
Top-10 line volume comparison demonstrates heterogeneous demand concentration and strong weekly periodicity, with high-frequency lines such as 49.2 dominating operational metrics (Figure 5).
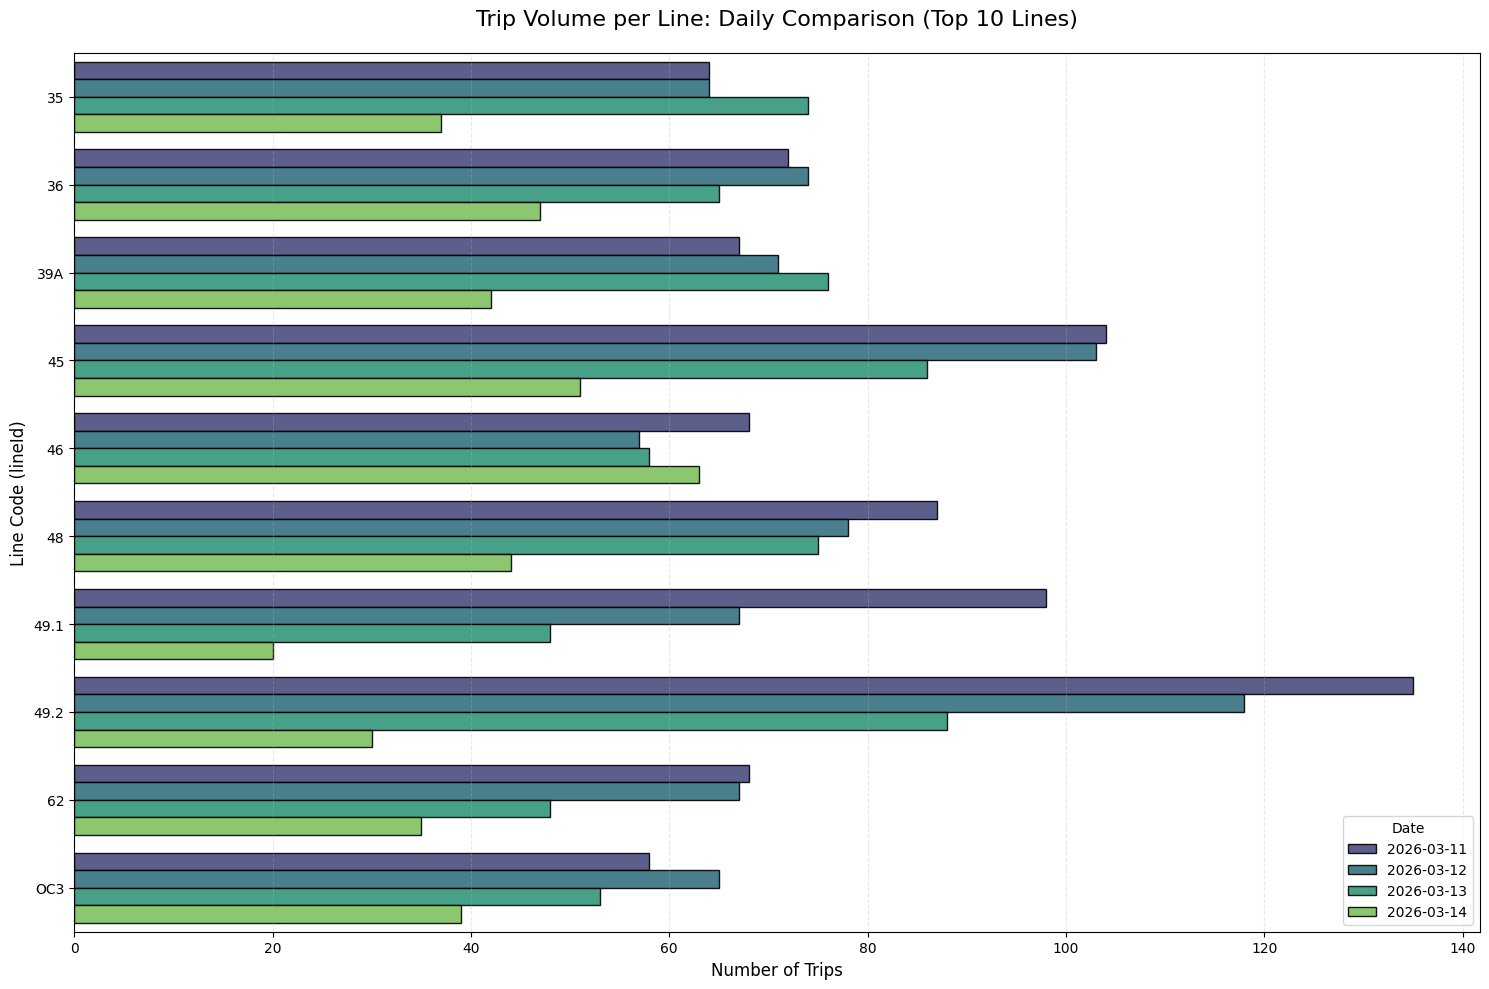
Figure 5: Daily trip volume for the top 10 lines, revealing differentiated service demand and weekly modulation.
Demand: Passenger Boarding Patterns
Temporal demand profiles show sharply defined commuting peaks (morning at 04:00, afternoon at 14:00), with substantial demand reduction during weekends (Figures 6, 7). Hourly record aggregation enhances modeling of occupancy fluctuations and temporal coverage.
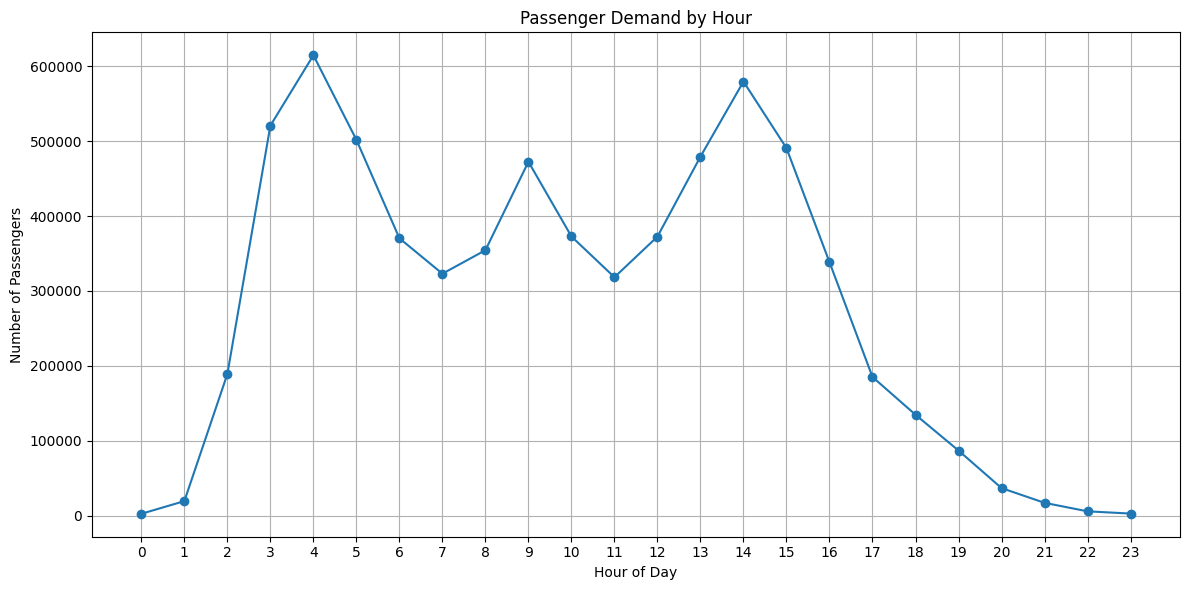
Figure 6: Hourly distribution of passenger demand, accentuating commuting-related peaks and troughs.
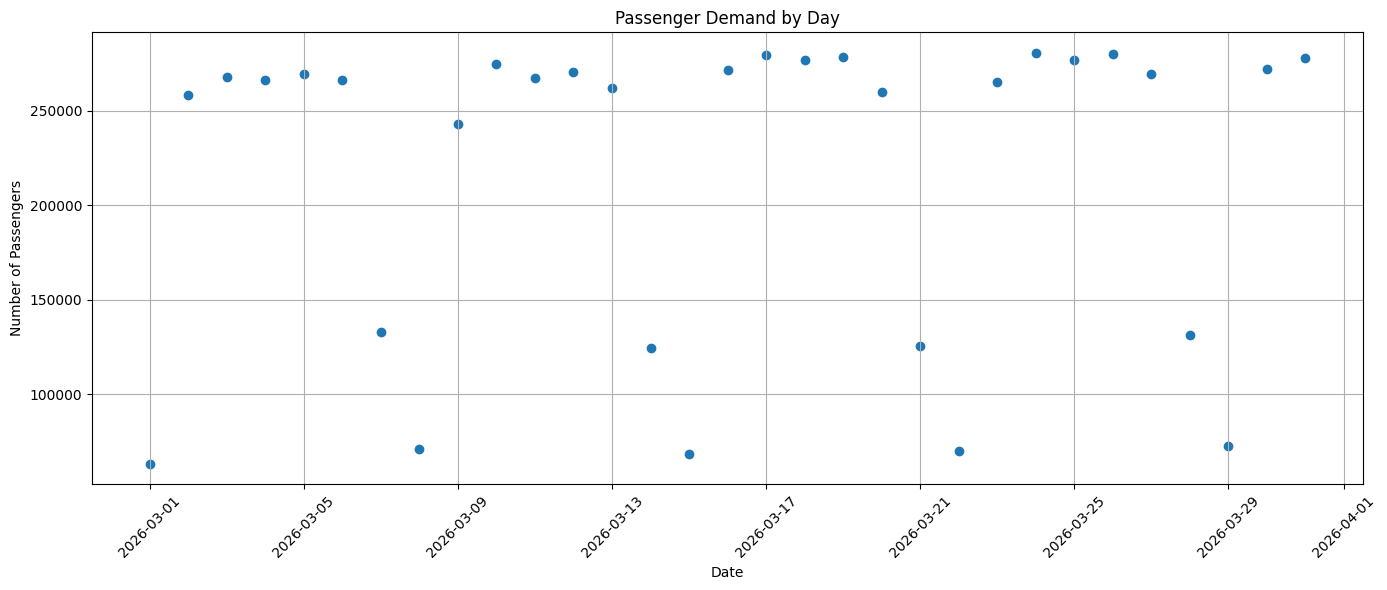
Figure 7: Daily passenger demand for March 2026, with pronounced weekday/weekend contrast.
Passenger activity histograms, excluding cash (anon_user_id=0), demonstrate strongly asymmetrical trip frequency distributions—median of 9, mean of 15 trips per user, with a substantial long tail of recurrent commuters (Figure 8).
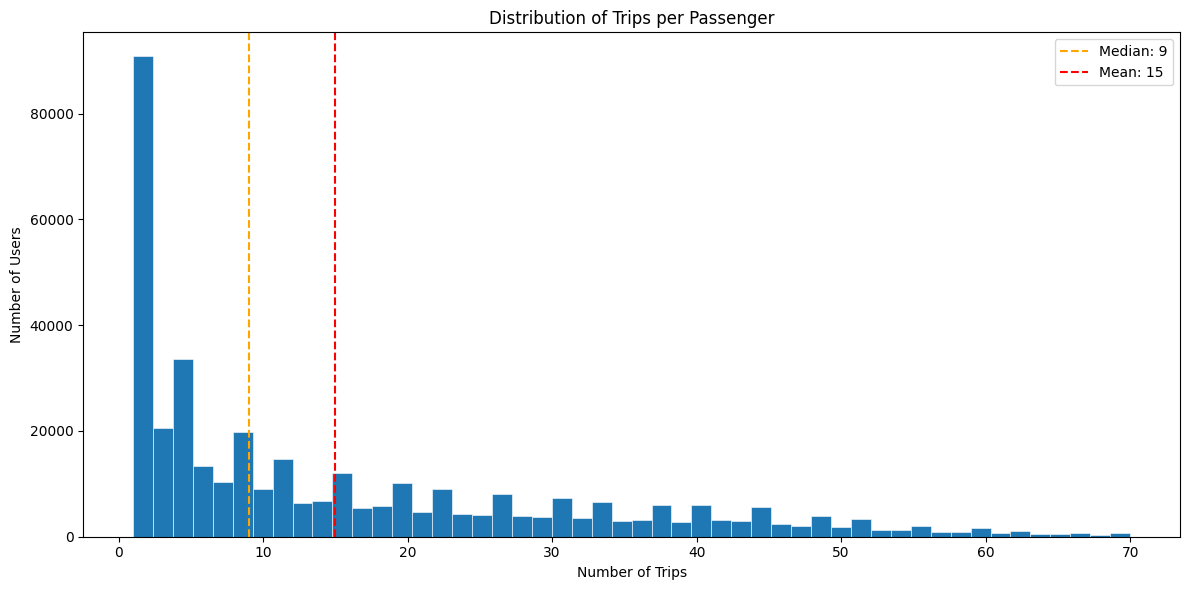
Figure 8: Asymmetrical distribution of trips per passenger, emphasizing the heterogeneity of usage profiles.
Environmental Context
Temperature and rainfall timeseries characterize the climatic environment influencing operational reliability and ridership. March 2026 data exhibits stable tropical cycles; rain events are sporadic but include significant accumulations, with implications for demand anomalies and fleet performance (Figures 9, 10).
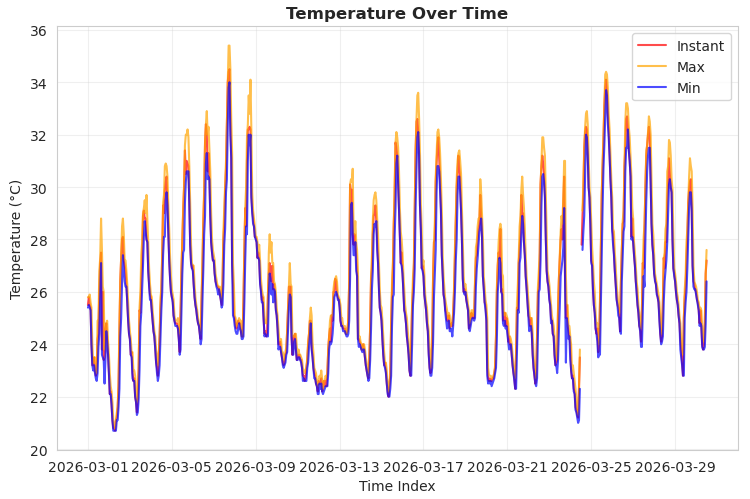
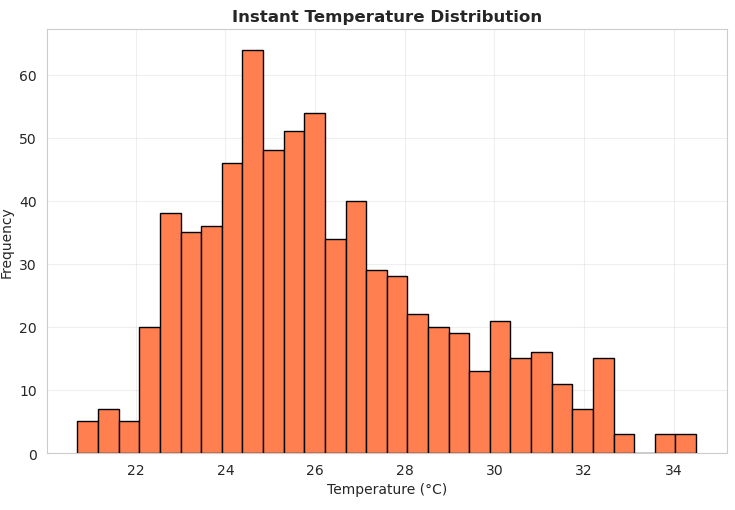
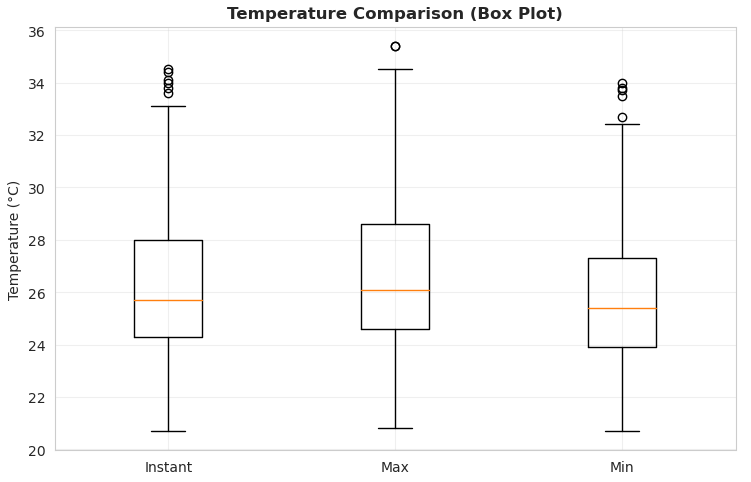
Figure 9: Hourly and daily temperature fluctuation patterns for March 2026.
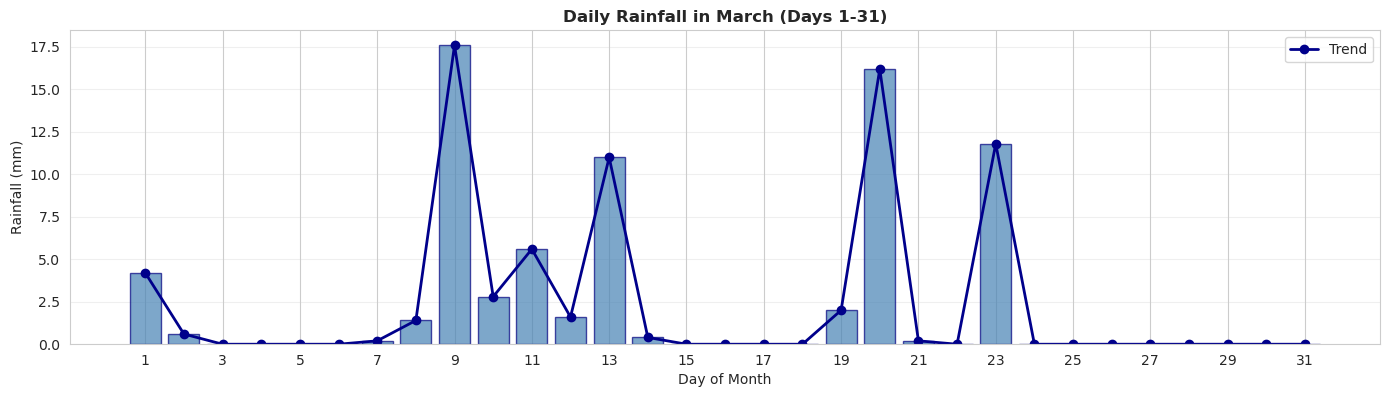
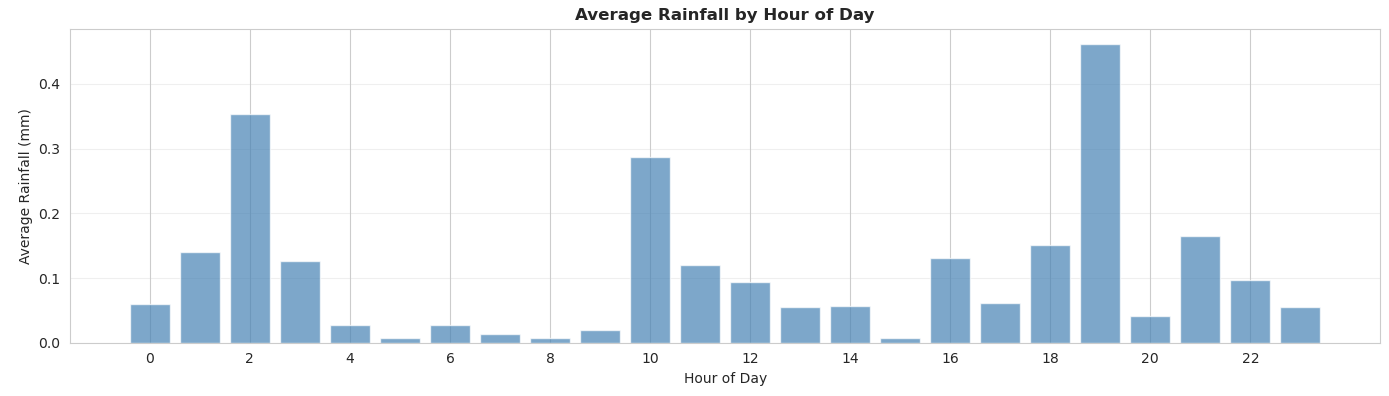
Figure 10: Daily rainfall amounts, highlighting concentration of precipitation in a minority of days.
Analytical and Practical Implications
The NetMob26 dataset provides a high-resolution foundation for data-driven urban mobility research. Operational data support headway estimation, trip time prediction, occupancy analytics, and network reliability assessment; ticketing data enable granular modeling of demand, subsidy structures, and accessibility mapping. The integration with meteorological and contextual layers allows inference of exogenous impact on transit systems.
Potential analytical directions include:
- Demand–supply alignment: Spatiotemporal cross-referencing of boarding events and fleet telemetry for occupancy and corridor prioritization.
- Weather effect modeling: Direct correlation of rainfall and temperature spikes with mobility anomalies or system disruptions.
- Equity and accessibility analysis: Integration of route coverage and urban infrastructure with socio-demographic information for quantitative evaluation of service adequacy.
- Anomaly detection and service optimization: Real-time monitoring for operational deviations, leveraging rich telemetry streams.
The structure supports machine learning methodologies (e.g., GNN+LSTM for arrival prediction [lopes2024towards, aemmer2022measurement]) and reproducible benchmarking for transit systems with documented operational and privacy compliance.
Theoretical Relevance and Research Landscape
NetMob26 extends the tradition of open mobility data challenges, drawing from precedents such as D4D, Telecom Italia, D4R, and NetMob25 [blondel2013d4d, barlacchi2015multisource, martinez2023netmob23, netmob25]. Relative to survey-based and mobile network datasets, its operational granularity and multi-source linkage advance the possibilities for reproducible analysis and system-scale inference.
The dataset facilitates cross-disciplinary studies—transportation engineering, urban computing, computational social science—with applicability for theoretical mobility modeling, real-time policy optimization, and accessibility metrics for the Global South context. The absence of individual trajectory chains avoids privacy pitfalls, while event-level anonymization enables demand modeling without risk of re-identification.
Future Directions
NetMob26 is positioned to catalyze methodological innovation in urban mobility research, particular for:
- Adaptive transit scheduling and efficiency analysis, utilizing real-time and historical operational records.
- Equitable accessibility mapping by combining urban infrastructure, demographic census, and fare integration features.
- Predictive modeling of multi-modal transit networks with proximate environmental variables.
- Policy evaluation frameworks for subsidy allocation, service extension, and integration effectiveness.
Further, its open-access challenge framework (NDA-based) establishes a reproducible standard for mobility datasets, augmenting the corpus of machine-readable urban data.
Conclusion
The NetMob26 dataset delivers an analytically rich, privacy-compliant, multi-source foundation for empirical and computational research in urban bus mobility, demand modeling, and transportation system optimization in Niterói. Its integration of telemetry, transaction, environmental, and urban context layers fosters detailed and reproducible analysis of supply–demand interaction, accessibility, and external impact. The dataset's structure and documentation are aligned for high-resolution, interdisciplinary research and scalable methodological development in mobility science and urban informatics.
Availability: Data access is limited to NetMob26 Challenge participants per NDA; documentation and reference notebooks are maintained for reproducibility and scientific utility (2605.20263).