- The paper introduces a framework that separates calibration and discrimination using the Spiegelhalter Z-statistic and AUC-ROC.
- It establishes a quadrant taxonomy that prescribes targeted post-hoc calibration strategies for different classifier archetypes.
- Empirical validation over 21 models and 30 datasets confirms the framework's reproducibility and practical impact on model evaluation.
The Manokhin Probability Matrix: Diagnostic Separation of Calibration and Discrimination in Binary Classifier Assessment
Introduction
The Manokhin Probability Matrix proposes a unifying framework for empirical and diagnostic evaluation of predicted probabilities from supervised binary classifiers, explicitly disentangling two critical properties conflated by aggregate proper scoring rules: calibration and discrimination. The framework operationalizes this separation by classifying base classifiers into quadrants based on empirical ranks along two orthogonal axes: expected absolute Spiegelhalter Z-statistic (calibration error, lower is better) and expected AUC-ROC rank (discrimination, lower is better), computed over 21 representative models and 30 real-world tabular datasets. This framework renders explicit and actionable the asymmetry where discrimination is post-training intractable by monotonic rescaling, while calibration admits powerful post-hoc correction. The empirical protocol—unified, transparent, and reproducible—provides a robust empirical substrate for the conceptual recommendations made.
Traditional evaluation strategies in machine learning adopt aggregate metrics such as the Brier score, which, though strictly proper, fails to identify the source of performance deficits because it conflates reliability (calibration) and resolution (discrimination). The decomposition following Murphy (1973) and Spiegelhalter (1986) expresses the Brier score as a sum of reliability (discrepancy between predicted and empirical probabilities), resolution (variance of observed frequencies across predicted probability bins), and data-driven uncertainty. However, even in fields with mature quantification cultures, such as meteorology, systematic separation of these components is not the norm in ML.
In the Manokhin framework, discrimination is formalized via AUC-ROC, which—being order-preserving and insensitive to monotonic transformations—isolates a classifier’s ability to properly order instances. Calibration is measured by the Spiegelhalter Z-statistic, a bin-free frequentist test with interpretable thresholds, formalizing the null hypothesis of perfect calibration-in-the-large, which brings strong statistical justification over conventional binned measures such as ECE or ACE.
Quadrant Taxonomy: The Manokhin Probability Matrix
The matrix partitions model space into four archetypes using population-median splits on both axes (or, alternatively, the bin-free absolute threshold for ∣Z∣):
- Eagle (Type I): Well-calibrated, high discrimination (CatBoost, TabICL, EBM, TabPFN, GBC, RF)
- Bull (Type II): Poorly calibrated, high discrimination (XGBoost, LightGBM, HGB, NCA, TabM)
- Sloth (Type III): Well-calibrated, low discrimination (LDA, SVM, LR, TabTransformer, AVG)
- Mole (Type IV): Poor calibration, low discrimination (ExtraTrees, RealMLP, NB, MLP, KNN)
These archetypes are not merely suggestive: prescriptions are derived from the observed effect of post-hoc calibration and the theoretical guarantees of such procedures.


Figure 1: The Manokhin Probability Matrix partitions 21 binary classifiers by empirical calibration and discrimination, formalizing four archetypes and their actionable prescriptions.
Empirical Findings and Prescriptive Recommendations
The empirical study leverages 1×5-fold stratified cross-validation over 30 datasets, quantifying performance variances via expected ranks per classifier. Notably, CatBoost dominates XGBoost and LightGBM in both calibration and discrimination, contradicting earlier assumptions about uniformity among GBDT frameworks. CatBoost achieves the lowest ranks across log-loss, Brier score, and AUC-ROC on the majority of datasets, while XGBoost, despite high discrimination, is nearly universally miscalibrated (>96% of splits at ∣Z∣>1.96), validating its assignment to the Bull quadrant.
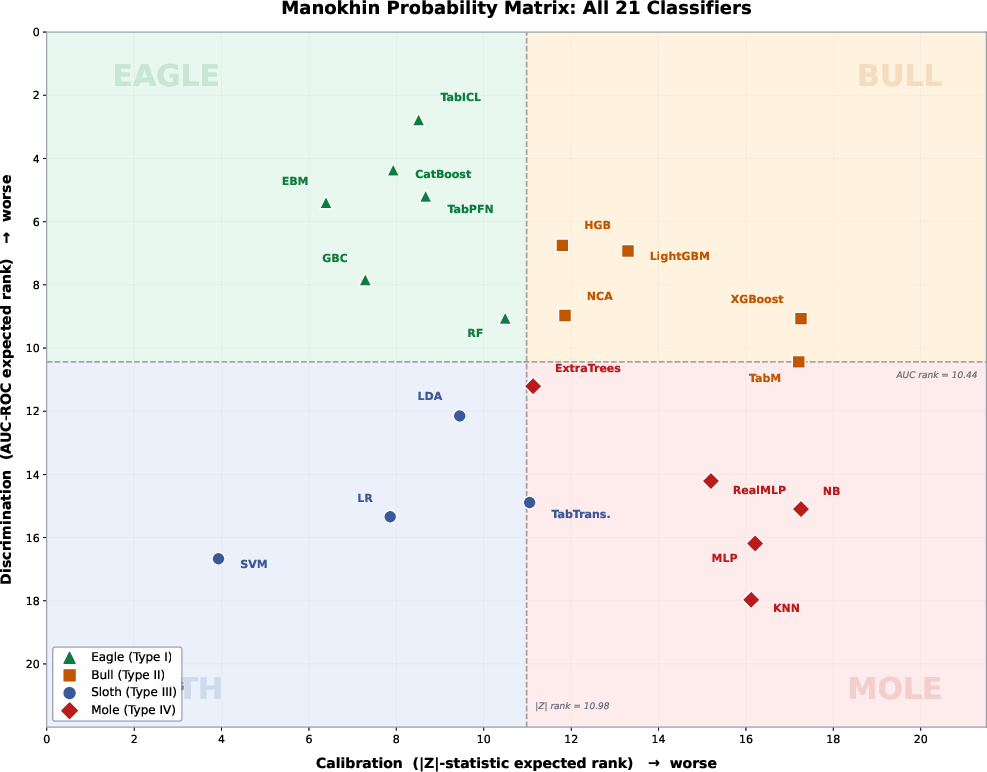
Figure 2: 21 classifiers dispersed in the discrimination-calibration plane, colored and shaped by quadrant; archetypal clusters demonstrate the empirical coherence of the framework.
For post-hoc calibration, the effect is quadrant-dependent:
- Bulls: Venn-Abers dramatically reduces calibration error (e.g., XGBoost: −85.6% in ∣Z∣, −12.6% in log-loss), matching or outperforming parametric alternatives such as beta calibration.
- Eagles: Calibration can degrade log-loss and Brier score, with improvements in ∣Z∣ coming at a cost to proper scoring (CatBoost: Z0 log-loss, Z1 Z2).
- Sloths/Moles: No theoretical possibility for improvement via monotone calibrators.
These findings reinforce the framework’s aphorism: "optimize discrimination during training and address calibration only for high-discrimination, poorly calibrated models".
Theoretical Underpinnings and Limitations
Monotonic post-hoc calibrators cannot improve AUC-ROC due to their order-preserving nature—a direct corollary of their being non-decreasing mappings. Thus, achieving high discrimination is an unconditional prerequisite; calibration can only adjust reliability, not resolution. By decoupling actions along these axes, the framework operationalizes the targeting of interventions.
However, the framework has recognized boundaries:
- The calibration axis (Spiegelhalter Z3) does not detect slope or nonlinearity miscalibration, which could be addressed by metrics such as the Integrated Calibration Index or kernel-based tests.
- Median splits are population-dependent; nevertheless, assignments exhibit robust stability even under principled absolute thresholds.
- The discrimination axis (AUC-ROC) is robust and well-understood, but could be substituted with Brier resolution without materially affecting results.
Crucially, these findings are currently delimited to binary classification for tabular data.
Practical Implications and Future Directions
The framework yields direct, reproducible guidelines:
- Decompose evaluation scores—do not optimize or interpret aggregate Brier score without considering its components.
- Calibrate selectively by quadrant—calibrate Bulls, not Eagles.
- Prioritize discrimination in model development, as post-hoc calibration cannot compensate for its absence.
Future work should extend the matrix to multiclass and non-tabular modalities. Research into calibration tests that capture slope and shape errors, especially in high-capacity and deep architectures, is a priority. The integration of multi-group or subgroup calibration (e.g., multi-calibration approaches) may further refine practitioner guidance. Preliminary per-dataset quadrant assignment stability supports the use of expected ranks, though effect size quantification is warranted for boundary cases.
The large-scale empirical validation and the availability of supporting code and logs (https://github.com/valeman/classifier_calibration) ensure practical reproducibility and encourage extension to new settings.
Conclusion
The Manokhin Probability Matrix systematizes the two-dimensional diagnosis of classifier probability quality, delivers actionable recommendations rooted in theoretical and empirical considerations, and remedies longstanding conflation in mainstream evaluation practice. Its quadrant taxonomy is robust, replicable, and practically actionable in real-world model selection pipelines, contingent on dataset and classifier pool. This framework has significant implications for calibration diagnostics, model selection, and for the operational deployment of reliable probabilistic classifiers in high-stakes tabular domains.