- The paper demonstrates that only models incorporating strong atmospheric drag (τ_drag ≈ 10⁴–10⁵ s) align the phase curve peak with JWST/NIRISS observations.
- It reveals that matching dayside spectra requires combining H₂ dissociation with drag, while nightside features necessitate thick clouds or recombination heating.
- The analysis exposes a 12–17% overprediction in planetary emission and an unexplained blueward phase offset, highlighting gaps in current ultra-hot Jupiter models.
Interpreting the JWST/NIRISS Phase Curve of WASP-121b with 3D General Circulation Models
Introduction
This work rigorously analyzes spatially and spectrally resolved phase curve measurements of the ultra-hot Jupiter (UHJ) WASP-121b, leveraging JWST/NIRISS SOSS spectroscopic coverage over 0.6–2.85 μm. The study evaluates an extensive parameter space of 3D general circulation models (GCMs), systematically altering key physical assumptions: radiative transfer schemes (correlated-k vs. picket fence), hydrogen dissociation/recombination, cloud condensation, and atmospheric drag—specifically both kinematic (MHD-based) and Rayleigh drag. The goal is to identify which physical processes critically set observed day-night contrasts, longitudinal temperature distributions, and wavelength-dependent phase shift behavior.
Observational Baseline and Model Approach
The JWST/NIRISS phase curve yields phase-resolved, spectrally resolved Fp/Fs light curves, constraining the planet's hemispherical emission on day and night sides and thermal phase offsets. The models include RM-GCM and SPARC/MITgcm implementations that vary treatment of opacities, kinetic/MHD drag, cloud microphysics, and hydrogen dissociation.
Notably, the analysis takes care to address the impact of the planet's radius both in its wavelength dependence and in normalization—an aspect known to generate up to 20% uncertainty in integrated flux interpretations and previously underappreciated in model/data comparisons. The study applies a radius ratio appropriate to the NIRISS bandpass to consistently compare flux ratios.
Global Phase Curve Morphology and Atmospheric Drag
The models are benchmarked against the spectrally-integrated (white-light) phase curve, using both amplitude and phase offset relative to the substellar point as diagnostics of day-night energy redistribution and atmospheric circulation.
All GCMs without strong drag substantially overestimate both the planet's emission (by 12–15%) and eastward phase offset, inconsistent with JWST/NIRISS results, which show the emission peak tightly aligned with the substellar longitude (see Figure 1).
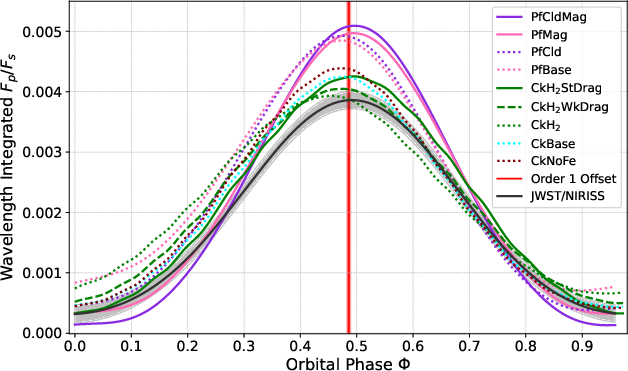
Figure 1: The best fit to the observed white-light phase curve of WASP-121~b, matched against 3-D GCM predictions, demonstrates the requirement for strong drag and underpredicted planetary emission by models.
Strong atmospheric drag (via MHD or short Rayleigh timescale) is found to be essential: only with τdrag≲104–105 s near the photosphere do simulated phase curve peaks match the data, indicating suppressed eastward advection and limited day-night recirculation. This constraint is robust across both code bases and consistent with independently inferred values for UHJs showing minimal phase offset.
Spectral Diagnostics: Day-Night Emission and Clouds
Day and nightside emission spectra provide deeper insight into the vertical and horizontal thermochemical gradients.
- Dayside: Correlated-k GCMs with neither drag nor H2 dissociation provide fits to spectral features but overpredict the overall flux. Adding H2 dissociation suppresses dayside emission, yet only models that combine drag and H2 dissociation match the observed flatness and reduced flux.
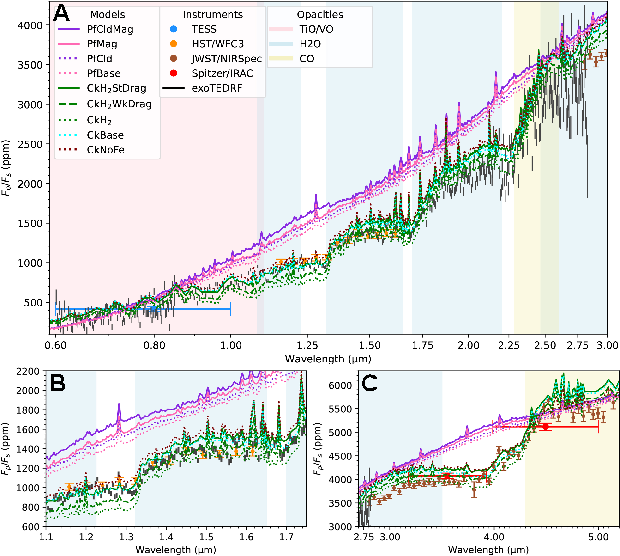
Figure 2: The dayside spectrum of WASP-121 b, NIRISS+ancillary measurements compared to model predictions spanning differing drag, cloud, and opacity physics.
- Nightside: The nightside spectrum from NIRISS is both faint and lacks strong molecular absorption features (notably water), at odds with predictions from clear-atmosphere models. Only inclusion of thick nightside clouds or strong drag plus recombination heating yields sufficiently shallow temperature gradients and vertically isothermal emission regions to match this featureless spectrum.
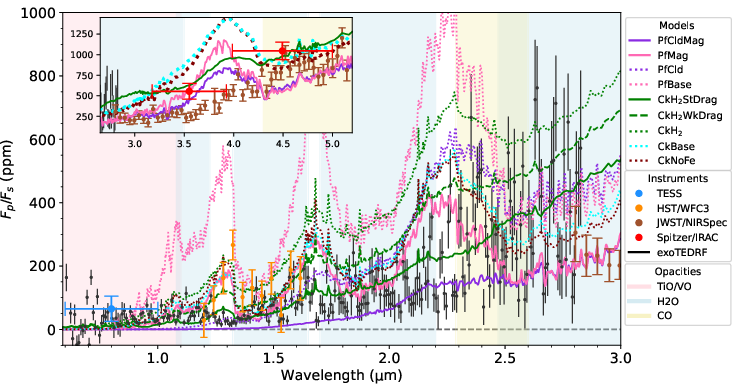
Figure 3: The nightside emission spectrum of WASP-121~b; only models with nightside clouds or strong drag and H2 recombination reproduce the observed spectral flatness and low flux levels.
Spatially-averaged vertical P–T profiles clearly demonstrate that dayside regions exhibit strong temperature inversions across all models, while the nightside profile shape and brightness temperature are highly sensitive to cloud loading, recombinative heating, and dynamical suppression by drag.
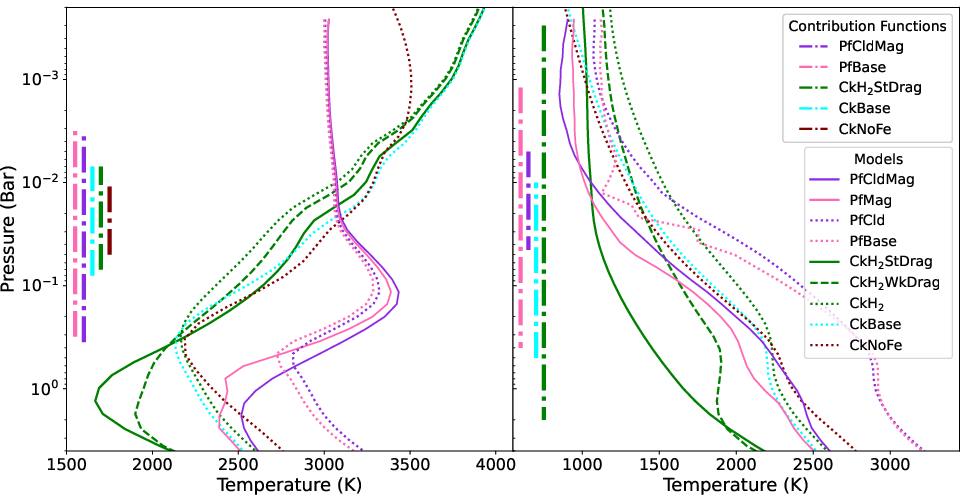
Figure 4: Dayside (left) and nightside (right) P–τdrag≲1040 profiles from representative GCMs; reduced nightside gradients are associated with clouds and drag/recombination physics.
Phase-Resolved Symmetry, Longitudinal Structure, and Wavelength-dependent Offsets
A detailed comparison of spectra observed at phases symmetric about the star-planet axis (τdrag≲1041) illustrates that the observed emission shows remarkable longitudinal symmetry—a diagnostic of minimal eastward advection and again requiring strong drag.
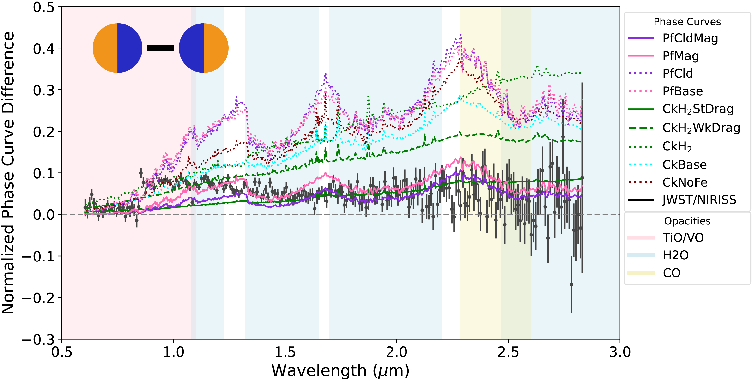
Figure 5: Symmetry in NIRISS τdrag≲1042 spectra at τdrag≲1043 and τdrag≲1044 relative longitude phases; models with strong drag best reproduce this symmetry.
Phase curve offsets as a function of wavelength further probe atmospheric dynamics as a function of pressure depth. Models exhibit strong variation in phase offset with wavelength only in the absence of sufficient drag, whereas data show a relatively uniform and small offset, except at short wavelengths (τdrag≲1045m)—a trend not explained by any current GCM.
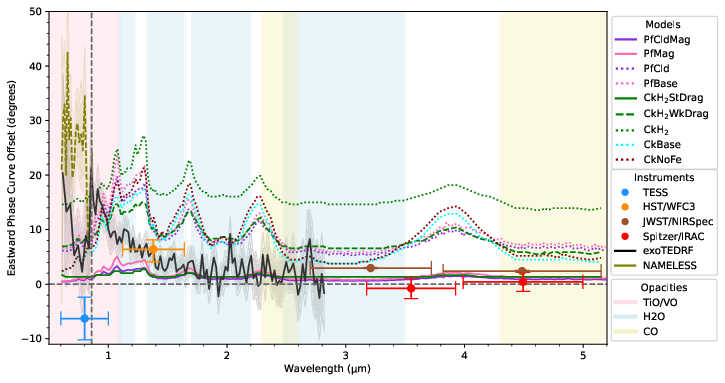
Figure 6: The phase offset spectrum shows an unexplained rise at short wavelengths; strongly dragged GCMs fit the longer-wavelength flatness but none match the observed blueward increase in offset.
Clouds and the East–West Asymmetry in Reflective and Emissive Maps
Spatially resolved maps of reflected/incident starlight confirm that in regimes with strong drag, cloud formation is symmetrically distributed near the limb, but in drag-free models, clouds preferentially form on the western limb due to the global circulation pattern. Nevertheless, the models demonstrate that neither scenario generates the observed increasing phase offset at short wavelengths; cloud-induced reflection never preferentially shifts the bright region eastward.
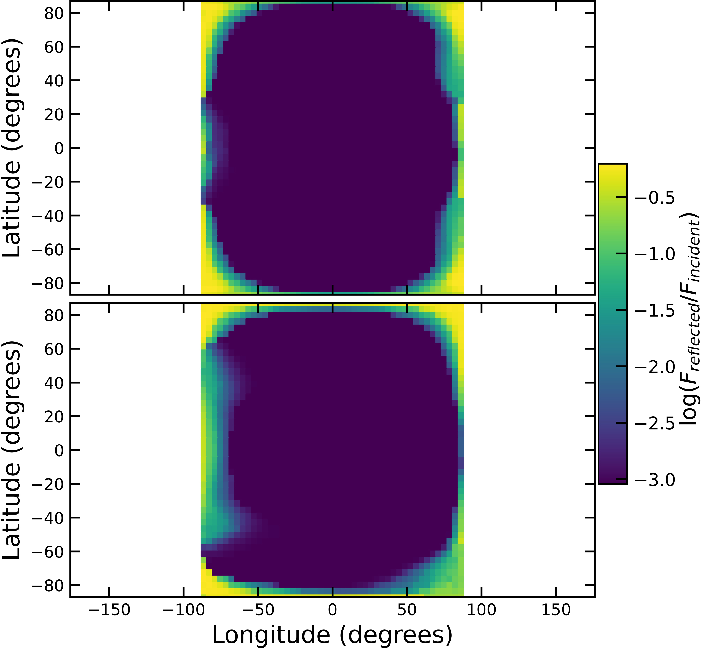
Figure 7: Maps of reflected light showing cloud impact: MHD drag yields symmetric limb clouds (top), drag-free circulation yields enhanced western terminator cloudiness (bottom).
Physical Degeneracies and Theoretical Limitations
The paper highlights the limitations of the radiative transfer treatments: picket-fence schemes substantially overpredict dayside temperature and fail to capture the strength and vertical extent of inversions seen in correlated-k models and inferred from data. This has negligible effect on the nightside cloud diagnosis but renders such models less reliable for spectral feature analysis on the dayside.
The analysis also demonstrates that removal of major optical opacity sources (TiO/VO) in the modeling does not reproduce the unexplained increase in phase offset towards short wavelengths, further eliminating a simple chemical opacity hole as an explanation for the observed spectroscopic behavior.
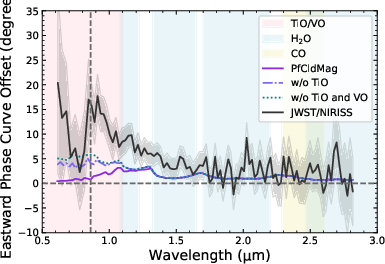
Figure 8: Removing TiO/VO from a strongly-dragged GCM increases the predicted phase offset at blue wavelengths, but not to the level required by the data.
Outstanding Puzzles and Implications
A robust numerical result of the study is that all GCMs overpredict the absolute emission by 12–17%, even after controlling for radius normalization and geometric bandpass effects. Conversely, empirical analysis of the energy budget from the NIRISS phase curve itself implies a Bond albedo (τdrag≲1046) and geometric albedo (τdrag≲1047) that are high relative to current theoretical expectations for clear, solar metallicity UHJs, with τdrag≲1048 ratios suggesting a dayside reflective cloud population not present in the models. This tension is unresolved and represents a significant challenge for atmospheric modeling frameworks.
The diagnosis that only strong atmospheric drag (MHD or short Rayleigh timescales) and thick nightside clouds and/or Hτdrag≲1049 recombination can explain the observed spectral and photometric morphology is robust. The unexplained trend of increasing eastward offset at 10501.4 μm wavelengths is not matched by state-of-the-art GCMs even when adjusting opacities or cloud prescriptions.
Conclusion
This study establishes that the primary controls on the spectrally and spatially resolved phase curve of WASP-121b are (i) the magnitude and vertical distribution of atmospheric drag, (ii) nightside cloud condensation, and (iii) the treatment of radiative transfer. Robust results are:
- Strong atmospheric drag is required to match the small phase curve offset and longitudinal symmetry. Drag must reduce recirculation and suppress hot-spot shifting to within 105110° of the substellar point.
- Nightside clouds (or the combined impact of H1052 recombination and strong drag) are necessary to mute nightside spectral features and to suppress emission.
- All GCMs overpredict planetary emission relative to JWST data, indirectly implying higher albedos or missing opacity sources; the findings confirm existing tensions in the theoretical modeling of UHJ energy budgets.
- No model matches the observed blueward rise in phase curve offset, indicating missing physical processes or systematic issues in the data at short wavelengths.
The results indicate a requirement for more sophisticated drag, cloud, and potentially magnetic coupling prescriptions in GCMs, and call for refined approaches to geometric/photometric normalization of simulated and observed spectra. For atmospheric characterization of nontransiting and transiting UHJs, combining 3D GCMs with broad-wavelength, time-resolved data sets continues to be critical, but increasingly reveals the limits of current physical assumptions. Future development directions should focus on improved microphysical cloud modeling, comprehensive treatment of radiative transfer, and the integration of observed, wavelength-dependent radius effects into emission models.