- The paper introduces a causal framework that quantifies human-induced effects on high-temperature extremes using a latent Gaussian spatial model.
- It employs a bivariate generalized extreme value model with spatially-varying parameters to detect regional disparities in anthropogenic impact across the US.
- The study provides actionable hotspot detection and validates its Bayesian inference approach with robust convergence metrics and spatial trend analysis.
Estimating Causal Attribution of Anthropogenic Forcing on High-Temperature Extremes Using a Latent Gaussian Spatial Model
Overview
The paper "Estimating Causal Attribution of Anthropogenic Forcing on High-Temperature Extremes Using a Latent Gaussian Spatial Model" (2604.23438) addresses the quantification of anthropogenic (human-induced) contributions to high-temperature extremes using a principled causal inference framework. The study focuses on gridded annual temperature maxima from the IPSL-CM6A model (CMIP6), adopting a potential outcome approach for causal attribution, and employs a bivariate generalized extreme value (GEV) modeling strategy. Spatially-varying parameters are estimated using a latent Gaussian model (LGM) with a multivariate intrinsic conditional autoregressive (MICAR) prior, and inference is conducted through the Max-and-Smooth approximate Bayesian method. The analysis provides spatially-resolved causal effect estimates, associated trends, and hotspot regions of significant anthropogenic impact across the mainland United States.
Exploratory and Latent Structure Analysis
A curated dataset from the French global climate model IPSL-CM6A (CMIP6) consists of daily temperature series aggregated to annual temperature maxima for 250 1∘×1∘ grid cells spanning 1850–2014. Each grid-year pair yields a bivariate vector: factual (anthropogenic and natural forcing) vs. counterfactual (natural forcing only). Exploratory modeling identifies spatial dependence and covariate structure (longitude, latitude, mean elevation, open sea distance).
Joint modeling of the seven latent spatial parameters using MICAR captures both spatial correlation and cross-component dependence. Residual correlation and spatial variogram analysis (Figure 1) demonstrate the necessity of cross-component covariance modeling and spatially-structured priors.
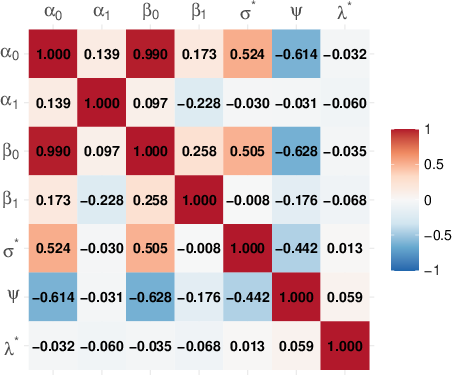
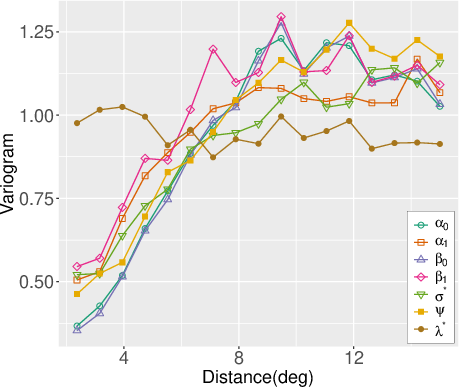
Figure 1: Sample correlation matrix of latent parameter residuals (left) and spatial variogram of residuals by parameter (right), demonstrating cross-component and spatial dependencies.
To regularize GEV parameters and improve inferential stability, especially for the shape parameter ξ, a novel monotonic transformation to ψ=f(ξ) is proposed. This transformation is tailored for temperature extremes—where empirical estimates cluster around negative values (e.g., −0.25)—and aligns prior density with physical and statistical plausibility. The prior for ψ is derived from an asymmetric shifted beta, advocating heavier prior mass in (−0.5,0).
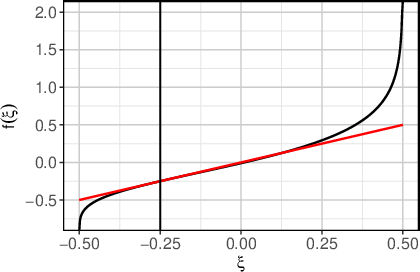
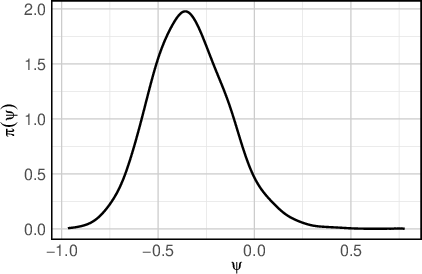
Figure 2: Shape parameter transformation curve ψ=f(ξ) (left), and the induced prior density for ψ (right).
Causal Framework and Hierarchical Bayesian Model
Anthropogenic forcing is conceptualized as a binary treatment with two potential outcomes (factual/counterfactual), modeled through nonsationary GEV marginals in a bivariate Hüsler-Reiss (BHR) structure. The causal effect is defined as the difference in return levels (pRTE) between worlds, averaged over time.
The Bayesian hierarchical model consists of:
- Observation Layer: Bivariate BHR with spatially-varying parameters.
- Latent Layer: MICAR on transformed latent parameters, incorporating spatial adjacency and covariates.
- Prior Layer: Weakly-informative priors (MVN, inverse-Wishart) for coefficients and covariance.
Bayesian Inference and Computational Approach
Approximate Bayesian inference is carried out using the Max-and-Smooth method, which leverages Laplace approximation for the (generally non-Gaussian) likelihood and conjugacy for efficient sampling. Gibbs sampling is employed, and model structure exploits sparsity for computational efficiency.
Convergence metrics (Gelman-Rubin, Geweke, Effective Sample Size) validate the MCMC procedure and confirm robust hyperparameter estimation.
Strong Numerical Results and Spatial Attribution
Posterior inference yields spatially-resolved estimates of the causal effect (δ), its uncertainty, and trends:
- Posterior mean causal effect: Most of the U.S. shows positive attribution, with regional maxima in the Northeast, South Atlantic, and East South Central divisions (mean δ between 0.2–0.5).
- Contradictory regional claim: In the Midwest’s West North Central division (e.g., North/South Dakota, Nebraska, Iowa, Montana), mean ξ0 is negative—even as the rest of the domain records positive attribution. This aligns with the finding that natural forcing dominates extreme temperature occurrence here, likely due to sparse population and distinct land use.
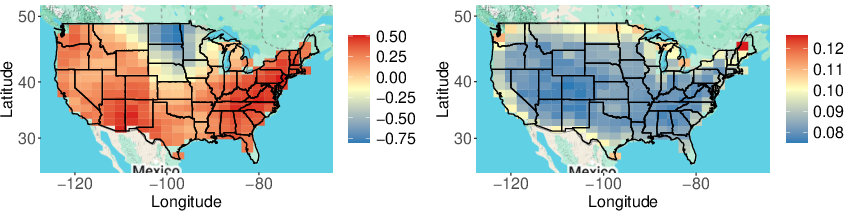
Figure 3: Grid cell-wise posterior means (left) and posterior standard deviations (right) of the causal effect across mainland United States.
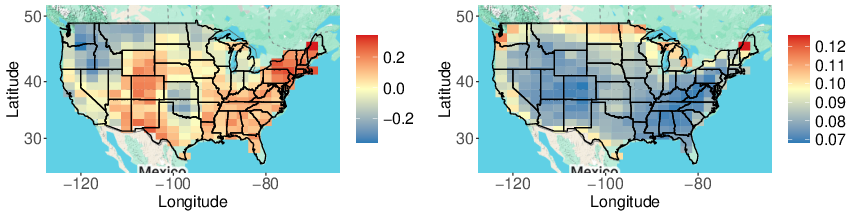
Figure 4: Grid cell-wise posterior means (left) and posterior standard deviations (right) of causal effect during the pre-industrial period.
Temporal trend analysis further disaggregates factual vs. counterfactual worlds. In the factual world, most regions show increasing high-temperature extremes except the Midwest, where the trend is negative; anthropogenic forcing amplifies the positive trend elsewhere.
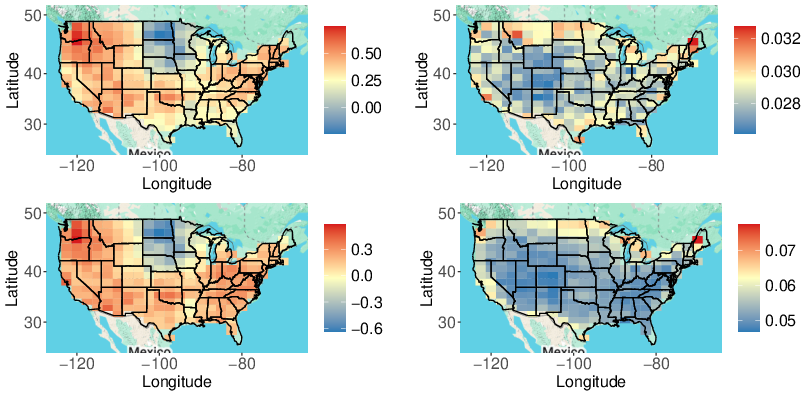
Figure 5: Spatial trend (posterior mean/top-left and SD/top-right) for the factual world; difference in trend between factual and counterfactual (mean/bottom-left and SD/bottom-right).
Hotspot Detection
Bayesian credible region estimation for hotspot identification follows the joint exceedance approach of French and Hoeting (2016), controlling for family-wise error. With a high threshold (ξ1), identified hotspot grids concentrate in the Northeast and select South Atlantic domains, covering only 9.6% of the total area; at lower threshold (ξ2), 66% of the domain is implicated.
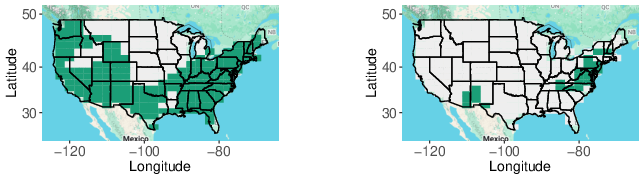
Figure 6: Estimated ξ3 credible regions for joint exceedance—hotspots at ξ4 (left) and ξ5 (right).
Practical and Theoretical Implications
This study offers a rigorous causal metric for attribution in climate extremes, combining potential outcome theory with spatial extreme value modeling in a Bayesian hierarchical paradigm. The approach ensures proper uncertainty quantification, spatial smoothing, and covariate-driven inference, thus improving policy relevance and scientific interpretability.
- Contradictory regional effects: Negative causal attribution over the Midwest suggests location-specific dominance of natural over anthropogenic factors, warranting further geophysical investigation.
- Hotspot targeting: The ability to detect high-confidence regions of anthropogenic impact provides actionable intelligence for policy design—critical for adaptation and mitigation.
- Methodological generalization: The LGM-MICAR-Max-and-Smooth framework is extensible to other geophysical extremes, offering superior computational speed and robust spatial inference.
Outlook and Future Directions
While the methodology is tailored for return-level estimation, limitations remain regarding spatial dependence in the data layer (max-stable modeling may offer improvements) and suitability under sparse temporal sampling. The recent advances in intrinsic Whittle-Matérn fields [bolin2025intrinsic] and excursion set-based metrics [cotsakis2026assessing] present avenues for enhanced modeling and hotspot quantification. More granular spatial resolution and alternative extreme value approaches could further refine attribution accuracy.
Conclusion
A comprehensive Bayesian causal attribution framework is developed and empirically validated on gridded climate model outputs for the mainland United States. Anthropogenic forcing is shown to significantly amplify high-temperature extremes in populous regions, while certain Midwest regions exhibit countervailing natural influences. The hierarchical spatial modeling, parameter transformation, and computational advances collectively support robust uncertainty quantification and targeted hotspot detection, catalyzing future advances in climate extreme attribution.