- The paper introduces GFlowState, an interactive tool that visualizes the training dynamics of GFlowNets using synchronized views to analyze trajectory structures and reward distributions.
- The paper's methodology leverages sample ranking, state projection, DAG visualization, and transition heatmaps to diagnose model behaviors such as mode collapse and policy shifts.
- The paper demonstrates the platform's utility in diverse settings, including grid environments and crystal structure generation, to improve interpretability and debugging.
GFlowState: An Interactive System for Visualizing Generative Flow Network Training
Introduction
The paper introduces GFlowState, an interactive visual analytics platform specifically designed for interpreting and diagnosing the training dynamics of Generative Flow Networks (GFlowNets, GFNs). GFlowNets are an emerging family of probabilistic generative models that sample objects proportionally to a reward function, with applications in high-stakes domains such as molecule discovery and material design. While GFlowNets enable diverse, high-reward candidate generation, their training behavior, especially regarding sample space exploration and policy evolution, is not readily interpretable via standard ML monitoring tools. GFlowState addresses the gap by providing dedicated visualizations and interaction mechanisms to expose structural, behavioral, and temporal dynamics during GFlowNet training.
Background on GFlowNets
GFlowNets model generative processes as sequential decision problems represented by Markov Decision Processes (MDPs), where states are constructed incrementally by a forward policy and terminated with a ‘stop’ action, resulting in a DAG of possible state trajectories. The essential property is “flow consistency”—if incoming and outgoing flows at each node are balanced, the network samples final objects in proportion to their reward [bengio2021flow, (2604.21830)]. This supports modes of exploration and sample diversity not readily produced by RL or MCMC approaches. Training is typically performed by parameterizing the policy as a neural network and optimizing flow constraints.
A canonical example is a 2D grid environment with reward modes at the corners. The agent starts at (0,0) and moves across the grid, choosing when to terminate. The diverse set of trajectories to high-reward corners exemplifies the exploration capabilities of GFlowNets.
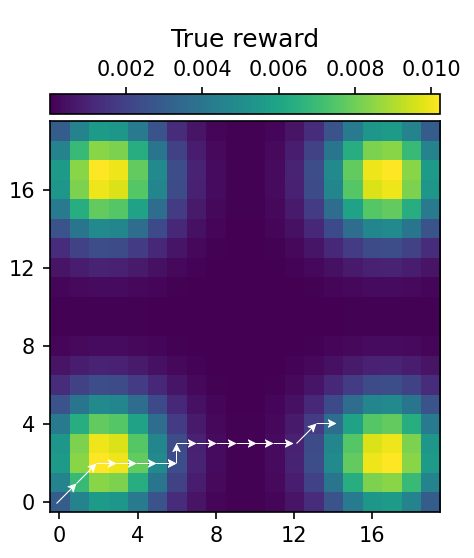
Figure 1: Grid environment reward structure with sample trajectory; high-reward regions are located at the grid's corners.
Analytical Needs and Existing Gaps
Interpretability during GFlowNet training is impeded by three factors: (1) large and complex sample spaces, (2) nontrivial trajectory architectures forming large DAGs, and (3) shifting sampling policies not captured by aggregate loss metrics. Conventional tools (e.g., TensorBoard, WandB) are limited to global metric monitoring and do not support granular investigation of sampling proportionality, coverage, or trajectory structure. Tools from RL and other generative paradigms are ill-suited, as their visualizations and granularities do not directly transfer to GFlowNets.
Recognizing these limitations, GFlowState was designed in collaboration with GFlowNet developers at Mila, targeting (i) trajectory analysis, (ii) sample space and policy proportionality analysis, and (iii) training dynamics tracking. This closes the methodological gap, enabling interactive, model-specific investigations that aggregate-based tools cannot provide.
Architecture and Visualization Modules
GFlowState’s design is anchored in four main synchronized views, providing orthogonal perspectives on GFlowNet training progress.
- Sample Ranking: Implements a bump chart over iterations, ranking generated objects by metrics such as reward or loss. This exposes the discovery of new modes, mode collapse, and policy convergence/divergence phenomena.
- State Projection: Uses customizable or environment-specific feature extracts and dimensionality reduction for 2D visualization of the sample and validation set. Hexbin aggregates or scatterplots support differentiation by metrics (e.g., reward, loss, proportionality, sample frequency) and enable outlier and coverage analyses.
- DAG View: Builds an interactive, incrementally expandable, pre-aggregated visualization of the trajectory DAG constructed from logged sample paths. Provides mechanisms for navigating subgraphs and examining linear chains, merged transitions, and detailed path statistics.
- Transition Heatmap: Ranks transition edges (actions) by dynamic metrics (frequency, probability, variance) and visualizes their temporal evolution over training epochs, supporting efficient analysis of shifting policies, exploration dynamics, and potential failure points.
These views are interactively linked: selections in one update highlights in the others, enabling coordinated multi-perspective investigations.
Implementation and Integration
GFlowState is implemented in Python using Plotly Dash, with SQL-backed logging of samples and trajectories for performance and scalability. Environment integration is achieved by requiring user-defined serialization, feature extraction, and visualization routines for states. This enables application to both discrete (e.g., grid) and discretized continuous (e.g., crystal structure) environments. The codebase and documentation are publicly available.
Empirical Demonstration: Case Studies
Grid Environment
Applying GFlowState to the grid environment revealed characteristic GFlowNet training phenomena. Sample Ranking immediately highlighted the discovery of new reward modes as dramatic rank shifts, with periods of flat lines indicative of mode collapse. State Projection revealed the sequence in which regions are explored, uncovering low-loss and high-loss areas. Transition Heatmap and DAG View collectively visualized the emergence and then attenuation of transitions as new high-reward regions were discovered, confirming the model's trajectory away from local exploitation toward better global reward coverage.
Crystal Structure Generation
In a practical setting, GFlowState was evaluated on a materials discovery task—GFN-based crystal structure generation (restricting composition, space group, and lattice parameters). The Sample Ranking view exposed early and persistent dominance by a few high-reward structures, while State Projection highlighted sample space coverage and the gradual alignment of the training distribution with the validation set. The DAG View supported in-depth analysis of complex sub-trajectories, crucial for domain experts to diagnose plausible and implausible candidate generation, and to study interdependencies, such as how space group selections constrain subsequent compositional choices.
Implications, Limitations, and Future Directions
GFlowState’s contributions lie primarily in rendering the implicit, latent training dynamics of GFlowNets analyzable. By exposing local policy proportionality, overlooked sample space regions, and trajectory structures, it accelerates debugging, diagnosis of failure patterns (e.g., mode collapse, insufficient exploration), and design iteration. Domain experts benefit from the alignment of interpretability tools with their task ontologies (e.g., molecular substructure visualizations). The platform is agnostic to specific GFlowNet variants and flexible to diverse environments.
However, some limitations remain. For continuous and high-dimensional environments, discretization granularity must be decided a priori, complicating post hoc analysis; future work could implement adjustable discretization and streaming support. Clustering and advanced summarization in DAG and ranking views remain areas for extension. Estimation of proportionality metrics from limited samples is challenging in large spaces and may benefit from improved importance sampling and checkpointing strategies.
Conclusion
GFlowState establishes a dedicated, interactive visual analytics paradigm for GFlowNet training, complementing the surge of research on GFlowNet algorithms and applications by providing researchers with comprehensive interpretability and debugging facilities. Its deployment in both didactic and real-world scientific discovery contexts demonstrates its practical value. Going forward, the integration of such model-specific analytic tools will be critical as generative modeling frameworks become increasingly central to computational scientific pipelines.
References
For the complete implementation and additional materials, see the GFlowState repository at [https://github.com/florianholeczek/GFlowNet_Training_Vis_Pilot].
Reference arXiv ID: (2604.21830)