- The paper establishes that anger consistently maps to red in over 75% of responses, confirming a robust color-emotion association.
- It leverages animation speed and size metrics to correlate visual parameters with arousal and dominance, offering actionable insights for affective interfaces.
- The study highlights the need for adaptable designs as many emotion-visual mappings remain ambiguous and context-dependent across demographics.
Introduction
The visualization of emotional states in information systems is vital for closing the affective loop in human-computer interaction. This work systematically examines how discrete and dimensional emotion models can be mapped to visual parameters such as color, size, speed, shape, and animation type based on user preferences. Leveraging responses from 419 participants, this study seeks to operationalize typical mappings for emotion visualization, providing empirical evidence for universality and sources of ambiguity in mapping affective states to visuals.
Methodological Overview
The experimental setup used an interactive online questionnaire where participants configured graphical animations to express selected emotional states. Drawing emotion labels from Izard’s model and relying on a curated yet diverse palette (Figure 1), the study examined preferences for color, animation shape, speed, and size, then assessed mapping to the VAD model. Animation primitives (simple shapes with configurable parameters) were intentionally basic to ensure application-agnostic insights (Figure 2).
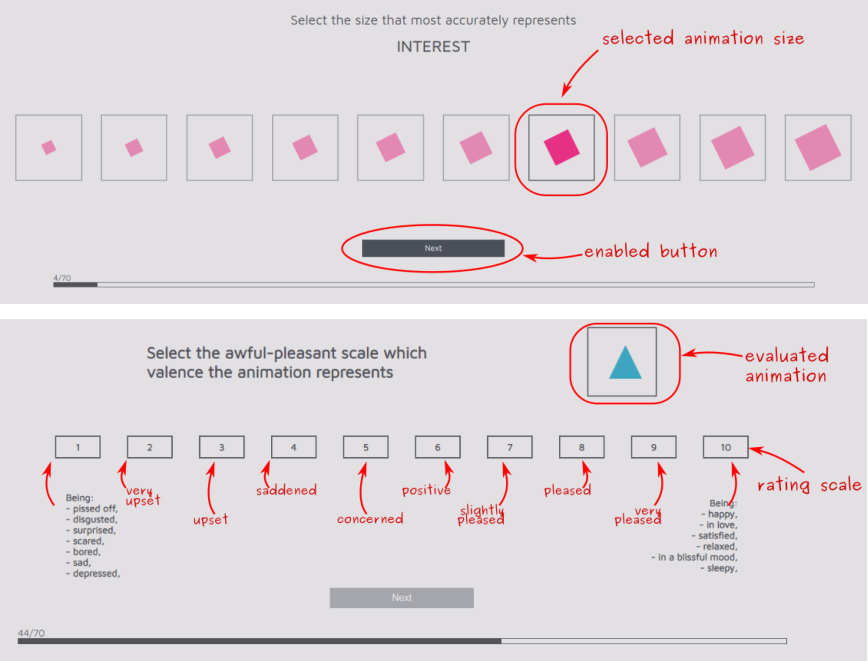
Figure 3: Example interfaces for defining animation parameters and specifying values in the VAD model.

Figure 1: The discrete color set provided to participants, designed for maximal perceptual difference.
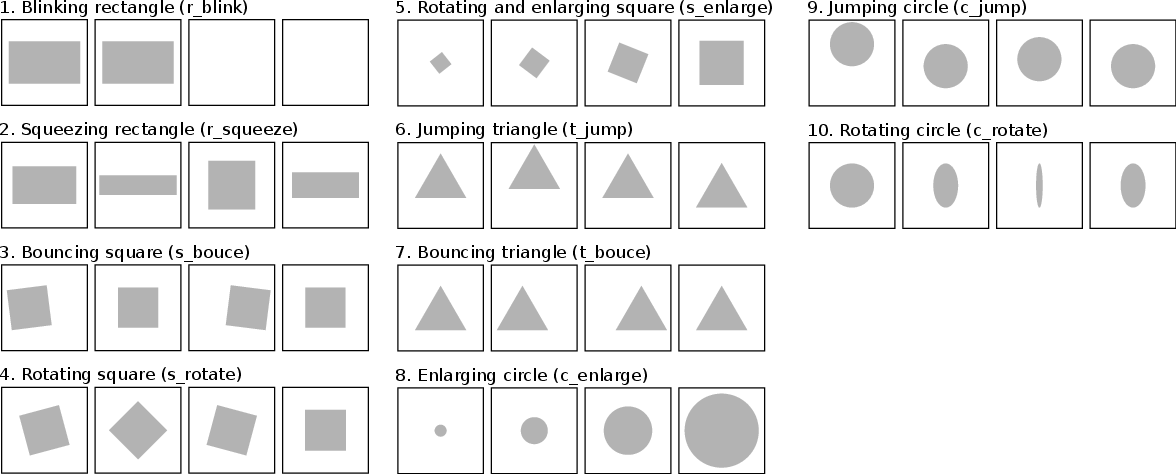
Figure 2: The selected animation primitives facilitating parameterization across affective states.
Results: Color, Size, Speed, and Animation Mappings
Color–Emotion Associations
The survey demonstrates that only anger is unambiguously represented—over 75% of respondents chose red, highlighting its cross-domain universality in discrete emotion models. Shyness is somewhat dominantly mapped to gray, while other emotions are mapped to clusters of similar colors rather than singular choices.
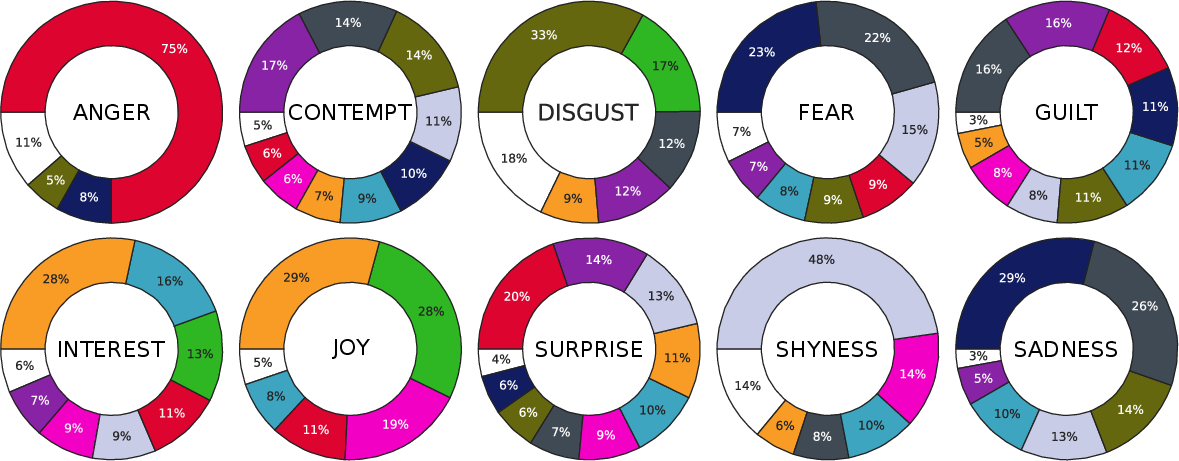
Figure 4: Percentage of color indications for each emotion (zeroing minor signals under 5%).
Disgust aggregates around khaki, green, and steel (lowered chroma, lower value in HSV), while sadness and fear group around desaturated colors such as navy, steel, and gray. Positive emotions like joy and interest are predominately visualized in orange (and, for joy, green and pink also achieve higher selection).
In VAD space, red maps specifically to low valence, high arousal, and high dominance—consistent with a canonical anger representation. Grayscale shades (steel, gray) are identified for lower arousal and dominance, while orange aligns with high valence. The results underscore the lack of one-to-one color-affect mapping except in a small subset of cases; for most, ambiguity persists.
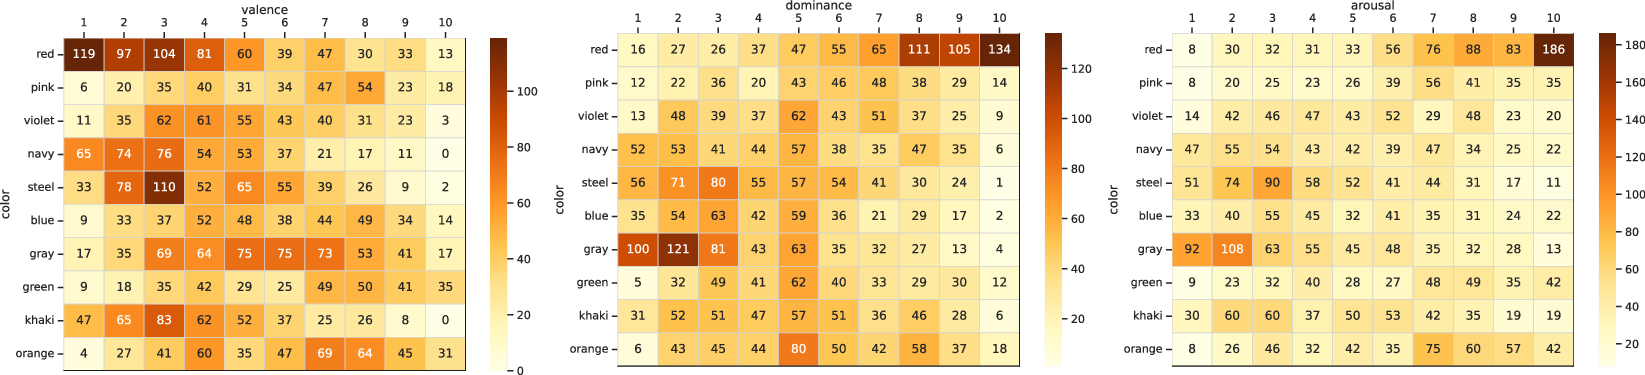
Figure 5: Correspondence of colors with VAD dimensional values.
Size and Speed Parameterization
Statistical analysis reveals clear trends for size and speed:
- Anger and joy elicit consistently large, high-speed animations, indicating intensity and activation level.
- Shyness yields small, slow animations, marking subdued affect.
- Sadness corresponds with low-speed, medium-small animations.
- Other emotions (e.g., contempt, guilt, disgust, interest, surprise, fear) are mapped to intermediate size and speed, with substantial inter-subject variance.
Kernel distribution estimation visualizations reflect strong clustering for these mappings.
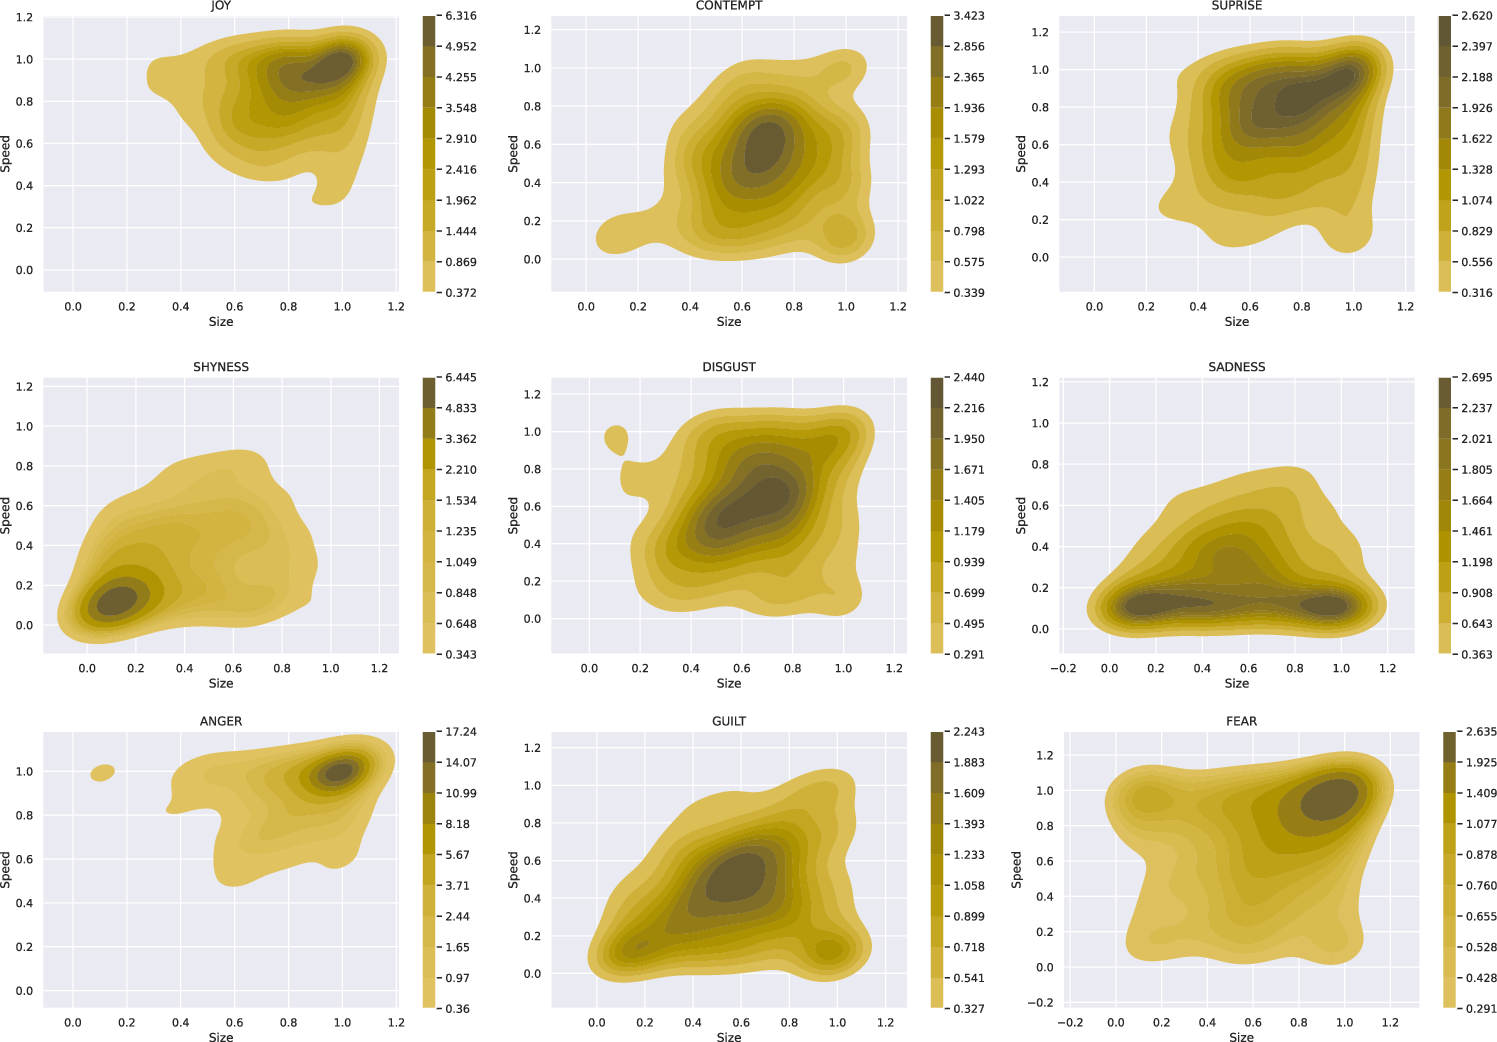
Figure 6: Distribution of animation speed and size across discrete labels.
Spearman correlation coefficients indicate that animation speed, not size, is substantially associated with arousal (0.61) and, to a lesser extent, dominance (0.44); there is negligible correlation with valence. Size shows moderate relationships with arousal (0.31) and dominance (0.33) consistent with the standard affective space but never exceeds the explanatory power of speed.
Animation Shape/Type and Affect
No strong, universal correspondences emerge between specific animation types and emotions. However, some moderate patterns are detectable:
- "Blinking rectangle" aligns most with surprise (28.5%)
- "Bouncing triangle" with disgust (22.3%)
- "Squeezing rectangle" with anger (21.1%)
- "Jumping circle" with joy (21.9%)
These associations are neither exclusive nor universal, and for several emotions, no prevailing animation form emerges.
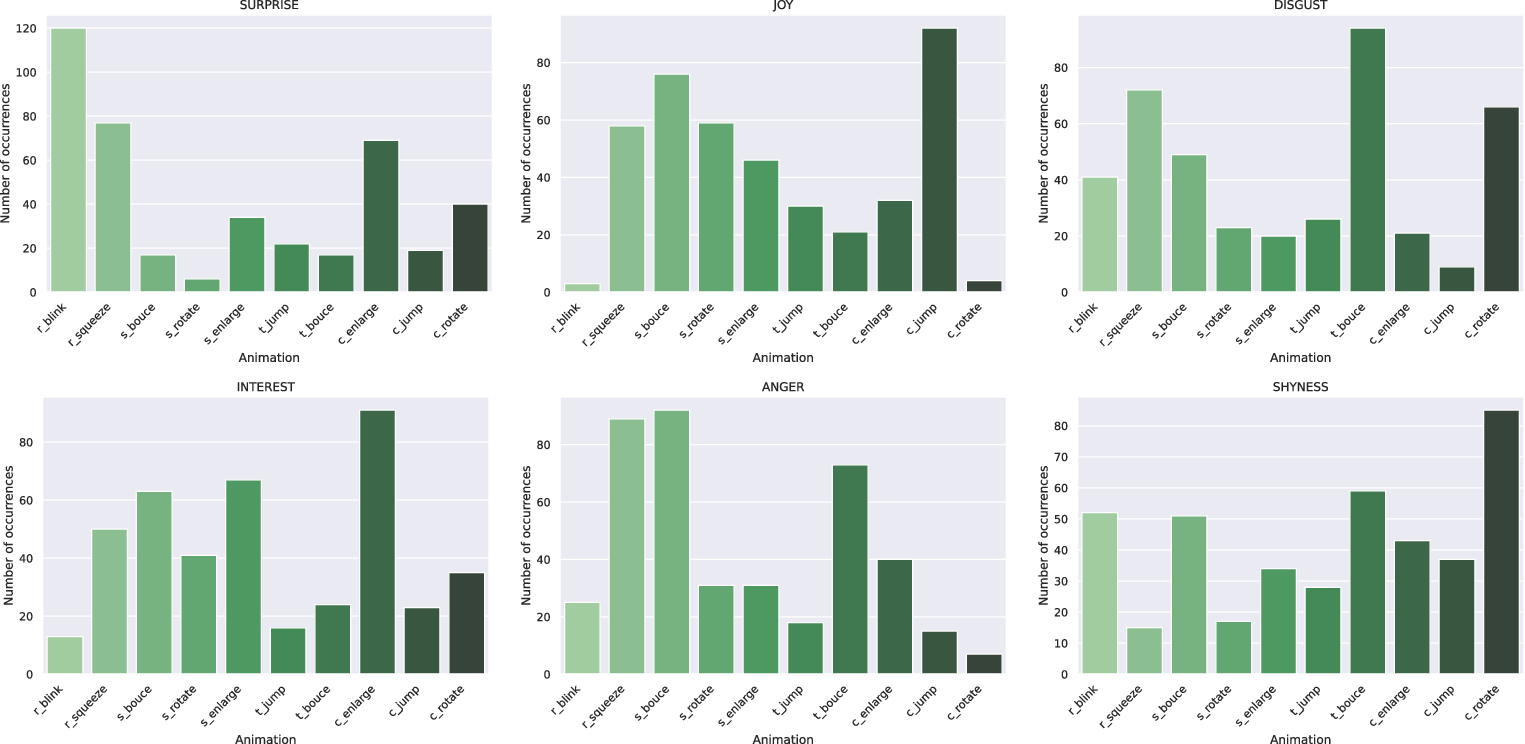
Figure 7: Modal animation types for six selected emotion labels.
In the VAD context, only weak and non-exclusive patterns are observed relating animation type to dimensional positions.
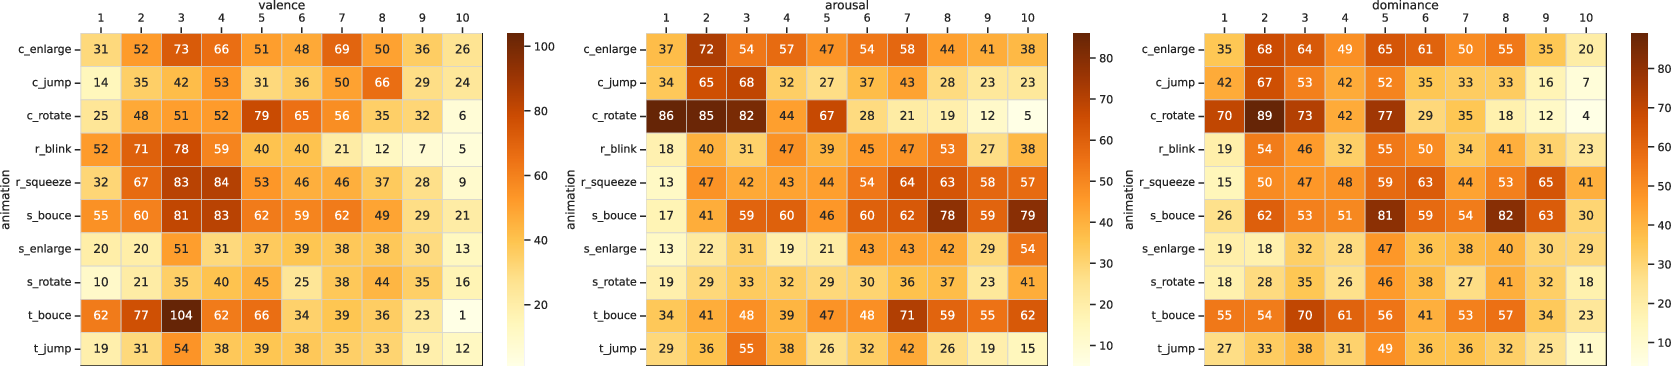
Figure 8: Mapping of animation type prevalence to VAD dimension space.
Universality Across Demographics
Chi-square analyses for gender and age indicate that several color-emotion pairings (blue, dark blue, gray, khaki, orange, red, violet) and most speed/size–emotion mappings are statistically robust across subgroups, supporting their relative universality. However, for some emotional states, demographic effects persist, limiting universal generalizability.
Discussion
While some associations (e.g., red for anger, orange for positive affect, slow/small for shyness) exhibit a high degree of cross-population stability, universal mappings applicable in all contexts remain elusive. Many color–emotion and animation mappings are contextually fluid or ambiguous; for example, sadness and fear are widely associated with various shades of gray and blue, but not singularly. Disgust clusters but does not converge to a single color.
The study clarifies sources of contradiction in previous literature, demonstrating that ambiguity, not misinterpretation, drives disparity in emotion–visual mappings and that only a subset of associations are canonical. These findings advise designers of affective information systems to leverage robust mappings for reliable states (notably anger and some positive/negative valence clusters) and to treat others as customizable or context-dependent, potentially integrating personalization or adaptive interfaces.
Implications and Future Directions
The results have implications for the standardization of affective interfaces, emotion annotation protocols, and affective HCI design. Practically, the findings discourage reliance on a strictly universal palette and instead encourage modular or contextually adaptive designs for emotion communication. Theoretically, the results highlight the inherent complexity in mapping human affect to visual parameters and raise questions about the limits of universality in affective computing.
The study advocates for expanded research into additional visual features, further segmentation of emotion taxonomies, and the examination of interface-specific and cultural effects. The development of adaptive or user-personalized emotional displays, along with more ecologically valid and task-based studies, represents a promising future direction.
Conclusion
The mapping of emotion to visual representation in information systems exhibits zones of consensus (notably for anger in red, positive affect in orange, and intensity in animation dynamics) and vast regions of ambiguity or demographic specificity. Only select mappings can be considered robust and applicable for universal design; the broader problem requires nuanced, context-aware, and possibly adaptive techniques. Caution should be exercised in exposing internal emotional states, with ethical considerations at the forefront of affective technology deployment.

