- The paper presents a deterministic framework that segments historical ride data into regimes, achieving up to 31.1% reduction in mean wait times.
- It employs a six-metric similarity ensemble and LP-based repositioning to align historical demand profiles with current conditions for optimal fleet allocation.
- Empirical results confirm cross-city generalization, improved fairness, and robust performance with significant effect sizes and theoretical guarantees.
Regime-Calibrated Demand Priors for Ride-Hailing Fleet Dispatch and Repositioning
Introduction and Motivation
Accurately anticipating spatiotemporal demand fluctuations is central to urban ride-hailing fleet efficiency, directly affecting wait times and utilization. Existing operational paradigms often attempt to learn demand via stationary assumptions or via black-box machine learning forecasters, the latter imposing ongoing retraining and feature engineering burdens, and typically exhibiting regime-change lag. The examined paper introduces a deterministic, explainable framework based on segmenting historical data into demand regimes, matching current operational context to historical analogues using a six-metric similarity ensemble, and leveraging the resulting calibrated demand prior for both anticipatory LP-based repositioning and batch-dispatch.
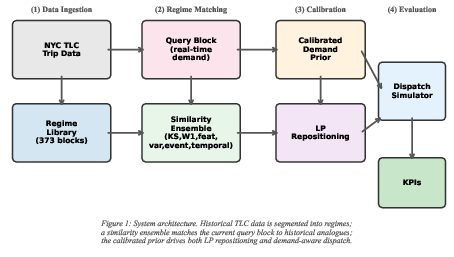
Figure 1: System architecture. Historical TLC data is segmented into demand regimes; a six-metric similarity ensemble matches the current query block to historical analogues; the calibrated prior drives both LP repositioning and demand-aware dispatch.
Methodology
Regime Segmentation and Demand Prior Construction
Historical NYC TLC trip data is partitioned into temporally coherent blocks (4-hour windows) that serve as demand regimes, each storing granular temporal (5-minute bin demand counts), summary statistics, spatial origin-destination pools, and surge event features. These become the foundational library for all downstream matching.
A live query (the initial demand profile of the current period, or the most recent history) is matched against this library using an ensemble similarity metric, combining Kolmogorov–Smirnov, Wasserstein-1, feature-space Euclidean distance, variance-ratio, event-pattern, and temporal-proximity metrics. The weighted top-k matches synthesize a calibrated prior, aggregating both rate and OD distributions and aligning historical volume to present block observation to mitigate systematic bias.
Optimization for Repositioning and Dispatch
The regime-calibrated prior is used to formulate a min-cost transportation LP, dictating anticipated repositioning actions for the idle fleet. The LP considers surplus and deficit across spatial H3 zones, subject to move-budget and supply/demand constraints, and prioritizes coverage over minimal repositioning cost by objective scaling. The batch dispatch step operates via the Hungarian algorithm to minimize assignment cost within each fixed time window, ensuring within-batch optimal assignments in terms of pickup time given spatial driver/request distributions.
Empirical Results
Main Efficacy Results
Evaluation over 5.2M NYC TLC trips across eight heterogeneous temporal scenarios demonstrates mean wait reduction of 31.1% (bootstrap 95% CI: [26.5%, 36.6%]) relative to batch matching without calibration. These results persist across all seeds and scenarios with Cohen’s d ranging from 5.5 to 29.9, indicating effect sizes well beyond conventional thresholds for practical significance.
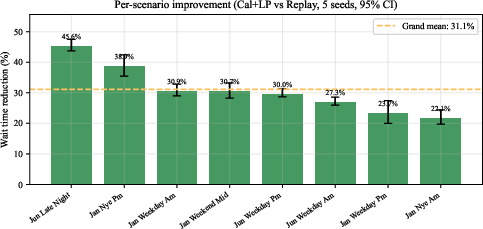
Figure 2: Per-scenario wait reduction with 95% confidence intervals. All 8 scenarios show substantial improvement, with the largest gains on volatile demand periods (Friday night, New Year's).
Decomposition and Calibration Analysis
The two-stage design’s contributions are independently validated: calibration alone yields a 16.9% mean wait reduction, while LP-based repositioning adds another 15.5%, and the combination composes multiplicatively. Tail (P95) wait improvements are stronger than the mean at 37.6%, and wait distribution equity improves as measured by the Gini coefficient.
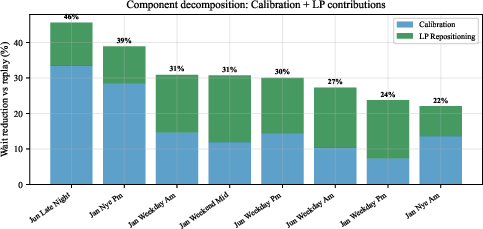
Figure 3: Component decomposition: calibration and LP repositioning contribute additively to wait reduction. Bars show mean wait time; error bars show standard deviation across seeds.
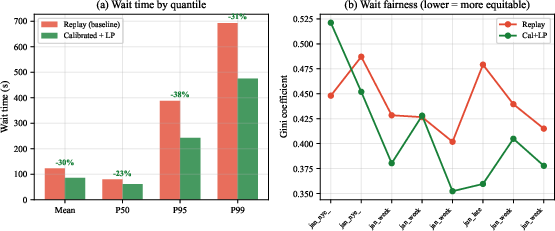
Figure 4: Tail and fairness analysis. Left: CDF of wait times showing Cal+LP (solid) vs Replay (dashed). Right: Gini coefficient across scenarios—lower values indicate more equitable service.
Cross-City Transfer and Robustness
Without retraining, the NYC-calibrated regime library provides 23.3% mean wait reduction on Chicago TNP data, indicating regime-based calibration encapsulates substantial cross-geography demand structure. Sensitivity analysis shows the improvement persists for fleet scaling in the 0.5--2× range, with calibration dominating in scarcity (when minimal repositioning is feasible). OSRM network-based travel time fidelity nullifies apparent gains if the fleet is under-provisioned but recovers them when effective capacity scaling is applied, providing an operational path for real-world deployment.
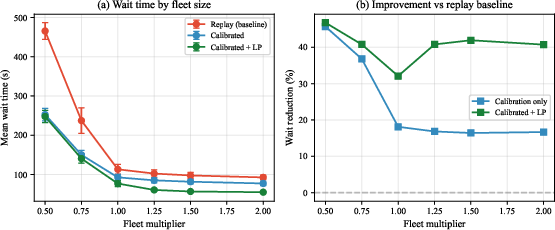
Figure 5: Fleet sensitivity: wait reduction is robust across fleet scales (0.5--2×). Calibration alone dominates at extreme scarcity; LP repositioning adds value when idle drivers are available.
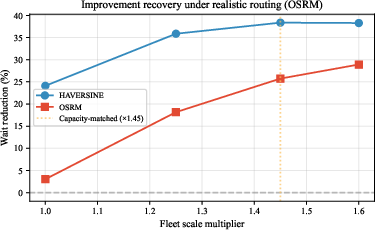
Figure 6: OSRM routing fidelity: improvement vanishes at 1× fleet due to under-provisioning. Scaling fleet by 1.45× (matching effective road-network capacity) recovers the gain.
Similarity Metric and Parameter Ablation
Ablations reveal that distributional metrics (KS, W1, feature, var) alone achieve 40.7% improvement—higher than the full six-metric ensemble’s 32.3%—indicating that the event and temporal features can sometimes introduce noise under specific test scenarios, though these retain utility for rare-event and edge-case generalization.
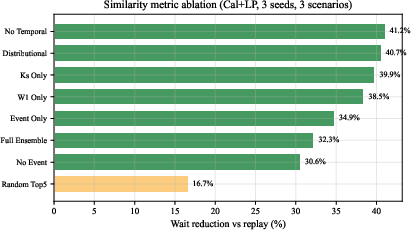
Figure 7: Similarity component ablation. Distributional-only metrics outperform the full ensemble, suggesting event and temporal components add noise in the tested scenarios.
The LP is most sensitive to move fraction (f=0.5) and relatively insensitive to lookahead beyond 5 minutes. Calibration quality is robust to the number of analogues (k); larger k smooths the demand forecast and generally improves results.
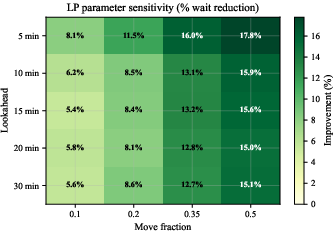
Figure 8: LP parameter sensitivity heatmap. Move fraction f=0.50 and lookahead =5\,min yield best performance. The LP is relatively insensitive to lookahead beyond 5\,min.
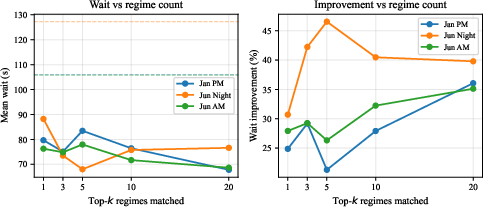
Figure 9: Top-k sensitivity: absolute wait (left) and relative improvement over replay (right) as a function of matched regimes. Dashed lines show replay baselines. Larger ×0 smooths the demand prior.
Batch window shrinkage improves absolute performance for both baseline and regime-calibrated approaches, but the relative gain from calibration is largely invariant to window parameterization.
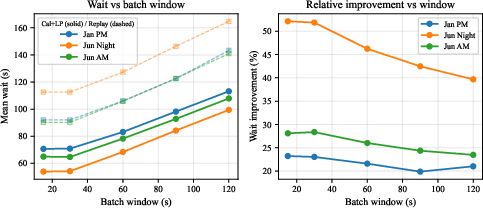
Figure 10: Batch window sensitivity: absolute wait (left) and relative improvement (right). Solid lines = Cal+LP; dashed = replay baseline. Both configurations benefit from shorter windows, but the relative improvement is stable at 28--36\%.
Theoretical Guarantees
The LP-based repositioning is proved to always be feasible, bounded, and polynomial-time solvable. The paper provides a formal result (Proposition: Calibration Error Bound via Chebyshev’s Inequality) showing that similarity-weighted calibration cannot yield higher mean squared error than uniform averaging and improves strictly if the similarity ranking encodes true demand proximity. Empirically, the similarity-to-true-demand error Spearman correlation was found to be ×1 (across all scenarios: ×2).
Statistical Protocol
The evaluation protocol includes per-scenario paired Wilcoxon signed-rank tests (with Bonferroni correction), Friedman test across all scenario/seed blocks, Nemenyi post-hoc comparisons, effect-size computations, and hierarchical bootstrap CIs. The extremely large effect sizes, minimal seed variance, and highly significant overall tests support the robustness of claims, despite some test-family limitations due to small sample size on per-scenario tests.
Limitations
Limitations include Manhattan-centric evaluation, reliance on Haversine as the primary route metric (with OSRM validation addressing this), fixed regime library windowing, absence of dynamic pricing or ride pooling, and hand-tuned similarity weights. The authors note that library expansion, dynamic tuning of weights, and inclusion of additional operational desiderata would be natural extensions.
Implications and Future Directions
This framework enables explainable and robust operational demand forecasting and resource allocation, sidestepping the recurrent difficulties of black-box ML demand forecasting. The cross-city generalization and theoretical guarantees invite further work in regime-based meta-learning and test-time adaptation, particularly for nonstationary and rare-event scenarios. Integration with dynamic pricing, pooling, and multi-agent RL architectures (with proper credit assignment and action-space factorization) remains open for future research.
Conclusion
The presented work establishes a deterministic, interpretable, and empirically validated pipeline for ride-hailing fleet optimization by regime-calibrated demand priors. The method consistently achieves large magnitude wait and fairness improvements across a suite of challenging operational scenarios, is robust to fleet and modeling parameterization, and generalizes across city domains. These findings underline the practical value of regime-based analogical generalization for real-world spatiotemporal resource allocation in mobility systems (2604.03883).