- The paper introduces a spectral framework that combines graph Laplacian eigenvector decomposition with cross-entropy optimization to balance global and local structures.
- The paper uses a progressive spectral subspace parameterization to incrementally reveal manifold structure and enhance embedding interpretability.
- The framework demonstrates improved manifold continuity and neighborhood preservation across synthetic, image, and single-cell datasets.
Spectral Framework for Multi-Scale Nonlinear Dimensionality Reduction
Introduction and Motivation
This work presents a novel spectral framework for nonlinear dimensionality reduction (DR) that systematically addresses the persistent global–local trade-off and lack of interpretability in existing methods. Conventional neighbor embedding algorithms such as t-SNE and UMAP are adept at preserving local neighborhoods but often distort global manifold geometry, while classical spectral methods like Laplacian Eigenmaps are more faithful to global structure at the cost of local detail. The proposed framework leverages spectral decomposition of the graph Laplacian to parameterize the embedding as a linear combination of graph Laplacian eigenvectors (graph frequencies), and integrates this with cross-entropy-based optimization in the style of UMAP. This unifies the strengths of both spectral and force-directed techniques, yielding multi-scale, interpretable embeddings with explicit control over the global–local structure trade-off.
Methodology
The central procedure begins by constructing a weighted k-nearest neighbor (kNN) graph from the high-dimensional data. The graph Laplacian is then decomposed spectrally, yielding an orthonormal basis ordered by frequency. Unlike direct optimization of embedding coordinates—a characteristic of UMAP—the positions in the low-dimensional space are parameterized as Y=USP, where US contains the first S Laplacian eigenvectors and P is a learned projection. Cross-entropy optimization is applied to P, not to Y directly, with S controlling the subspace bandwidth.
Critically, the embedding can be progressed over stages, incrementally enlarging S to reveal coarse-to-fine manifold structure. This spectral subspace parameterization transforms the global–local trade-off into a transparent, tunable property of the embedding process.
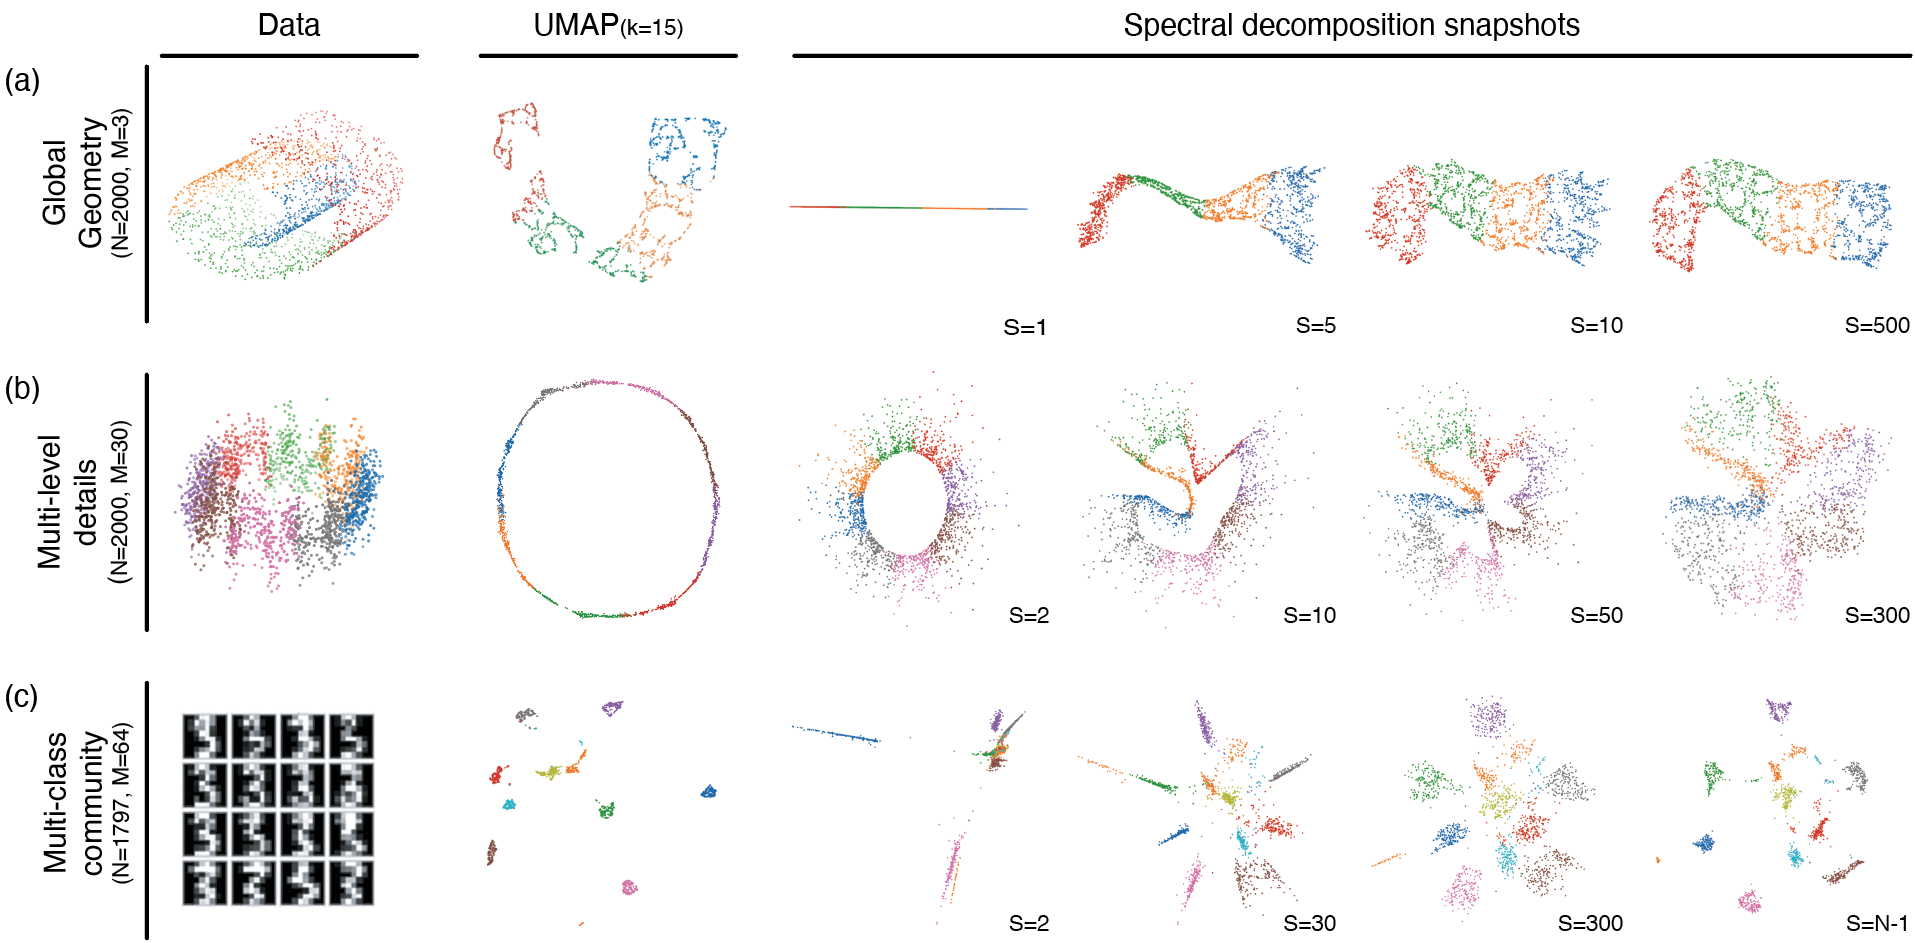
Figure 1: Comparison of data structure, UMAP, and spectral decomposition snapshots on several datasets; embeddings recapitulate global structure with low frequencies and add detail with increasing modes.
Quantitative and Qualitative Evaluation
The framework was tested on a diverse set of datasets, including synthetic manifolds (Swiss Roll, Multiscale Loop), benchmark images (MNIST, Fashion-MNIST), and high-dimensional single-cell RNA-seq data (C. elegans). Quantitative evaluation relied on measures of manifold continuity, neighborhood preservation, and global structure, such as DEMaP, Continuity, MRRE, and Spearman's ρ.
The results indicate strong preservation of manifold continuity and topology compared to UMAP, Laplacian Eigenmaps, and PHATE. Progressive expansion of the spectral subspace monotonically improves neighborhood preservation and global geometry metrics. Notably, the number of modes (Y=USP0) required to recover most of the embedding's structure depends heavily on the dataset's complexity, with smoother manifolds compressible in fewer modes.
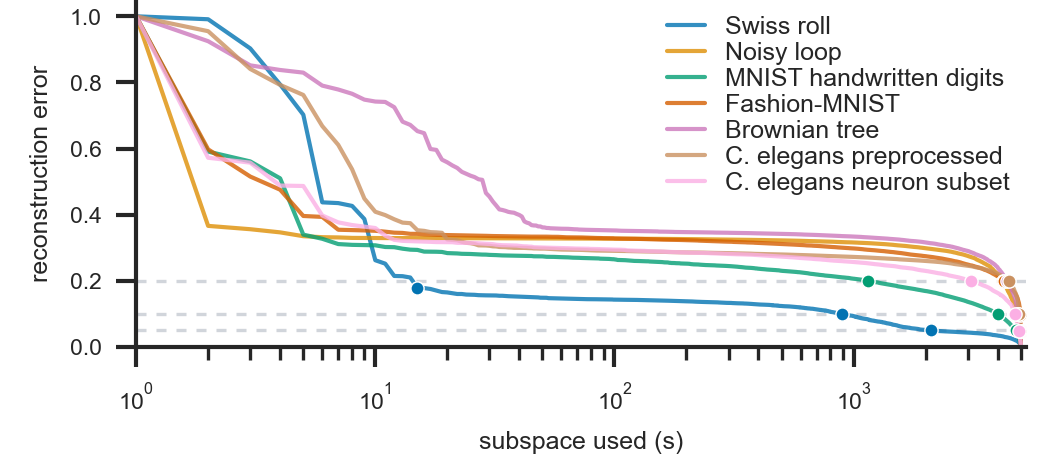
Figure 2: Reconstruction error declines with the inclusion of more spectral modes; datasets exhibit differing spectral complexity.
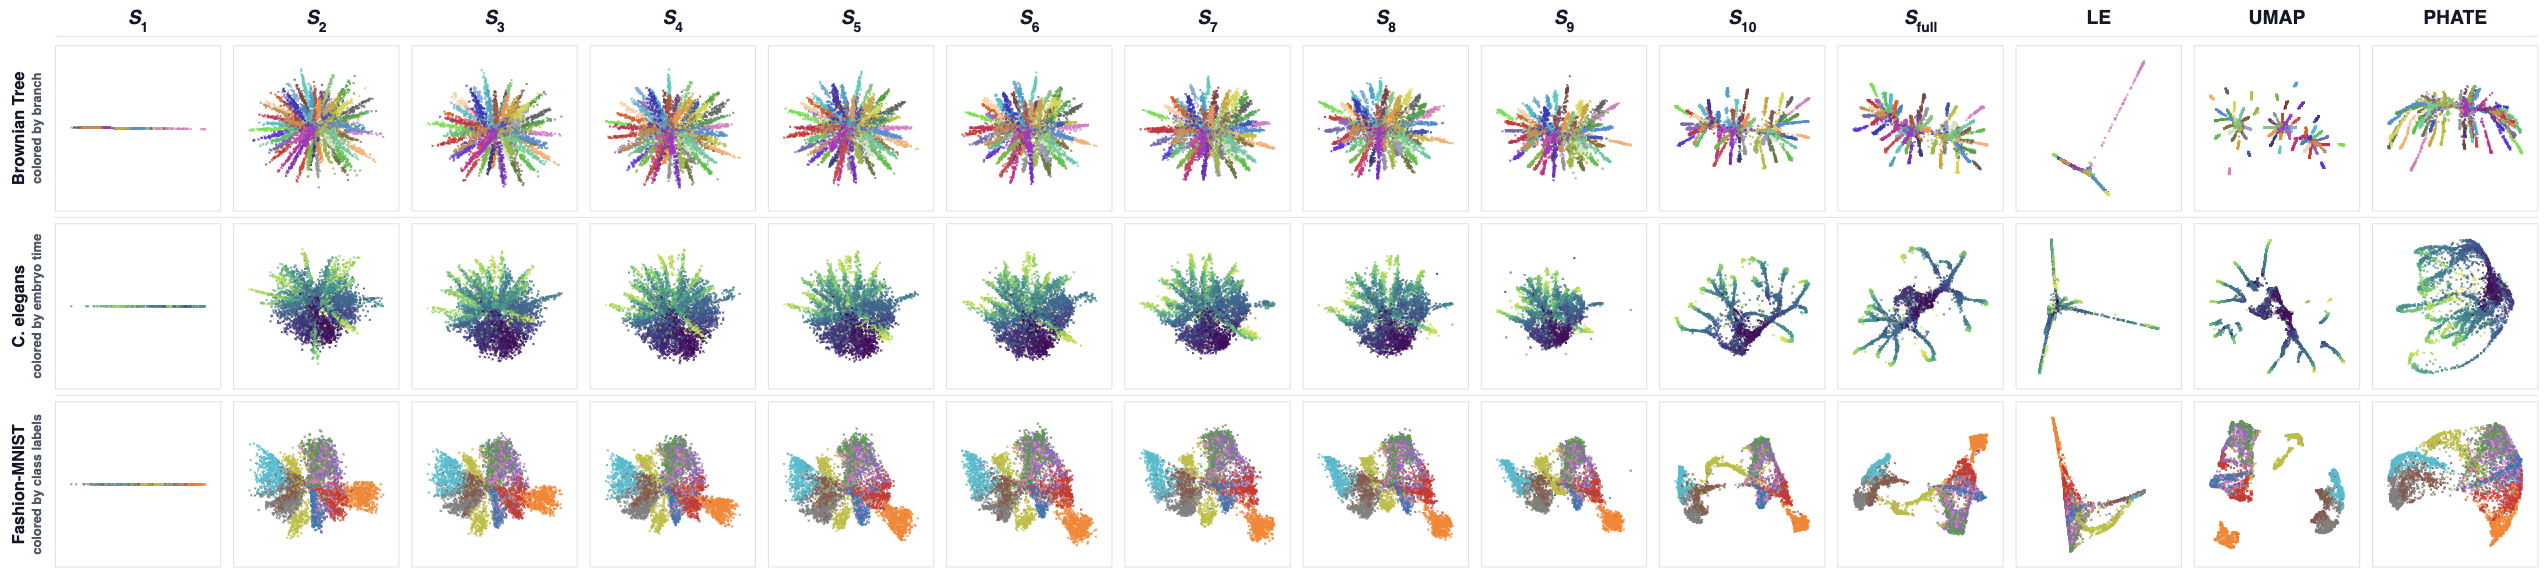
Figure 3: Embedding quality improves as more spectral modes are added; qualitative structures emerge in a coarse-to-fine manner.
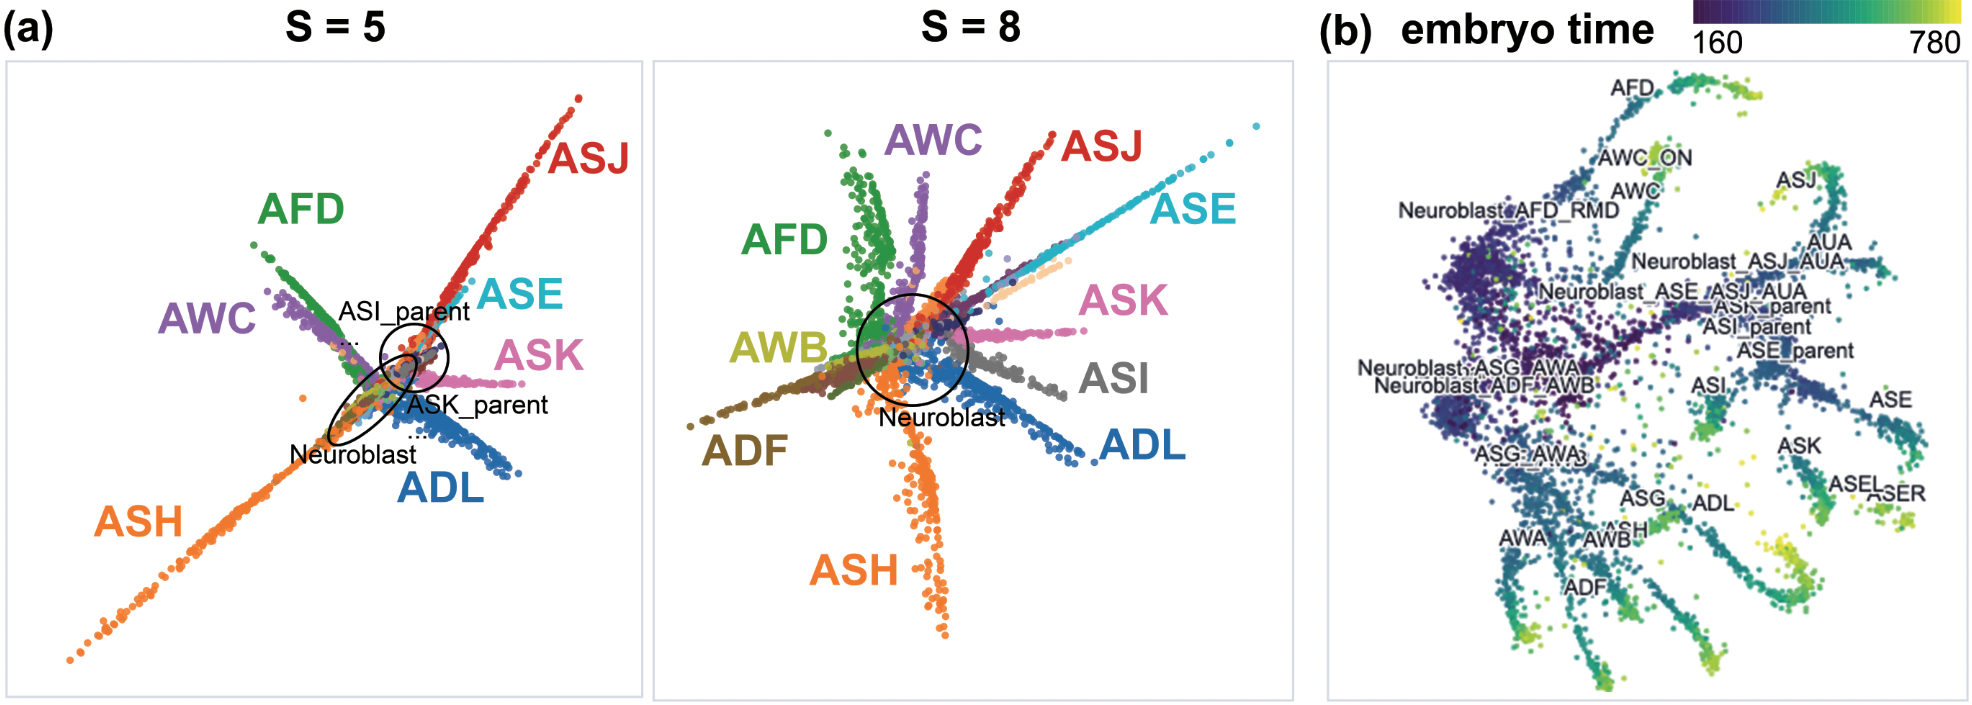
Figure 4: On C. elegans single-cell data, early stages isolate lineages, while late stages reveal temporal trajectories and fine distinctions.
Interpretability and Visual Diagnostics
A key advantage of this formulation is its inherent interpretability. Each embedding is decomposable in terms of spectral modes, supporting both global and local diagnostics. Global 'spectral response' plots quantify the contribution of each mode to the final embedding; datasets with prominent global geometry show high energy in low modes, while those depending on fine detail have higher-frequency tails.
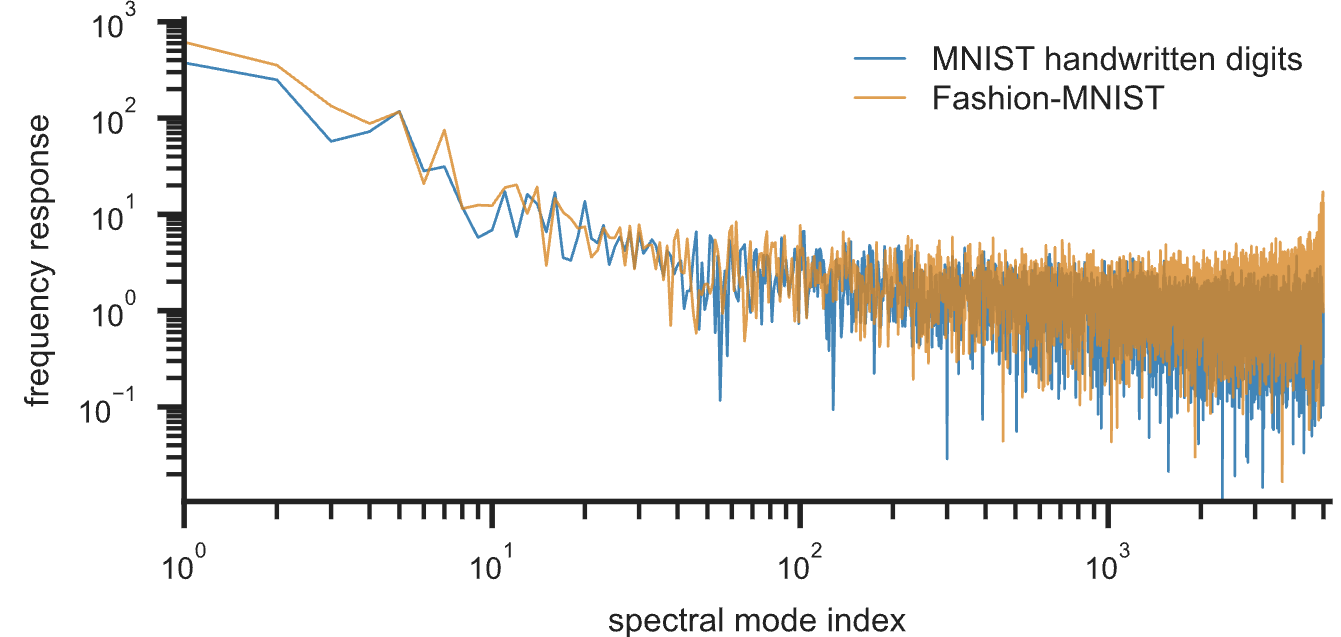
Figure 5: Spectral response plots highlight different mode contributions in MNIST and Fashion MNIST.
Locally, each data point's position can be interpreted as a sum over spectral modes, visualized through glyphs or petal plots, elucidating how both graph geometry and optimizer selectivity determine embedding formation.
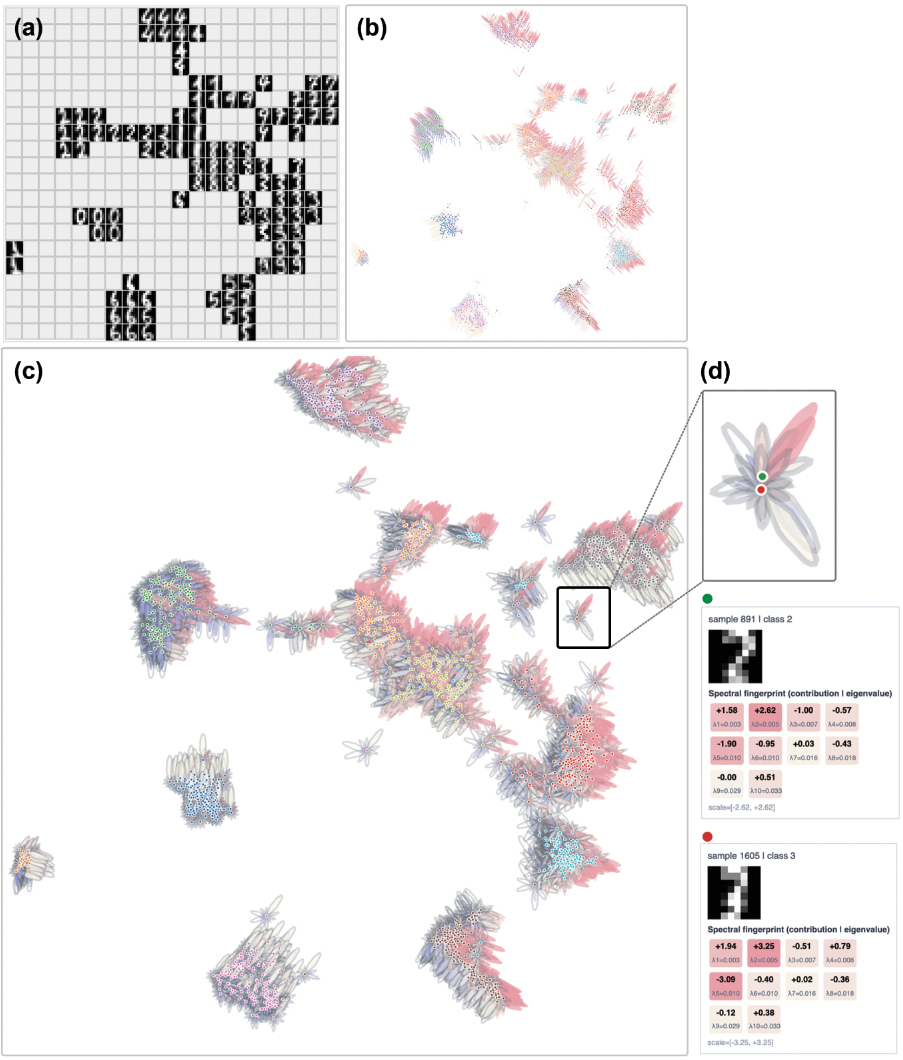
Figure 6: Point-level glyphs in MNIST describe local spectral fingerprints, revealing directional and frequency-dominant structure.
Computational Efficiency and Practical Implications
The subspace-constrained optimization reduces both the parameter count and per-iteration cost compared to unconstrained UMAP, with downstream complexity Y=USP1 (where Y=USP2 is subspace dimension, Y=USP3 graph edges, Y=USP4 epochs), and enables interpretable intermediate embeddings throughout training. Spectral preprocessing costs are amortized by using truncated eigensolvers, and are comparable to existing DR pipelines that employ spectral initialization.
Practically, this framework enables analysts to navigate the global–local continuum systematically, select the appropriate scale for visualization, and understand which topological or class distinctions in their data are present at what spectral level. The progressive approach naturally produces embeddings that avoid arbitrary cluster separation and preserves manifold connectivity over a range of real-world and synthetic data.
Implications, Limitations, and Future Directions
The theoretical impact of this work is in reframing nonlinear DR as a structured graph signal decomposition problem, where the embedding process is not just a mapping, but a spectral filtering over the data's intrinsic geometry. This connects DR more deeply to developments in spectral graph theory, graph signal processing, and learning on graphs, linking frequency-selective optimization to interpretability and stability.
Practical implications include robust multi-scale data visualization, transparent tuning of local/global emphasis, and the ability to diagnose when structure in the embedding is supported by coarse or fine scales. The explicit spectral parameterization also opens the door to novel regularization and filtering strategies, and may inform improvements in graph construction or adaptive selection of Y=USP5 based on data complexity or task requirements.
For future work, directions include integrating spectral filter learning (as in spectral GNNs), analyzing graph construction and augmentation effects in terms of spectrum, and extending the approach for interactive visual analytics and interpretable representation learning. Studying robustness to graph noise or extending to non-linear and kernelized graph operators may further expand its applicability.
Conclusion
This spectral DR framework constitutes a significant advance in the interpretability and controllability of neighbor embedding algorithms, merging spectral decomposition with cross-entropy optimization to yield multi-scale, analyzable embeddings. Its ability to decouple embedding expressiveness from analytical transparency, and to dissect geometrical contributions at both global and local levels, provides a principled foundation for the next generation of DR, visualization, and exploratory manifold learning systems.

