- The paper introduces a three-step network construction pipeline using bipartite formation, projection, and aggregation to map global conflicts.
- It finds that firms form dense, sector-specific clusters while EJOs, though fragmented, achieve global connectivity through limited bridging nodes.
- The analysis implies that network centrality metrics can proxy reputational and regulatory risks in socio-environmental conflict scenarios.
Network Structure and Asymmetry in Global Socio-Environmental Conflicts
Introduction
This essay synthesizes the methodology, results, and implications of "Fragmented Movements, Connected Opponents: Analyzing the Interconnectivity of Firms and Environmental Justice Organizations in Global Socio-Environmental Conflicts" (2603.29722). The paper applies network theory to the EJAtlas dataset to quantitatively compare the relational architectures of multinational corporations (firms) and Environmental Justice Organizations (EJOs) involved in global socio-environmental conflicts. By constructing multilayer and projected networks, the research provides structural insight into the coordination, fragmentation, and power distributions among actors in ecological distribution conflicts.
Methodology
The approach centers on a three-step network construction pipeline:
- Bipartite Network Formation: Actors (firms, EJOs) are linked to conflicts using EJAtlas data, with two bipartite networks generated: conflict-company and conflict-EJO.
- Network Projections: Through node projections, four networks are created: actor–actor (EJO–EJO, company–company) via shared conflict participation, and conflict–conflict via shared actors.
- Aggregation: Actors and projected networks are further aggregated by categories and geographies (country, region), leveraging attributes from EJAtlas for higher-level structure analysis.
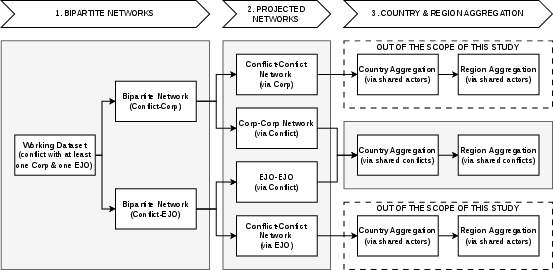
Figure 1: Flowchart representing the pipeline from bipartite networks to projected and aggregated networks.
This methodological structure supports quantitative comparison of connectivity, clustering, degree distributions, and community formation.
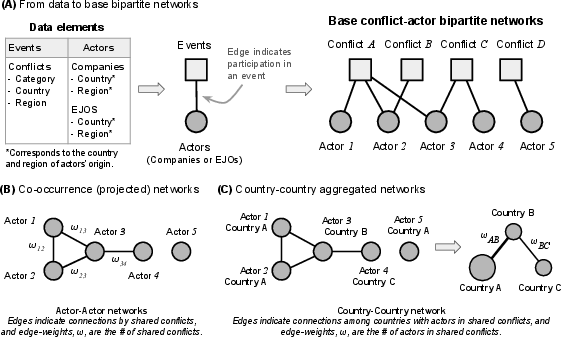
Figure 2: Visual explanation of network construction, with bipartite mapping, projections, and aggregation steps.
EJAtlas Dataset Properties
The working dataset (pre-cleaned) comprises 3,396 conflicts across 164 countries, entailing 6,244 companies and 11,231 EJOs, covering mining, fossil fuels, infrastructure, waste management, biodiversity, and other categories. The data is skewed toward Latin America, Europe, and North America, reflecting regional research and activist network strengths.
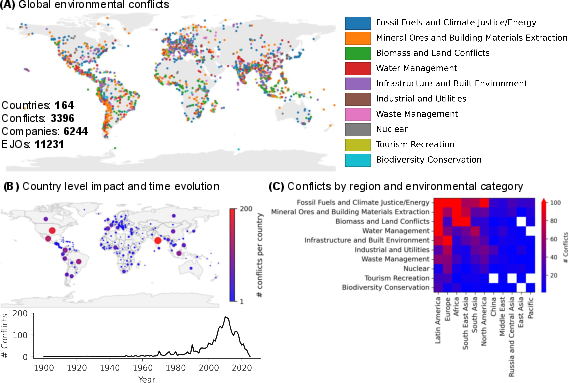
Figure 3: Geographical, temporal, and sectoral summary of EJAtlas conflicts and actor distributions.
Bipartite Network Analysis
Bipartite network characterization reveals divergent actor engagement:
- Companies: Average of 1.55 conflicts per company (2.86 companies per conflict); 59% in the largest connected component (LCC).
- EJOs: Average of 1.48 conflicts per EJO (4.9 EJOs per conflict); 81% in LCC.
Despite fewer average conflicts per EJO, the EJO network LCC is substantially larger—indicative of emergent connectivity from distributed actor dynamics.
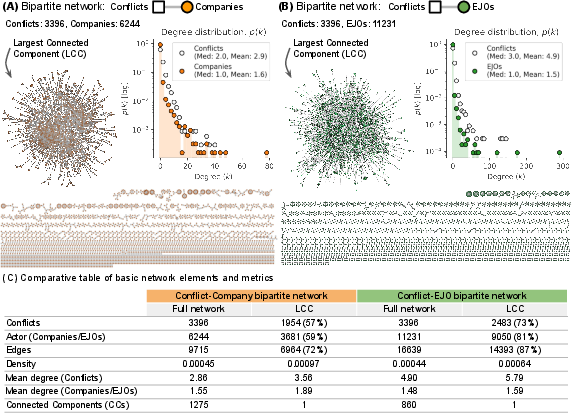
Figure 4: Bipartite conflict-company and conflict-EJO networks showing connectedness and degree distributions.
Projected Network Structure
Actor–Actor Networks
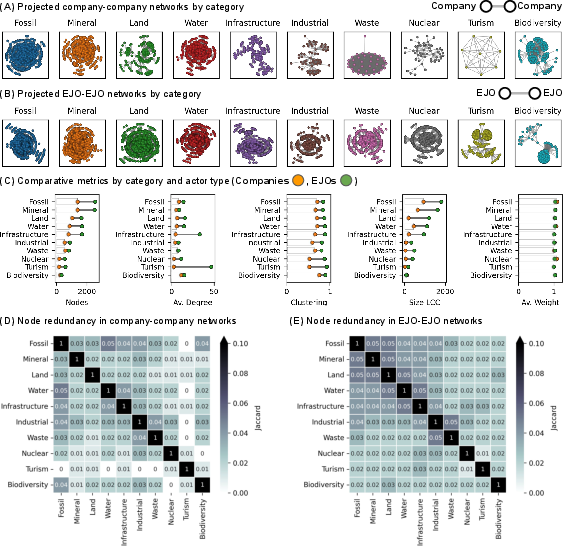
- Company–Company: Dense, clustered, high-degree nodes; many central companies with high interconnectivity.
- EJO–EJO: Fragmented, fewer conflicts per EJO, but LCC connects >80% of nodes. A small number of transnational EJOs act as bridges.
Degree and centrality statistics—mean degree (EJO: 18.6, Company: 7.1), betweenness, closeness—demonstrate higher fragmentation and emergent connectivity among EJOs compared to systematic company clustering.
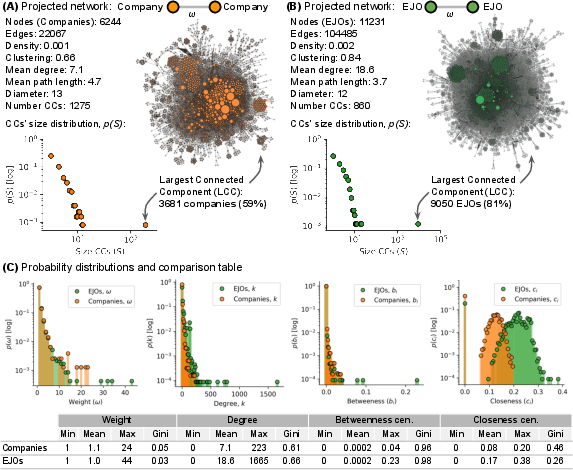
Figure 5: Projected actor–actor networks for companies and EJOs with centrality and clustering features.
Conflict–Conflict Networks
Projection via actors (company or EJO) shows further divergence:
- Companies: Conflict–conflict connectivity is sector-dependent—strong intra-category clustering (e.g. mining, fossil fuels).
- EJOs: Conflict–conflict connectivity is cross-sectoral, driven by contextual response rather than business model.
Edge frequencies demonstrate companies reinforce sector-specific conflict connectivity, whereas EJOs create cross-sector linkages.
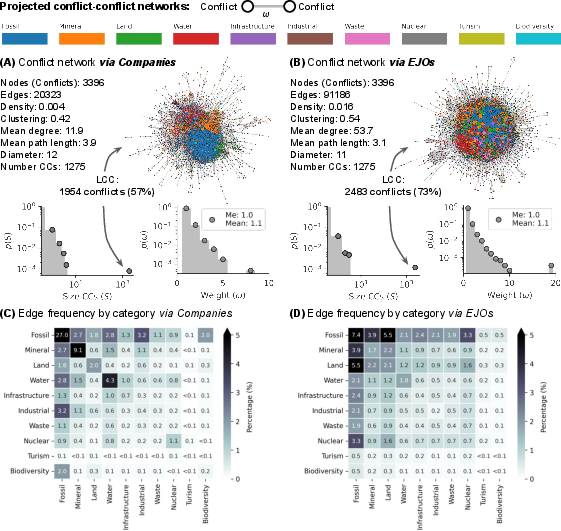
Figure 6: Conflict–conflict networks projected via shared actors, highlighting sectoral clustering (companies) and cross-sectoral links (EJOs).
Category-Based Projection and Robustness
Actor–actor networks filtered by conflict category exhibit:
Geographic Aggregation
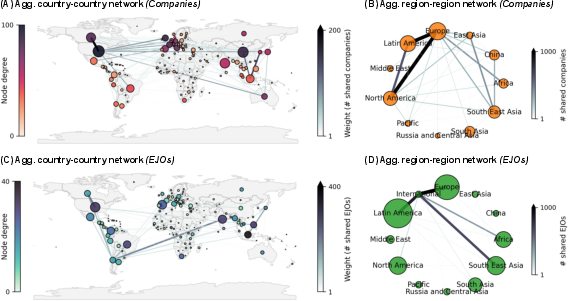
Country- and region-level aggregation of actor–actor networks shows:
Discussion
Structural Asymmetry and Emergent Properties
The empirical results assert a robust asymmetry—corporate networks are systematically integrated and clustered, reflecting sectoral expansion and coordinated strategies. EJOs, in contrast, are fragmented yet globally connected via a limited set of hubs and distributed local organizations, creating a decentralized, emergent network characterized by context-driven attachment.
The structural differences emanate from divergent actor logics:
- Firms: Expansion, sector-based clustering, strategic coordination, global integration, continuous involvement, system-level hubs.
- EJOs: Protection, place-based emergence, reactive adaptation, local response, event-driven activation, distributed connectors.
This pushes the field toward recognizing the complex, adaptive nature of global environmental justice movements—a self-organized phenomenon, not a formalized network.
Policy and Managerial Implications
- Systemic Corruption: Recurrent actor involvement across conflicts signals networked risk rather than isolated malpractice; structural risk configurations are emergent and require systemic indicators.
- Corporate Risk Assessment: Network centrality is a proxy for reputational and regulatory exposure; aggregative metrics (country/regional) aide in predictive modeling for conflict hotspots.
- EJO Coordination: Augmented transnational knowledge exchange and coordination mechanisms would reinforce movement robustness and counterbalance corporate integration.
Network science tools are essential for ESG frameworks, project risk, and policy making in the environmental justice domain.
Limitations and Future Research
Structural analyses are contingent on data representativeness and the co-occurrence approach in EJAtlas; legal/collaborative relationship inferences are limited. Potential future directions include:
- Granular multilayer modeling (actor types, conflict intensity)
- Temporal dynamics of actor participation and conflict diffusion
- Robustness testing of EJO hubs via targeted removal
- Network-based systemic risk and corruption metrics
Conclusion
The paper provides rigorous quantitative evidence of structural asymmetry between companies and EJOs in global socio-environmental conflict networks. Corporate actors manifest coordinated, sectoral expansion reflected in systemic integration and clustering. EJOs, while fragmented, demonstrate emergent, resilient global connectivity via distributed local action and limited central bridging nodes. This dichotomy underscores fundamental differences in actor logic, power dynamics, and coordination—offering a framework for systemic risk assessment, policy interventions, and future research in complex socio-ecological systems.