Realistic Market Impact Modeling for Reinforcement Learning Trading Environments
Abstract: Reinforcement learning (RL) has shown promise for trading, yet most open-source backtesting environments assume negligible or fixed transaction costs, causing agents to learn trading behaviors that fail under realistic execution. We introduce three Gymnasium-compatible trading environments -- MACE (Market-Adjusted Cost Execution) stock trading, margin trading, and portfolio optimization -- that integrate nonlinear market impact models grounded in the Almgren-Chriss framework and the empirically validated square-root impact law. Each environment provides pluggable cost models, permanent impact tracking with exponential decay, and comprehensive trade-level logging. We evaluate five DRL algorithms (A2C, PPO, DDPG, SAC, TD3) on the NASDAQ-100, comparing a fixed 10 bps baseline against the AC model with Optuna-tuned hyperparameters. Our results show that (i) the cost model materially changes both absolute performance and the relative ranking of algorithms across all three environments; (ii) the AC model produces dramatically different trading behavior, e.g., daily costs dropping from $200k to $8k with turnover falling from 19% to 1%; (iii) hyperparameter optimization is essential for constraining pathological trading, with costs dropping up to 82%; and (iv) algorithm-cost model interactions are strongly environment-specific, e.g., DDPG's OOS Sharpe jumps from -2.1 to 0.3 under AC in margin trading while SAC's drops from -0.5 to -1.2. We release the full suite as an open-source extension to FinRL-Meta.
Paper Prompts
Sign up for free to create and run prompts on this paper using GPT-5.
Top Community Prompts
Explain it Like I'm 14
What this paper is about (big picture)
The paper is about teaching computer programs to trade stocks more realistically. It shows that many trading simulators ignore a key real‑life problem: when you try to buy or sell a lot of shares, your own trading pushes the price against you. This is called “market impact.” The authors build new training environments for reinforcement learning (RL) that include realistic market impact, so that agents learn habits that are more likely to work in the real world.
What questions the researchers asked
They set out to answer a few simple questions:
- If we make trading costs more realistic, do RL trading agents behave differently?
- Does this change which algorithms look “best” in tests?
- Can better cost modeling stop agents from over‑trading (buying and selling too much just because the simulator makes it cheap)?
- Does careful tuning of the agents’ settings (hyperparameters) help them avoid bad habits?
How they tested their ideas (in everyday terms)
Think of RL like training a pet with rewards: the agent tries actions (trades), sees what happens (profit or loss), and gets “treats” for good behavior. The “game” it plays is a stock market simulator.
What they built:
- Three trading “games” (environments) that are compatible with Gymnasium and extend FinRL-Meta: 1) Stock trading, 2) Margin trading (using borrowed money), and 3) Portfolio optimization (deciding what percent of money goes in each stock).
- A plug‑in system for trading costs that includes more realistic models of market impact.
Key idea: market impact
- Imagine everyone rushing to buy the same sneaker; the price goes up because demand is high. In markets, if you try to buy a lot quickly, you eat up the available shares and the price rises, so you pay more. If you sell a lot, the price falls, so you get less. That’s market impact.
- Many simulators just charge a tiny fixed fee (like 0.10% per trade). Real costs aren’t flat like that; they grow as you trade more or faster.
The cost models they used:
- Flat fee (the simple baseline): “10 bps” means 0.10% per trade, no matter the size.
- Realistic models:
- Square‑root law: the extra price move grows roughly with the square root of how big your trade is relative to normal daily volume and market volatility.
- Almgren–Chriss (AC): splits costs into quick, temporary price moves and longer‑lasting, permanent price shifts, both depending on trade size and market conditions. They also model that permanent impact fades over days.
How they ran the tests:
- Data: NASDAQ‑100 stocks from 2010 to 2026 (training then “out‑of‑sample” testing on later data the agent didn’t see).
- Algorithms: five popular RL methods (A2C, PPO, DDPG, SAC, TD3).
- Tuning: they used Optuna to automatically tune each agent’s settings, like adjusting the knobs on a radio until the signal is clear.
- Rewards and metrics: they focused on risk‑adjusted performance (Sharpe ratio), total return, turnover (how much they trade), and POV (what percent of a day’s volume their orders are). They also compared results to a simple equal‑weighted NASDAQ‑100 ETF.
What they found (and why it matters)
Here are the main takeaways:
- Realistic costs change who “wins.” With the simple flat fee, one algorithm might look best; with realistic costs, the ranking can flip.
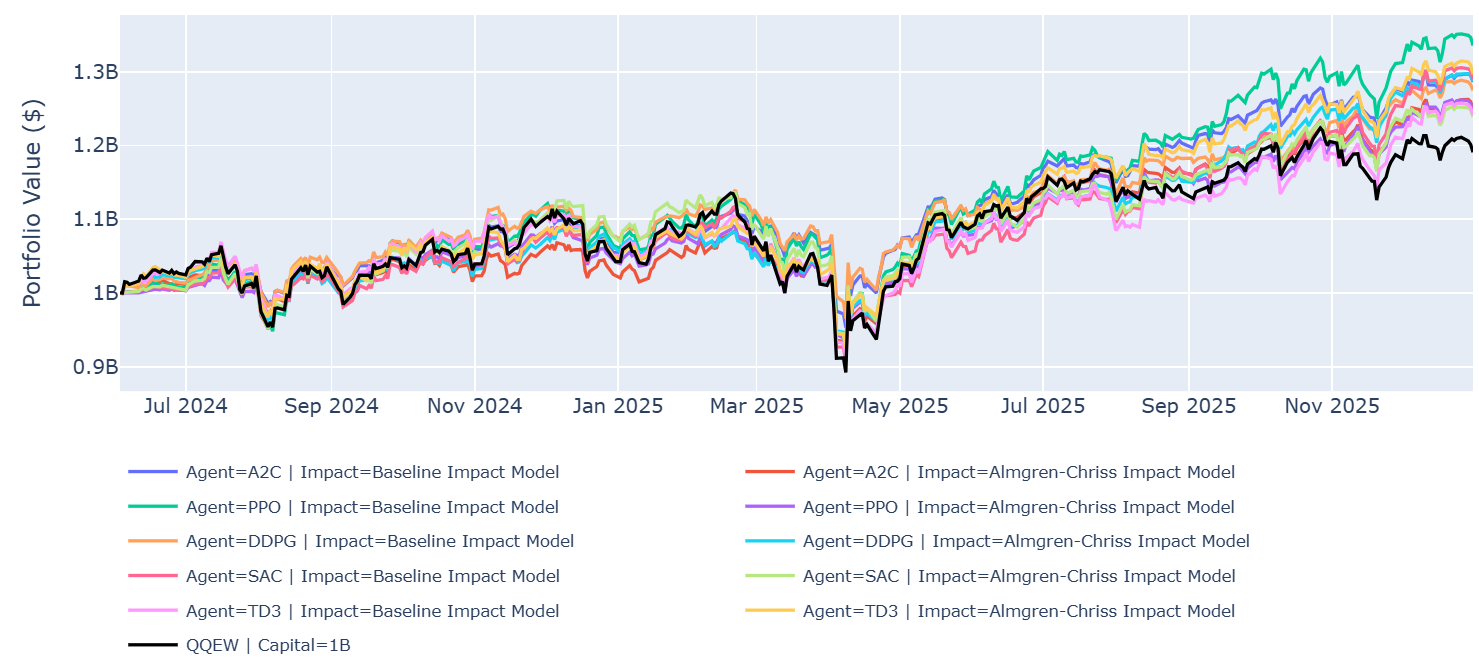
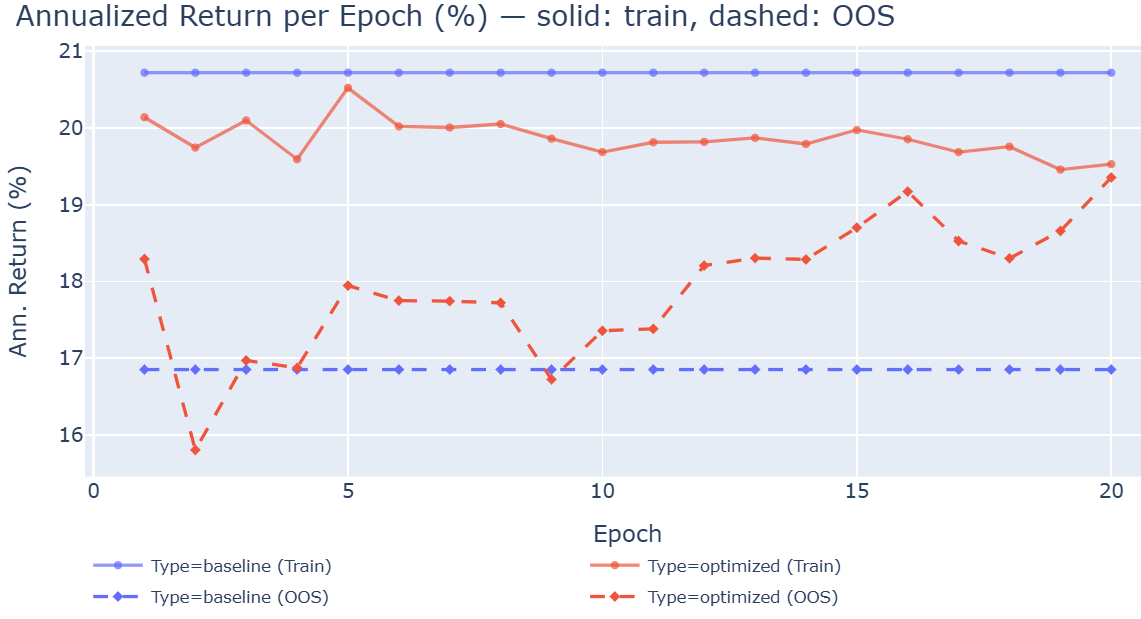
- Example (stock trading): PPO did best under the simple fee (about 20% yearly return out‑of‑sample) but dropped to ~15% with realistic costs. TD3 improved under realistic costs (from ~15% to ~18%).
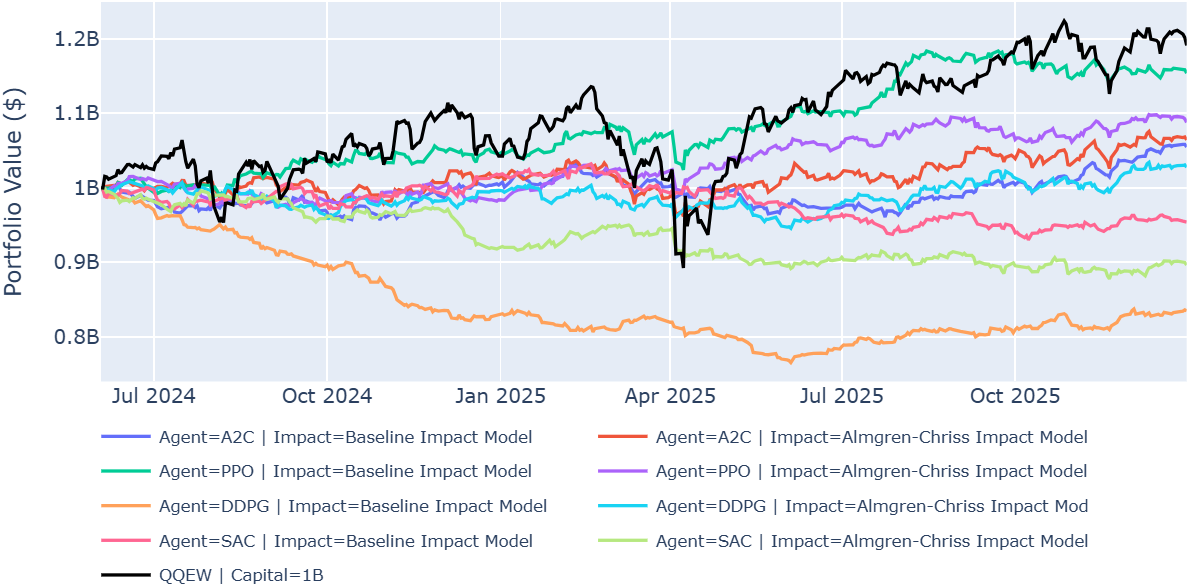
- Example (portfolio optimization): TD3 with realistic costs reached ~32% (best overall), but only ~26% with the simple fee.
- Realistic costs lead to healthier habits. Agents learned to trade less aggressively.
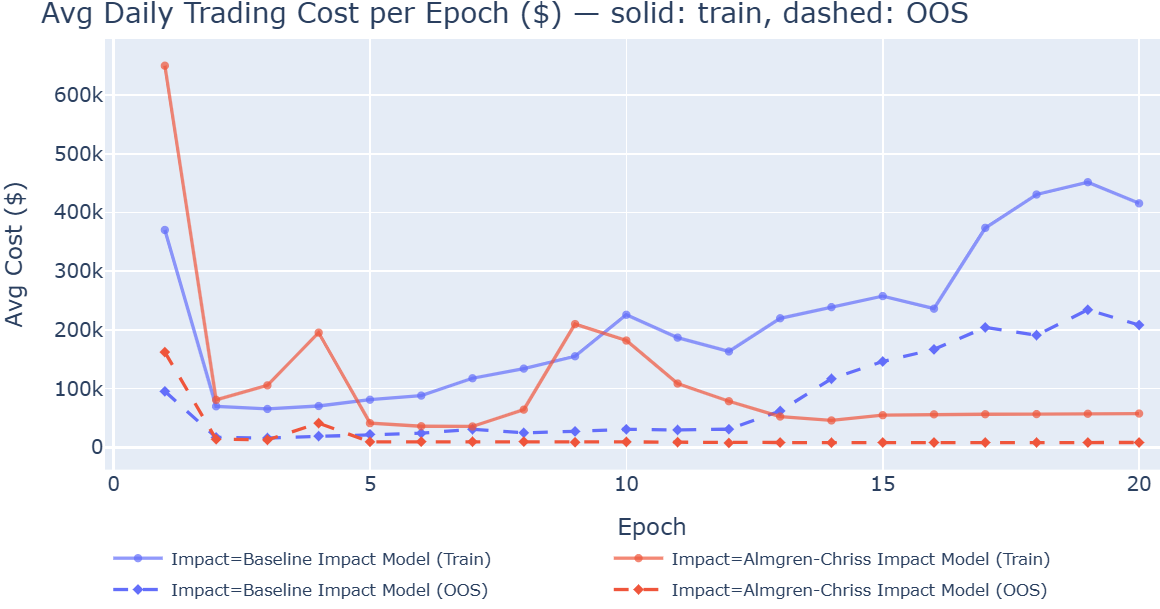
- Example: A non‑tuned TD3 agent’s daily trading cost fell from about $200,000 to$8,000 when switching to realistic costs, and its daily turnover dropped from ~19% to ~1%.
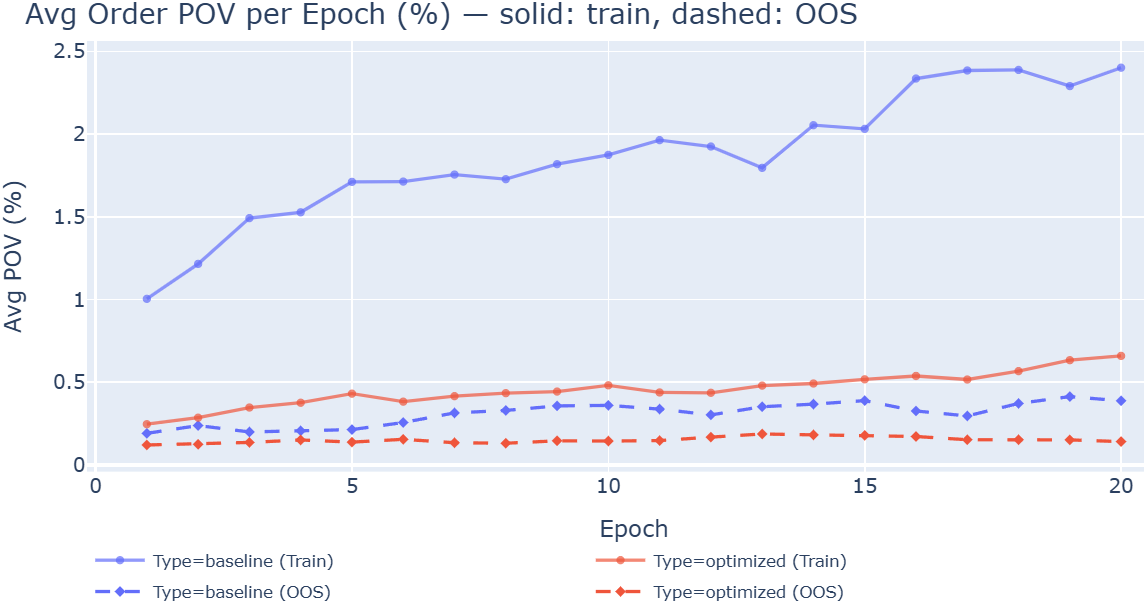
- Tuning the agents is essential. Without hyperparameter tuning, many agents developed “over‑trading” habits during training, gradually trading more and more just because the simulator didn’t punish it enough.
- With tuning, SAC cut trading costs by ~82% in the stock environment.
- Results depend on both the environment and the algorithm.
- In margin trading, DDPG got much better with realistic costs (Sharpe from −2.1 to 0.3), while SAC got worse (Sharpe from −0.5 to −1.2). This shows there’s no one‑size‑fits‑all winner.
In short: when the simulator charges costs that look like real markets, agents stop gaming the system and start behaving more sensibly—trading less, paying lower costs, and sometimes improving risk‑adjusted performance.
Why this work is useful
- For researchers: It provides open‑source, plug‑and‑play environments that include realistic market impact, better logs, and reports. That means fairer tests and more reliable results across studies.
- For practitioners: Training with realistic costs can prevent strategies that look great in backtests but fail live because they trade too much and move the market.
- For the field: It highlights that careful tuning and cost modeling can make RL strategies more stable and more likely to generalize to new, unseen data.
Overall, this paper pushes trading AI closer to the real world by making the training ground more honest about the true cost of trading.
Knowledge Gaps
Knowledge gaps, limitations, and open questions
The paper advances impact-aware RL trading environments but leaves several concrete issues unresolved. Future work can address the following gaps:
- Impact model calibration and validation
- Lack of empirical calibration of AC parameters (, , ) and square-root prefactor at the per-asset and time-varying levels using trade/quote data; current defaults (e.g., bps, days) are not validated against real markets.
- No out-of-sample verification that realized (simulated) impact vs. participation and volatility matches empirical impact curves; absence of goodness-of-fit or error analysis on impact predictions.
- Permanent impact modeled with a fixed exponential half-life; no exploration of heterogeneity across assets, regimes, or alternative decay kernels (e.g., power-law/transient kernels suggested by Obizhaeva–Wang).
- Execution realism and intraday scheduling
- Daily-bar execution with volume caps omits intraday volume curves, order slicing, and schedule choice; no agent decision over participation rate vs. time horizon as in AC/OW optimal execution.
- Absence of a richer execution model (limit orders, queue position, partial fills, stochastic spreads), despite citing ABIDES; unclear whether learned policies transfer to microstructure-level simulators.
- Execution price formation is under-specified (e.g., trade at close, VWAP proxy, next-bar pricing) and may affect PnL and impact accounting.
- Unmodeled costs and financing frictions
- No inclusion of borrow fees/stock loan availability for shorts, margin interest, funding rates, exchange/SEC fees, taxes, or dividend/withholding effects—especially impactful in the margin environment.
- Static half-spread assumption (5 bps) ignores cross-sectional and temporal variability in spreads and volatility.
- Data, evaluation design, and generalization
- Survivorship bias from a static NASDAQ-100 membership; delistings and historical index reconstitutions are not reflected.
- Single market (NASDAQ-100, large-cap) and daily frequency only; no tests on small/mid caps, other geographies, or higher-frequency data where impact is larger and more nonlinear.
- One short OOS period (2025) with a 90/10 split; lack of walk-forward or rolling-window evaluation across multiple market regimes.
- Potential data leakage in HPO: the objective uses “OOS annualized Sharpe across epochs” within the pre-2025 window; nested cross-validation or stricter holdouts are not used.
- Reproducibility and statistical rigor
- No reporting of multiple random seeds, confidence intervals, or significance tests; differences in returns/Sharpe and rankings may be within stochastic variability (cf. Henderson et al., 2018).
- Sensitivity analyses to key knobs (impact coefficients, half-life, volume caps, spread, observation normalization, reward scaling) are not provided.
- Model coverage and ablations
- Square-root and Obizhaeva–Wang models are implemented but not systematically evaluated or compared to AC and baseline in the experiments.
- No ablation to isolate which environment components (permanent impact tracking, decay, trade caps, reward scaling) drive the observed changes in behavior and performance.
- Reward shaping and objectives
- DSR-based reward (plus drawdown penalty) can trade off Sharpe vs. drawdown in undesirable ways; exploration of alternative objectives (e.g., CVaR, mean-CVaR, utility-based, turnover-penalized) or multi-objective optimization (e.g., NSGA-II) is absent.
- Stability of DSR under non-stationary returns and the impact of smoothing horizon on learning dynamics are not examined.
- Risk and constraint modeling
- Limited risk controls (per-stock exposure cap, volume caps) without portfolio-level constraints (e.g., factor/sector/β exposures, VaR/CVaR limits, leverage paths); effect of richer constraints on learned policies is untested.
- No stress testing under liquidity shocks (e.g., 2020 COVID, flash crashes), volatility spikes, or regime shifts to assess robustness.
- Benchmarking and fairness
- Comparisons to QQEW do not clarify whether benchmark includes realistic transaction costs; fairness of RL vs. benchmark cost treatment is not established.
- Margin environment uses default parameters only; conclusions about cost-model effects there may conflate suboptimal hyperparameters with true model differences.
- Observations and state design
- Volatility () estimation method, window length, and robustness are not specified; impact and reward depend critically on .
- Inclusion of “permanent impact in basis points” in observations may let agents exploit simulator-specific artifacts; ablations without this feature are not reported.
- Action mapping and constraints
- Mapping from actions to trades via portfolio-value-based caps and daily volume clipping may create persistent target-tracking error; interplay with learning (especially in POE) is not analyzed.
- Interaction between cash management (sell-before-buy rule), liquidity constraints, and slippage on realized performance is not dissected.
- Transfer and deployment
- No evidence that policies trained under AC generalize to different cost models, markets, or to a high-fidelity simulator/paper-trading/live setting; transfer learning and domain randomization over impact parameters are unexplored.
- Open question: do AC-trained policies outperform baseline-trained policies when evaluated under a microstructure simulator with realistic order book dynamics?
- Scalability and complexity
- Computational trade-offs of HPO with impact-aware environments (time, resource usage) are not quantified; guidance on practical HPO budgets vs. performance is missing.
- Transparency of implementation details
- Exact timing of trade execution, mark-to-market accounting under permanent impact, and how impact modifies subsequent prices and rewards need clearer specification to avoid double counting or unintended feedback.
These gaps suggest concrete next steps: empirically calibrate impact parameters per asset and regime, add intraday execution scheduling and order book realism, broaden datasets and evaluation protocols (multi-seed, walk-forward, multi-market), perform sensitivity/ablation studies, adopt robust/multi-objective rewards with stronger risk constraints, and validate transferability in high-fidelity simulators or controlled paper-trading pilots.
Practical Applications
Immediate Applications
The paper’s open-source environments, cost models, and empirical findings enable several deployable workflows across finance, software, and education today:
- Buy-side RL backtesting with realistic execution costs (Sector: Finance/Asset Management)
- What to do: Replace flat-fee simulators with the released MACE environments (FinRL-Meta extension) to train/test strategies under Almgren–Chriss (AC) and square-root impact models with permanent impact decay.
- Tools/workflows: FinRL-Meta + Gymnasium environments; pluggable cost models; trade-level logging (POV, turnover percentile, permanent impact); built-in report generator.
- Assumptions/dependencies: Calibrate AC parameters (α, β, ε, decay half-life) to firm/market; reliable ADV/volatility estimates; daily-bar data; large-cap equities align best with defaults.
- Execution-aware hyperparameter optimization to constrain over-trading (Sector: Finance/Asset Management; Software/MLOps)
- What to do: Integrate Optuna HPO with objectives that include OOS Sharpe and explicit cost/turnover penalties to prevent pathological participation growth observed without HPO.
- Tools/workflows: Optuna TPE + pruning; per-epoch IS/OOS tracking; automated guardrails for POV/turnover.
- Assumptions/dependencies: Compute budget for HPO; well-defined, multi-metric objective; monitoring for overfitting.
- Algorithm selection under realistic costs (Sector: Finance/Asset Management; Academia)
- What to do: Use the paper’s evidence to guide algorithm choice depending on cost regime and task—e.g., consider TD3 for portfolio optimization under AC; be cautious deploying PPO that performs best under flat fees but can degrade with nonlinear costs.
- Tools/workflows: Side-by-side training/evaluation under AC vs. flat fees; rank stability analysis across cost models.
- Assumptions/dependencies: Cross-validated OOS performance; consistent data splits; cost model calibrated to trading venue.
- Pre-trade “what-if” TCA for RL strategies (Sector: Finance/Asset Management; Sell-Side Brokerage)
- What to do: Stress-test a candidate policy’s costs, slippage, POV, and drawdown under different impact models and participation caps before live deployment.
- Tools/workflows: Pluggable cost models; report generator for costs/POV/turnover; scenario sweeps on max-POV and exposure limits.
- Assumptions/dependencies: Accurate ADV/volatility forecasts; mapping of action limits to OMS/EMS constraints.
- Best-execution and risk reporting via trade-level logs (Sector: Finance/Compliance/Risk)
- What to do: Leverage per-trade logging (POV, turnover percentile, permanent impact) to build dashboards for best-execution evidence, participation monitoring, and drawdown risk attribution.
- Tools/workflows: Automated reports; alerts when POV/turnover exceed guardrails; archive of training vs. OOS behavior for model risk.
- Assumptions/dependencies: Policy-to-trade audit trails; thresholds aligned with firm policy and liquidity tiers.
- Margin strategy research with execution costs (Sector: Finance/Asset Management; Academia)
- What to do: Use the margin environment with AC costs to evaluate leverage-sensitive strategies and the interaction of financing and execution frictions.
- Tools/workflows: Margin-specific environment; cost model toggles; IS/OOS split as in paper.
- Assumptions/dependencies: Incorporate borrow/financing costs externally (not modeled by default); margin rules as per venue/broker.
- Standardized academic benchmark for cost-aware RL (Sector: Academia/Education)
- What to do: Adopt the suite as a reproducible benchmark for RL in portfolio management courses and research, emphasizing cost realism and IS–OOS evaluation discipline.
- Tools/workflows: FinRL-Meta environments; published hyperparameter search spaces; per-epoch diagnostics.
- Assumptions/dependencies: Acknowledge survivorship bias from static NASDAQ-100 list; ensure transparent data splits and seeds.
- Sell-side client sandbox for execution-aware strategy prototyping (Sector: Sell-Side/Prime Brokerage)
- What to do: Offer a white-labeled version of the environment so clients can prototype strategies with broker-calibrated impact parameters and venue-specific constraints.
- Tools/workflows: Broker-calibrated AC coefficients; preset max-POV and ADV clips; reporting pack.
- Assumptions/dependencies: Access to broker TCA data for calibration; client NDA/compliance processes.
- Advanced retail quant education and prototyping (Sector: Personal/EdTech)
- What to do: Enable sophisticated retail quants to test strategies realistically and learn about cost-aware training dynamics and guardrails.
- Tools/workflows: Open-source install; tutorial notebooks; default AC parameters for large-cap equities.
- Assumptions/dependencies: Users must understand limitations (daily data, parameter calibration); avoid live trading without professional safeguards.
Long-Term Applications
With further research, scaling, or integration, the following applications become feasible:
- Live OMS/EMS integration for execution-aware RL (Sector: Finance/Asset Management; Trading Tech)
- What it could be: Deploy trained policies with real-time impact-aware throttling (dynamic POV caps, liquidity-aware rebalancing) and online cost estimation.
- Tools/workflows: Streaming volume/volatility forecasts; broker APIs; real-time risk gates; feedback loop for post-trade calibration.
- Assumptions/dependencies: Low-latency infra; robust online calibration; alignment with best-execution and compliance.
- Joint portfolio-and-execution co-optimization (Sector: Finance/Asset Management)
- What it could be: Co-train portfolio weights and execution schedules, explicitly trading off alpha vs. market impact to reduce slippage and turnover.
- Tools/workflows: Hierarchical RL or bilevel optimization; multi-objective rewards (Sharpe, drawdown, cost).
- Assumptions/dependencies: Differentiable or simulatable execution layer; stable training; organizational alignment across PM and execution desks.
- High-fidelity microstructure simulation (Sector: Finance/Market Structure Research)
- What it could be: Integrate limit order book simulators (e.g., ABIDES) to test intraday behaviors, venue fragmentation, and order placement (limit vs. market) under realistic liquidity dynamics.
- Tools/workflows: LOB simulators; intraday data; hybrid cost models (Obizhaeva–Wang with transient decay kernels).
- Assumptions/dependencies: Extensive data and compute; model validation against broker TCA.
- Dynamic universe membership and small/mid-cap extension (Sector: Finance/Asset Management; Academia)
- What it could be: Evaluate cost-aware RL under higher participation regimes and realistic index churn to reduce survivorship bias and stress liquidity.
- Tools/workflows: Rolling index constituents; corporate action handling; size-tiered cost parameterization.
- Assumptions/dependencies: Access to historical membership; robust data engineering.
- Regulatory and policy sandbox for market design (Sector: Policy/Regulation)
- What it could be: Test impacts of transaction taxes, tick-size changes, or liquidity-provision incentives on algorithmic strategy behavior and market quality.
- Tools/workflows: Scenario toggles in cost models; agent-based ensembles; stress episodes (liquidity droughts).
- Assumptions/dependencies: Data-sharing with venues; careful interpretation beyond equities/daily bars.
- Multi-objective HPO and governance for RL in finance (Sector: Finance/MLOps; Compliance)
- What it could be: HPO frameworks that target Sharpe, drawdown, turnover, and POV simultaneously, with enforceable guardrails and model risk dashboards.
- Tools/workflows: Pareto-front search (e.g., NSGA-II); policy audit trails; automated drift detection on cost metrics.
- Assumptions/dependencies: Clear governance thresholds; computational budget; robust validation.
- Cross-asset and multi-venue generalization (Sector: Finance/Trading)
- What it could be: Apply to futures, FX, crypto, and multi-venue equities with venue-specific impact coefficients and execution constraints.
- Tools/workflows: Market-specific calibration pipelines; venue-routing logic; cross-asset reward normalization.
- Assumptions/dependencies: Quality intraday/venue data; distinct microstructure properties per asset class.
- Model risk management and continuous monitoring in production (Sector: Finance/MLOps)
- What it could be: Productionized per-epoch IS/OOS tracking, turnover/POV trend alarms, and automatic rollback if cost behavior deviates.
- Tools/workflows: Monitoring dashboards; canary deployments; shadow trading with synthetic orders.
- Assumptions/dependencies: Tight integration with execution stack; organizational risk frameworks.
- Firm-level AC calibration and TCA-as-a-service (Sector: FinTech/Vendors; Sell-Side)
- What it could be: Vendor service to fit AC/OW parameters from client execution data and plug them into training backtests and pre-trade analytics.
- Tools/workflows: Secure data pipelines; parameter estimation suites; API for cost model plugins.
- Assumptions/dependencies: Client data availability; privacy/compliance.
- Transferring the “nonlinear action cost” paradigm to other domains (Sector: Energy, Ads/MarTech, Mobility/Logistics)
- What it could be: Adapt the modeling approach where actions have scale-dependent costs (e.g., energy trading with ramp/imbalance costs, ad auctions with bid impact, fleet repositioning with surge effects) to train more realistic RL policies.
- Tools/workflows: Domain-specific impact laws; pluggable cost kernels; domain-calibrated HPO.
- Assumptions/dependencies: Access to domain data; validated cost functions; mapping to operational constraints.
- Enhanced margin and financing modeling (Sector: Finance/Prime Brokerage)
- What it could be: Incorporate borrow/financing costs, stock loan availability, and margin rules into the margin environment for live-closer training.
- Tools/workflows: Borrow fee data; constraint-aware action mapping; scenario tests for squeezes.
- Assumptions/dependencies: Data access; evolving broker policies.
- Robustness and fairness extensions for academic benchmarks (Sector: Academia)
- What it could be: Community-driven suites that standardize dynamic constituents, data-quality checks, and multiple cost models to reduce overfitting and improve comparability.
- Tools/workflows: Benchmark harness with seeded splits; reproducibility badges; dataset/version governance.
- Assumptions/dependencies: Community adoption; shared data standards.
These applications rely on the paper’s core contributions: pluggable nonlinear cost models (AC and square-root), permanent impact with decay, detailed execution logging, and the demonstrated necessity of hyperparameter optimization to control trading behavior—together forming a practical foundation for cost-aware RL research and deployment in finance.
Glossary
- A2C: Advantage Actor–Critic, an on-policy deep reinforcement learning algorithm for continuous control. "We evaluate five DRL algorithms (A2C, PPO, DDPG, SAC, TD3) on the NASDAQ~100 universe"
- Almgren--Chriss (AC) framework: A seminal optimal execution model that decomposes market impact into temporary and permanent components and guides cost-aware trading. "nonlinear market impact models grounded in the Almgren--Chriss (AC) framework and the empirically validated square-root impact law"
- Average Daily Volume (ADV): The average number of shares traded per day for a security, often used to scale order size and impact. "the price impact of a metaorder scales as the square root of the fraction of average daily volume (ADV) traded"
- Backtesting: Simulating a trading strategy on historical data to estimate performance before live deployment. "most open-source backtesting environments assume negligible or fixed transaction costs"
- Basis points (bps): One hundredth of a percent (0.01%), a unit to express small rates like fees or spreads. "A common simplification is to assume a fixed transaction cost of 10 basis points (bps)"
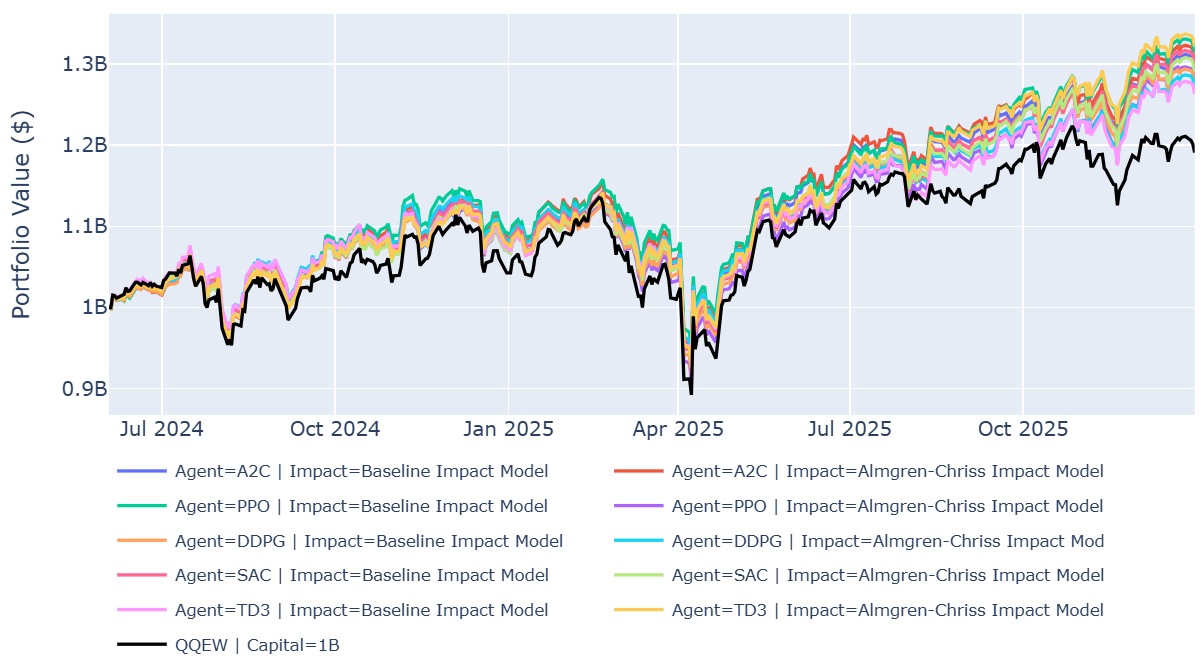
- Benchmark: A reference portfolio used to compare performance, such as an index or ETF. "The benchmark is the QQEW ETF (equal-weighted NASDAQ~100)"
- Cap-weighted: An index weighting scheme where constituents are weighted by market capitalization. "cap-weighted QQQ"
- DDPG: Deep Deterministic Policy Gradient, an off-policy actor–critic algorithm for continuous actions. "We evaluate five DRL algorithms (A2C, PPO, DDPG, SAC, TD3)"
- Depth-depletion cost: The execution cost component arising from consuming available liquidity in the limit order book. "and controls temporary depth-depletion cost"
- Differential Sharpe Ratio (DSR): An incremental version of the Sharpe ratio used as a per-step reward signal in RL to balance return and risk. "We use the Differential Sharpe Ratio (DSR) as the primary reward signal for the MACE stock trading environment"
- Drawdown: The peak-to-trough decline in portfolio value, a risk metric often used alongside returns. "max drawdown from 20\% to 16\%"
- Drawdown penalty: An additive penalty in the reward function to discourage large drawdowns during training. "The drawdown penalty augments the DSR:"
- Exponential decay: A process where effects diminish by a constant proportion over equal time intervals; used to model fading permanent impact. "We model this with exponential decay: each trading day"
- Gymnasium-compatible: Conforming to the Gymnasium (Gym) API for RL environments, enabling standardized training interfaces. "We present a suite of three Gymnasium-compatible environments"
- Half-life: The time it takes for a quantity to decay to half its value, used here for decay of permanent price impact. "with half-life days"
- Half-spread: Half of the bid–ask spread, used as a per-share cost component in execution models. "where controls permanent impact, is the half-spread (default $5$\,bps)"
- Hyperparameter optimization (HPO): Automated search for algorithm and environment parameters that maximize a chosen objective. "hyperparameter optimization (HPO) is essential for constraining pathological trading"
- In-sample (IS): The data segment used for training and model selection before out-of-sample evaluation. "All agents underperform the QQEW benchmark OOS, although A2C and PPO outperform IS"
- Kyle's model of informed trading: A foundational microstructure model explaining how informed trading impacts prices in continuous auctions. "Kyle's model of informed trading"
- Market impact: The adverse price movement caused by executing trades that consume liquidity, comprising temporary and permanent effects. "neglect the market impact of their trades"
- Median pruning: An Optuna early-stopping strategy that halts underperforming trials based on the running median of intermediate results. "We use Optuna~\cite{akiba2019} with TPE sampling and median pruning for HPO"
- Metaorder: A large parent order executed over time as a sequence of smaller trades. "the price impact of a metaorder scales as the square root of the fraction of average daily volume (ADV) traded"
- NASDAQ~100: A stock market index of 100 large non-financial companies listed on NASDAQ, used as the trading universe. "We evaluate five DRL algorithms on the NASDAQ~100 universe"
- Obizhaeva--Wang model: A market microstructure model capturing transient liquidity and impact dynamics. "Obizhaeva--Wang~\cite{obizhaeva2013}"
- Optuna: A software framework for automated hyperparameter optimization with efficient sampling and pruning strategies. "We use Optuna~\cite{akiba2019} with TPE sampling and median pruning for HPO"
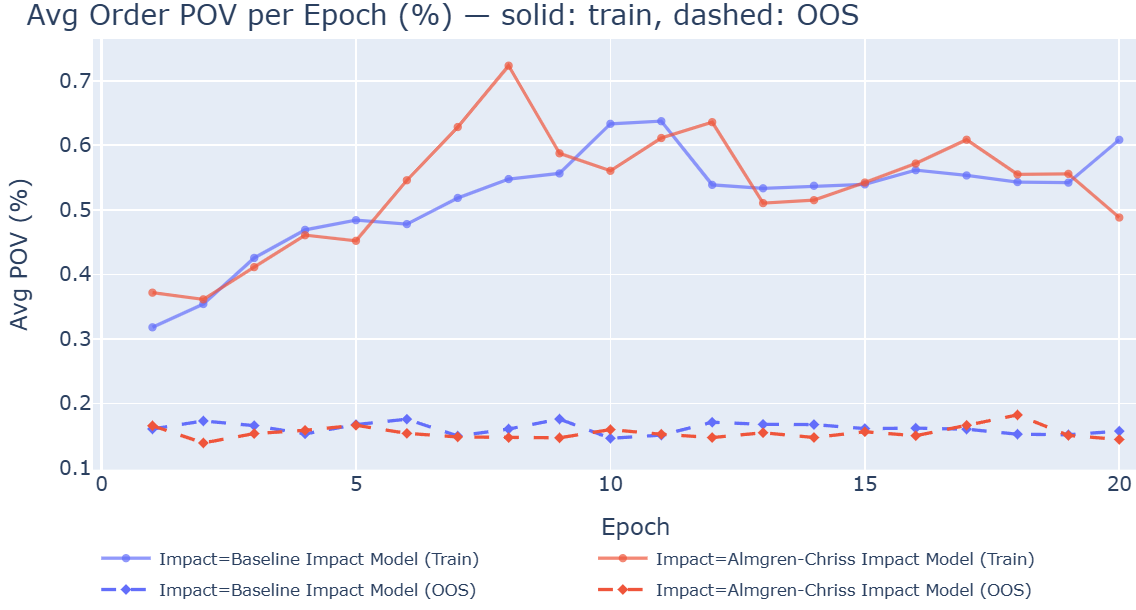
- Order percentage of volume (POV): The fraction of total traded volume represented by the agent’s orders, a participation metric. "POV (order percentage of volume), turnover percentile, and per-stock permanent impact for detailed backtest cost analysis"
- Out-of-sample (OOS): A holdout data segment used only for final evaluation to assess generalization. "split 90/10 for training and out-of-sample (OOS) testing"
- Participation rate: The share of market volume taken by an execution strategy, often monitored to control impact. "without hyperparameter optimization, agents exhibit monotonically increasing participation rates across epochs"
- Permanent impact: The lasting component of price impact attributed to information content of trades. "permanent impact tracking with exponential decay"
- Portfolio optimization: Allocating capital across assets to balance return and risk under constraints. "portfolio optimization---that integrate nonlinear market impact models"
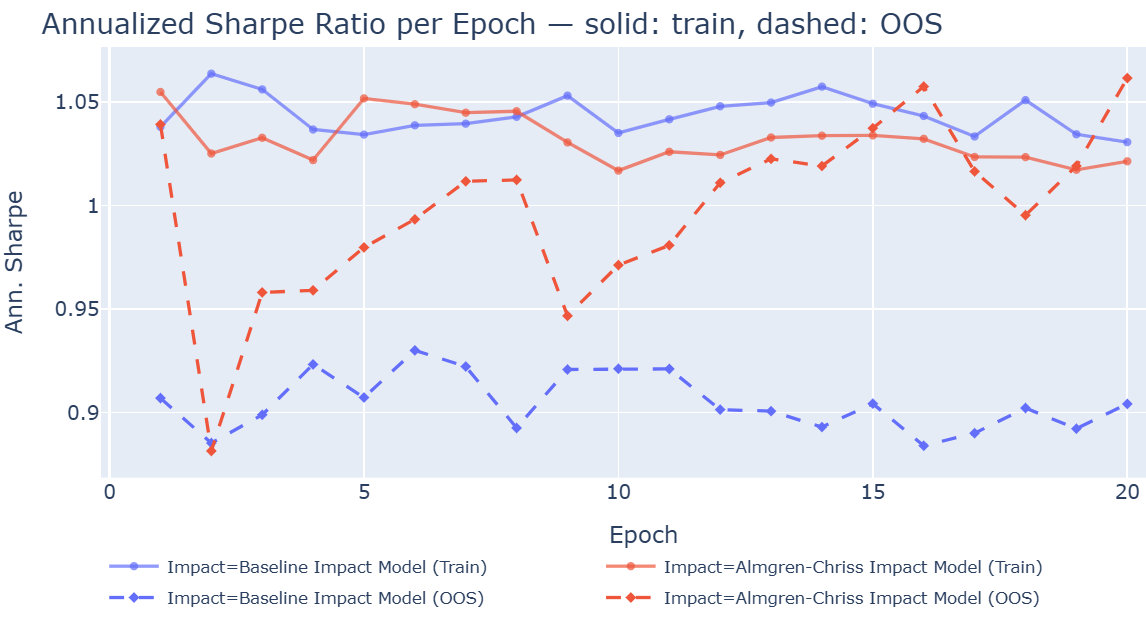
- PPO: Proximal Policy Optimization, a popular on-policy RL algorithm emphasizing stability through clipped objectives. "optimized PPO achieves the best OOS result (20\% return, Sharpe 1.06)"
- Rebalancing trades: Trades that adjust holdings to achieve target portfolio weights. "The environment computes the share-level rebalancing trades required to reach those targets"
- SAC: Soft Actor–Critic, an off-policy RL algorithm that maximizes entropy for improved exploration. "e.g., SAC stock trading costs drop 82\% with HPO"
- Sharpe ratio: A risk-adjusted performance metric defined as excess return per unit of volatility. "The objective is the best OOS annualized Sharpe ratio across epochs"
- Square-root impact law: An empirical regularity that expected price impact grows with the square root of trade size relative to ADV. "the empirically validated square-root impact law"
- Stable-Baselines3: A library of reliable implementations of reinforcement learning algorithms in Python. "We evaluate five algorithms from Stable-Baselines3~\cite{raffin2021}"
- Survivorship bias: A selection bias from analyzing only entities that have persisted over time, overstating performance. "While this introduces mild survivorship bias"
- TD3: Twin Delayed Deep Deterministic Policy Gradient, an off-policy algorithm improving DDPG with target policy smoothing and delayed updates. "TD3 improves from 15\% to 18\%"
- Temporary component: The immediate, non-lasting part of impact from demanding liquidity during execution. "decomposes these costs into a temporary component (the instantaneous cost of demanding liquidity, which reverts once the order is complete)"
- TPE sampling: Tree-structured Parzen Estimator, a Bayesian optimization method used to sample promising hyperparameters. "We use Optuna~\cite{akiba2019} with TPE sampling and median pruning for HPO"
- Turnover: The proportion of the portfolio traded over a period, indicating trading intensity. "with turnover falling from 19\% to 1\%"
- Volatility: A measure of the variability of returns, often proxied by standard deviation; key in impact and risk models. " is daily return volatility"
Collections
Sign up for free to add this paper to one or more collections.