Tab-TRM: Tiny Recursive Model for Insurance Pricing on Tabular Data
Abstract: We introduce Tab-TRM (Tabular-Tiny Recursive Model), a network architecture that adapts the recursive latent reasoning paradigm of Tiny Recursive Models (TRMs) to insurance modeling. Drawing inspiration from both the Hierarchical Reasoning Model (HRM) and its simplified successor TRM, the Tab-TRM model makes predictions by reasoning over the input features. It maintains two learnable latent tokens - an answer token and a reasoning state - that are iteratively refined by a compact, parameter-efficient recursive network. The recursive processing layer repeatedly updates the reasoning state given the full token sequence and then refines the answer token, in close analogy with iterative insurance pricing schemes. Conceptually, Tab-TRM bridges classical actuarial workflows - iterative generalized linear model fitting and minimum-bias calibration - on the one hand, and modern machine learning, in terms of Gradient Boosting Machines, on the other.
Paper Prompts
Sign up for free to create and run prompts on this paper using GPT-5.
Top Community Prompts
Explain it Like I'm 14
Plain-English Summary of “Tab-TRM: Tiny Recursive Model for Insurance Pricing on Tabular Data”
Big Picture: What is this paper about?
This paper introduces a small, smart computer model called Tab-TRM that helps insurance companies set fair prices for policies. It uses the same kind of data you’d see in a spreadsheet (tabular data), like a driver’s age, car type, and where they live, to predict how often claims might happen. The twist: instead of making one big guess, the model makes a first guess and then improves it step by step, like checking your math work multiple times and fixing mistakes as you go.
What questions were the researchers trying to answer?
The researchers focused on a few simple questions:
- Can a very small neural network that “thinks in steps” (recursively) work well for insurance pricing?
- Can it learn from regular spreadsheet-like data without needing huge computers or massive training datasets?
- Will this step-by-step method match or beat popular tools used in insurance, like traditional statistical formulas (GLMs) or modern machine learning (like gradient boosting)?
- Can this approach stay understandable and practical for actuaries and data scientists?
How does the model work? (Methods explained simply)
To understand the approach, think of calculating a fair insurance price like solving a puzzle with clues. The model reads the clues (features) and then:
- Keeps a “guess” token: a compact summary of the current prediction (the answer).
- Keeps a “scratchpad” token: a small memory space where it stores reasoning steps.
It then repeats a two-step loop several times:
- Improve its “scratchpad” using all the features plus the current guess.
- Use the improved scratchpad to make a better guess.
Key ideas explained in everyday language:
- Tokens: Think of each piece of information (like age or car type) as its own card. The model holds two extra special cards: one for the current answer and one for working notes (scratchpad).
- Embeddings: Instead of using raw values (like “Sedan” vs “SUV”), the model turns them into small sets of numbers that capture meaning—so similar things end up close together.
- Recursive updates: The model does small updates repeatedly. It’s like polishing a rough draft into a final essay by going over it a few times.
- Exposure: How long a policy is active (for example, a policy covering 12 months vs. 6 months). More exposure usually means more chance for claims.
- Poisson model: A standard way to model counts (like number of claims). The model is trained to predict these counts correctly, given the features and exposure.
- Loss/deviance: A score that measures how far the predictions are from the real outcomes; lower is better.
Training and setup:
- The model uses standard tools (AdamW optimizer) and an automatic search (Optuna) to find the best settings (like how many steps to refine the guess).
- It was tested on a well-known car insurance dataset from France (French MTPL), which includes information like driver’s age, car characteristics, and claim counts.
What’s different from big, complex models?
- It’s tiny. Instead of many wide layers, it has very small building blocks repeated over and over.
- It doesn’t need fancy attention layers or huge computing power.
- It often works well even when those tiny blocks are just simple linear layers with a small nonlinearity.
What did they find, and why does it matter?
Main findings:
- The tiny, step-by-step approach worked very well for pricing. It produced accurate predictions on the French MTPL dataset.
- Surprisingly, the best setup for the “improve the scratchpad” and “improve the answer” steps used extremely small networks—sometimes just a single linear layer with a small activation—repeated several times.
- By repeating these small updates, the model behaves like a deep model without having tons of parameters. This keeps it efficient and less likely to overfit.
- Using a small ensemble (averaging predictions from several runs) gave a small extra boost in accuracy.
Why this matters:
- It shows that careful, repeated reasoning can beat or match bigger models on spreadsheet-like insurance data.
- It’s practical: small models run fast, are easier to deploy, and need less computing power.
- It connects familiar actuarial ideas (like iterative GLM fitting and stepwise tariff updates) with modern machine learning. In spirit, it’s similar to gradient boosting (adding small improvements step by step), but here the same tiny “improver” is reused each time.
What could this change or improve in the real world?
- Better pricing: Insurers can predict claim frequency more accurately using a compact, understandable model.
- Fairness and stability: The model’s step-by-step updates can be easier to monitor and reason about, which helps with governance and transparency.
- Efficiency: Because it’s small, it’s cheaper and faster to train and run—ideal for single portfolios without needing giant datasets or supercomputers.
- Broader use: The same idea could help in other insurance tasks (like reserving or experience analysis) and more general tabular problems (like credit risk or customer churn).
In short, Tab-TRM shows that “thinking in steps” with a tiny model can be a powerful, practical way to make accurate predictions from regular spreadsheet-like data—especially in insurance pricing, where iterative refinement is already a natural fit.
Knowledge Gaps
Knowledge gaps, limitations, and open questions
Below is a consolidated list of concrete gaps, limitations, and open questions the paper leaves unresolved. Each point is phrased to enable actionable follow-up by future researchers.
- Empirical scope is limited to a single dataset (French MTPL). Extend evaluation across multiple insurance lines (e.g., property, health, workers’ compensation) and geographies to test external validity and robustness to portfolio heterogeneity.
- Benchmarks against leading tabular models are incomplete or truncated. Provide head-to-head comparisons with GLMs (with interactions), XGBoost/LightGBM/CatBoost, TabNet, FT-Transformer, and PINs across standardized splits, reporting Poisson deviance, Gini/lift, calibration curves, and inference latency.
- Only Poisson frequency modeling is considered. Assess performance under overdispersion and zero inflation by testing Negative Binomial, zero-inflated Poisson, and Tweedie (and severity modeling), and evaluate pure premium modeling via joint frequency–severity or compound models.
- Generalization to unseen categorical levels at inference is not addressed (in contrast to ICL-CT). Quantify failure modes and test remedies (e.g., hashing, target/mean encoding with leakage safeguards, meta-embeddings, or in-context augmentation).
- Tokenization and message passing design choices are unexamined. Compare the current flattened FNN core with attention-based token interaction (Transformer-style), pairwise-interaction modules (PINs), and shared vs separate update networks (
f_zvsf_a). - No ablation study is provided. Systematically ablate:
- Piecewise-linear encoding vs raw normalized continuous features
- LayerNorm usage
- Residual connections
- Depth/width of
f_z,f_a, and decoderf_o - Inner/outer recursion counts (
m,T) - Regularization strengths (ℓ1/ℓ2, weight decay) and dropout
- Use of nagging ensembles vs single runs
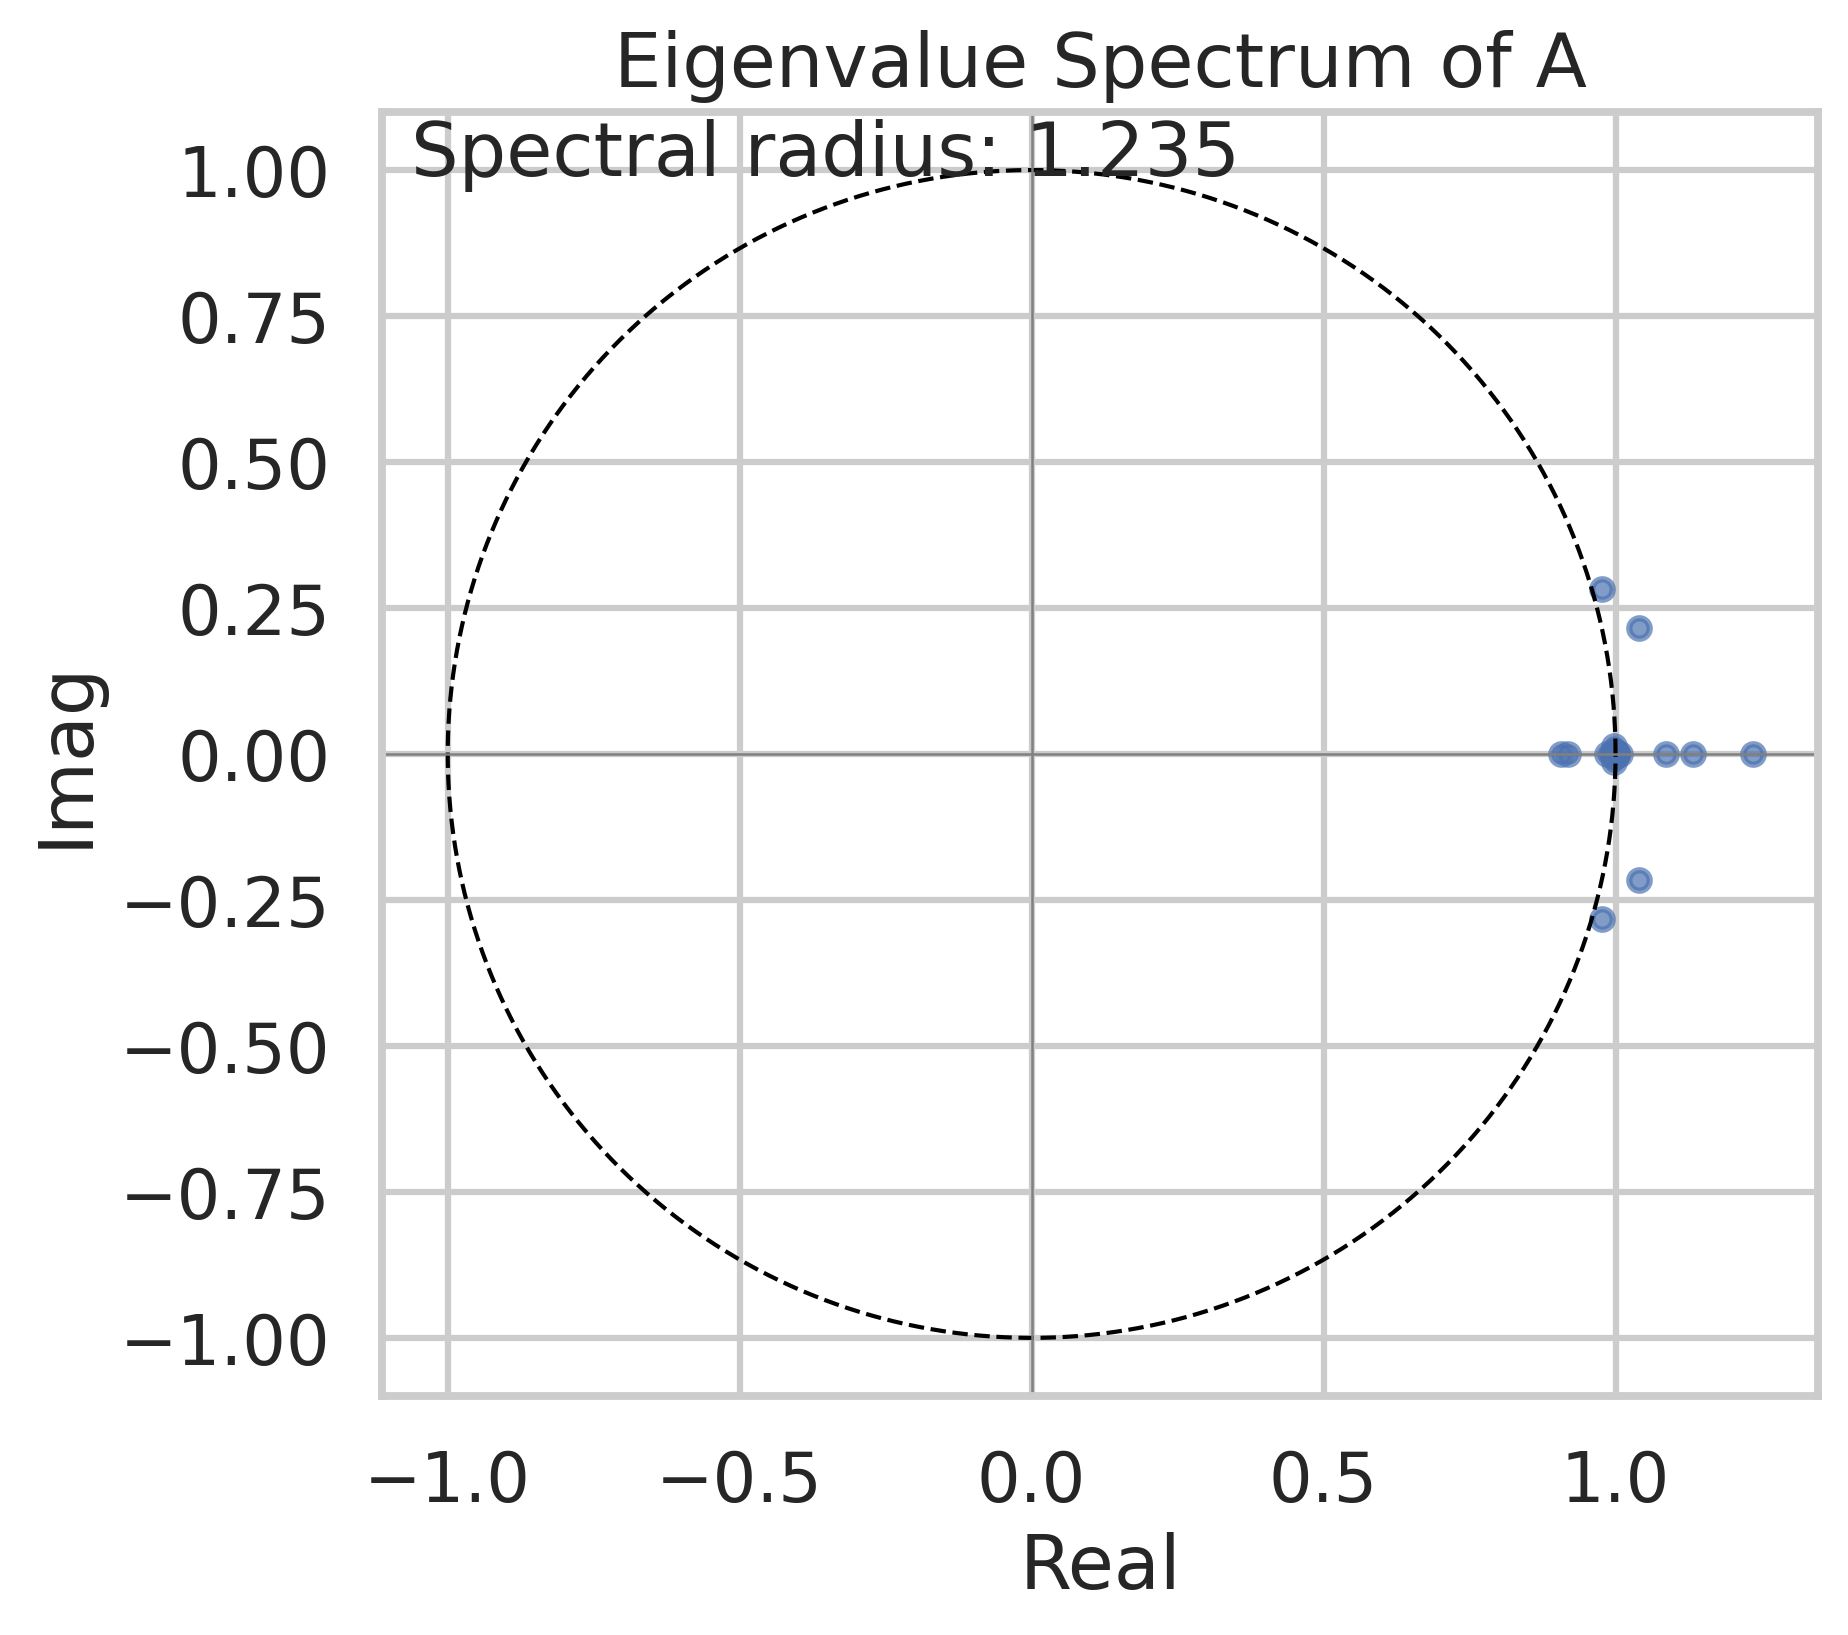
- Convergence and stability of the recursion are not analyzed. Derive and empirically validate conditions (e.g., spectral radius of the linearized transition, effect of LayerNorm) ensuring stable fixed points for given
m,T, and learning rates. - The linearized variant is introduced conceptually but lacks empirical comparison. Quantify trade-offs between linear and nonlinear cores across metrics, and verify the state-space interpretation via controlled simulations (e.g., known synthetic processes).
- Deep supervision and adaptive computation time (ACT) are omitted without evaluation. Test whether intermediate losses or learned halting improve accuracy, calibration, or compute efficiency in tabular settings.
- Initialization of latent tokens
a^{(0)},z^{(0)}is global and learned, but sensitivity is unknown. Study:- Different initialization schemes (random per-policy, stratified by segments)
- Warm-starts from GLM baselines
- Effects on convergence speed, variance, and final performance
- Lack of uncertainty quantification. Provide prediction intervals and uncertainty estimates via bootstrapping, ensembling, Bayesian variants, or approximate posterior methods; assess calibration of intervals and implications for pricing risk loading.
- Interpretability of latent tokens (
a,z) is under-specified. Develop tools to:- Map
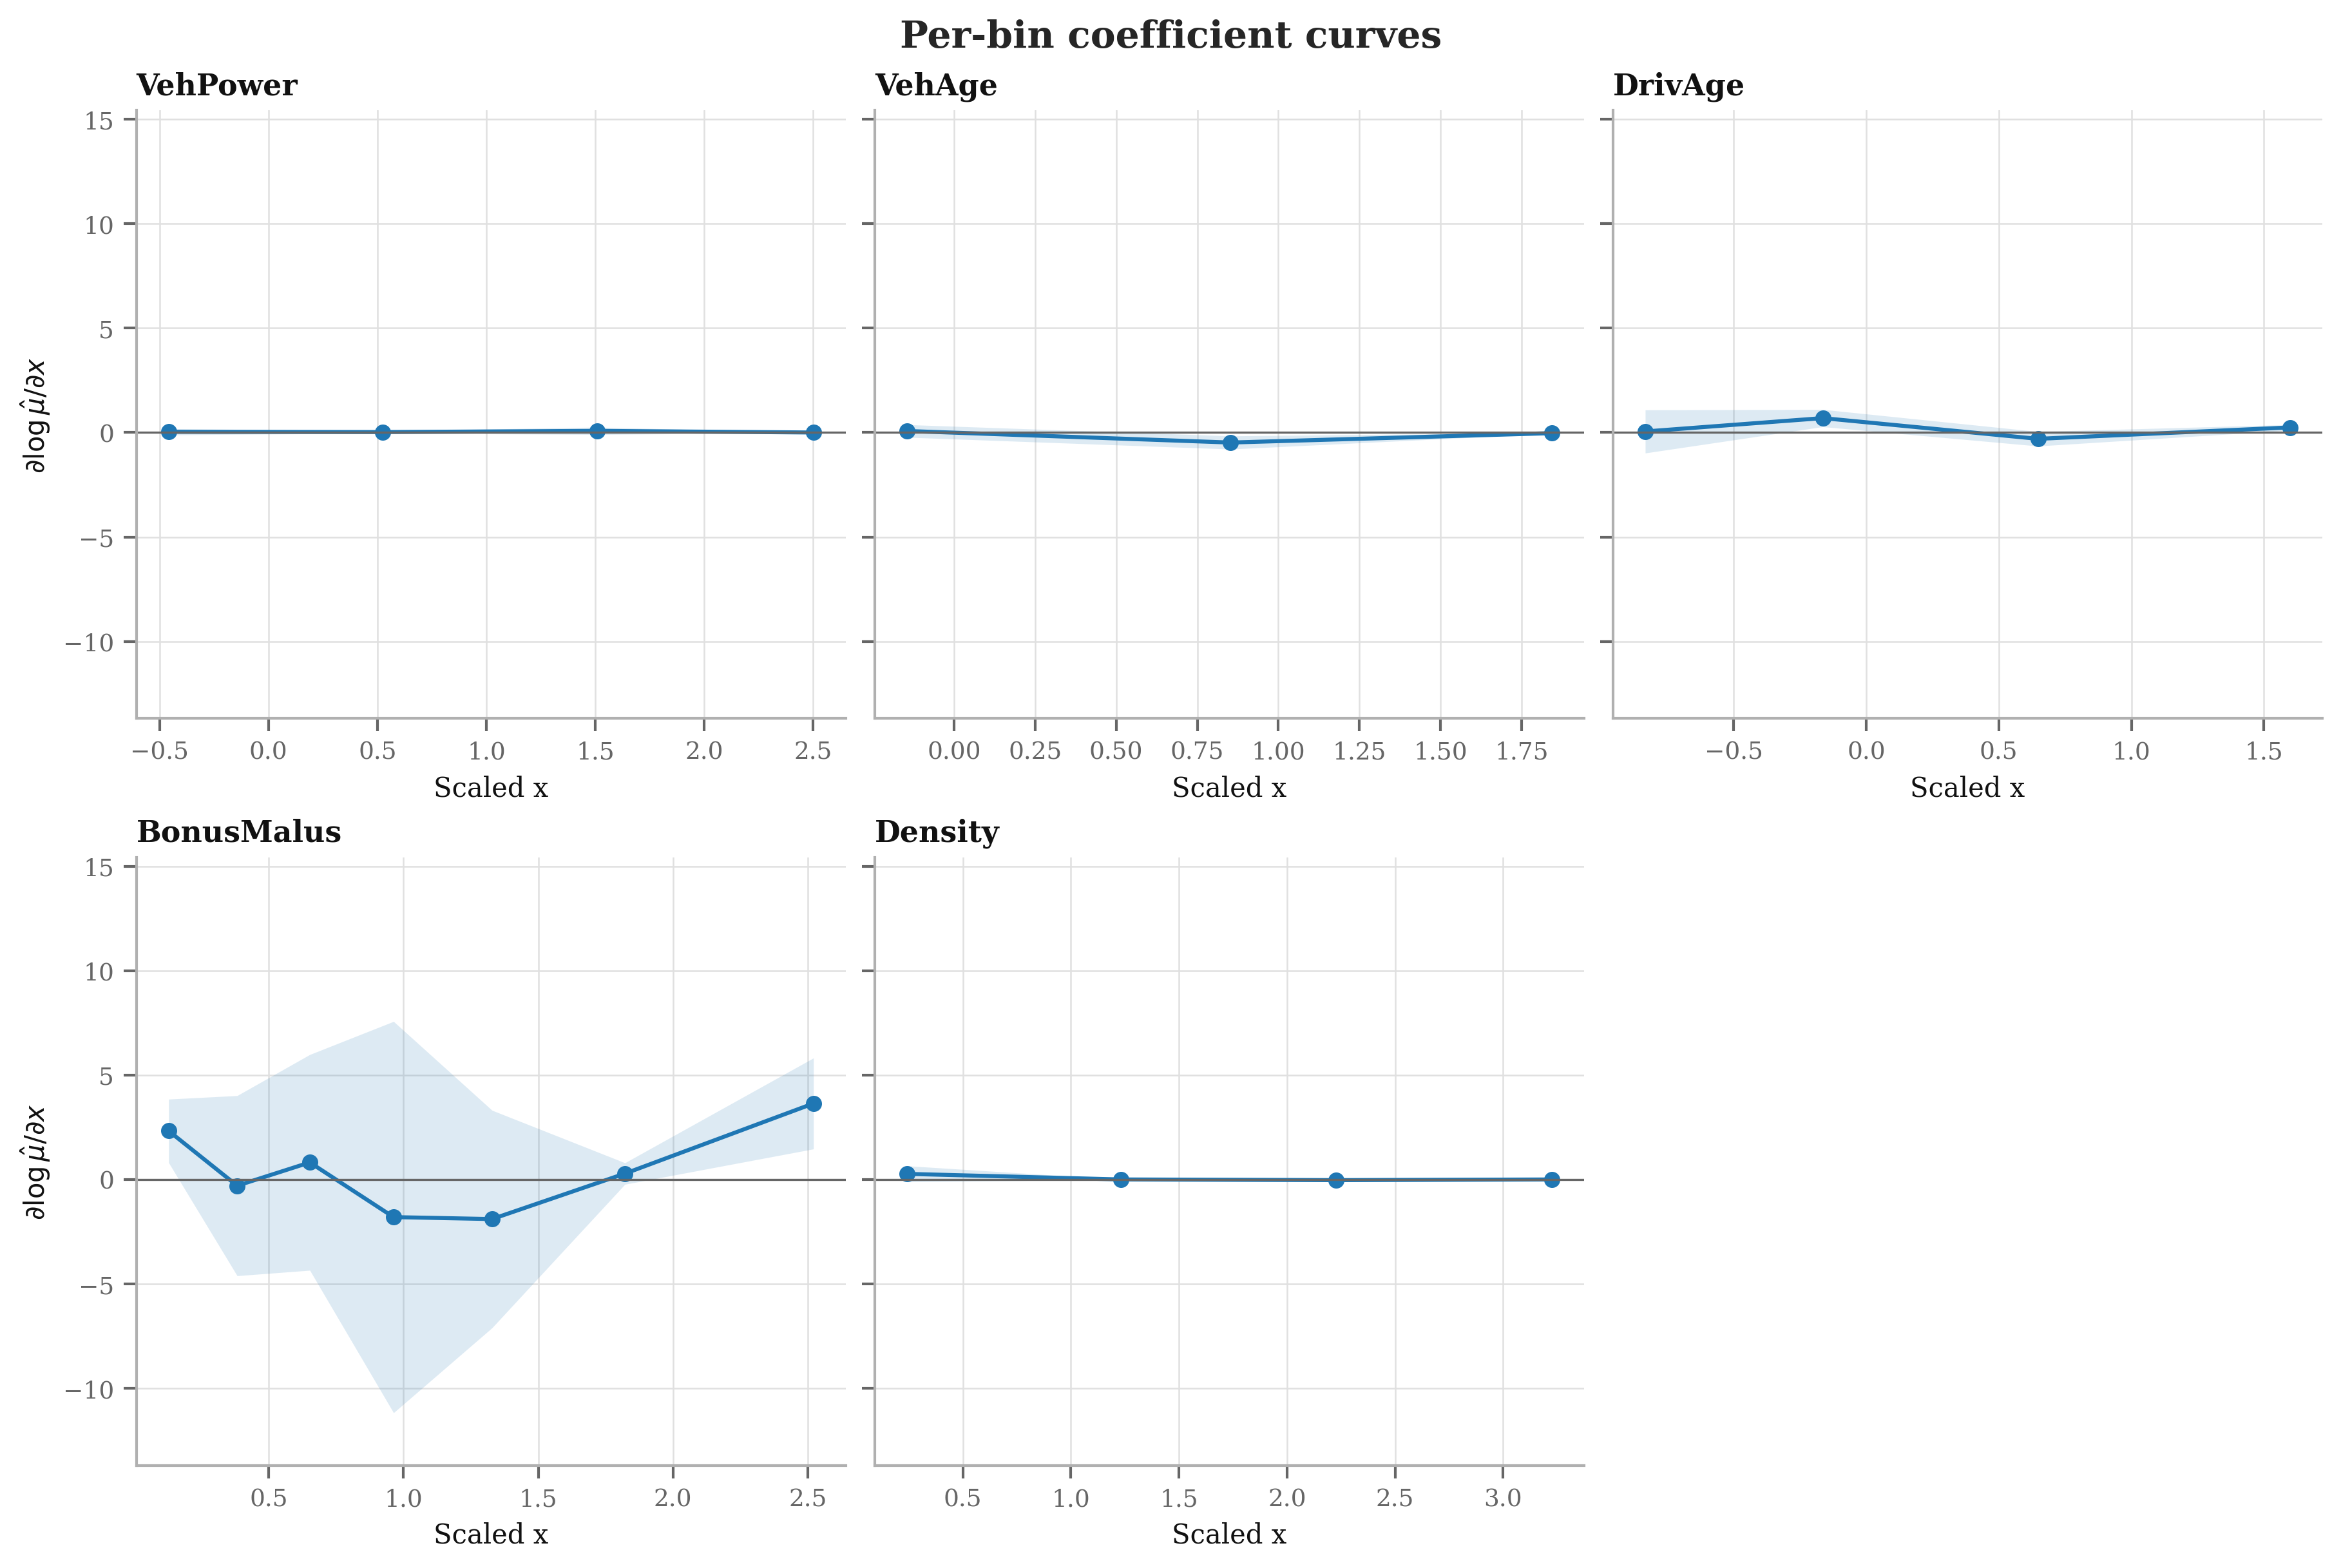
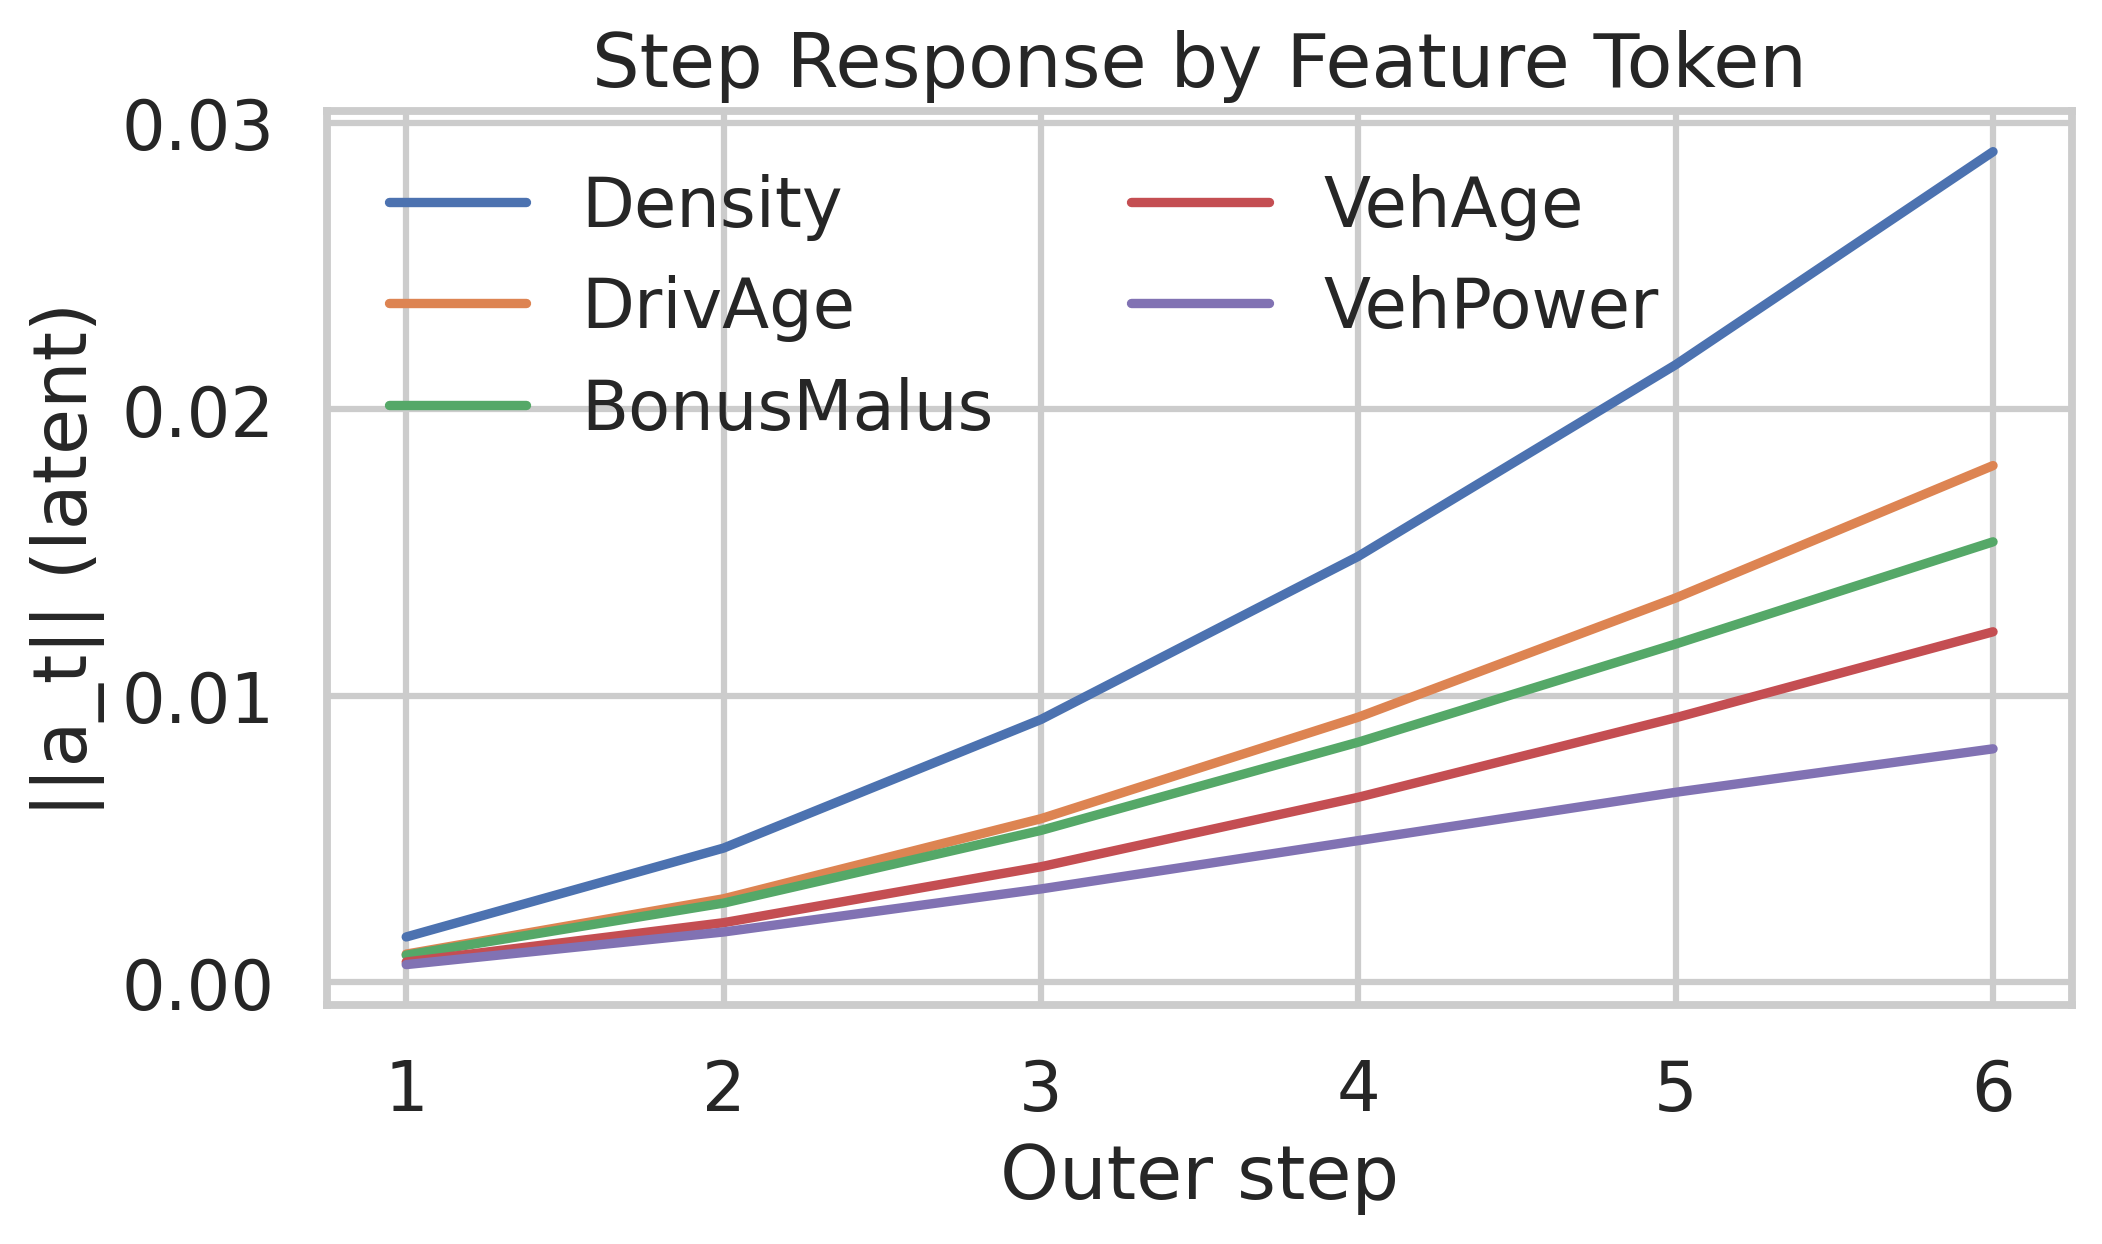
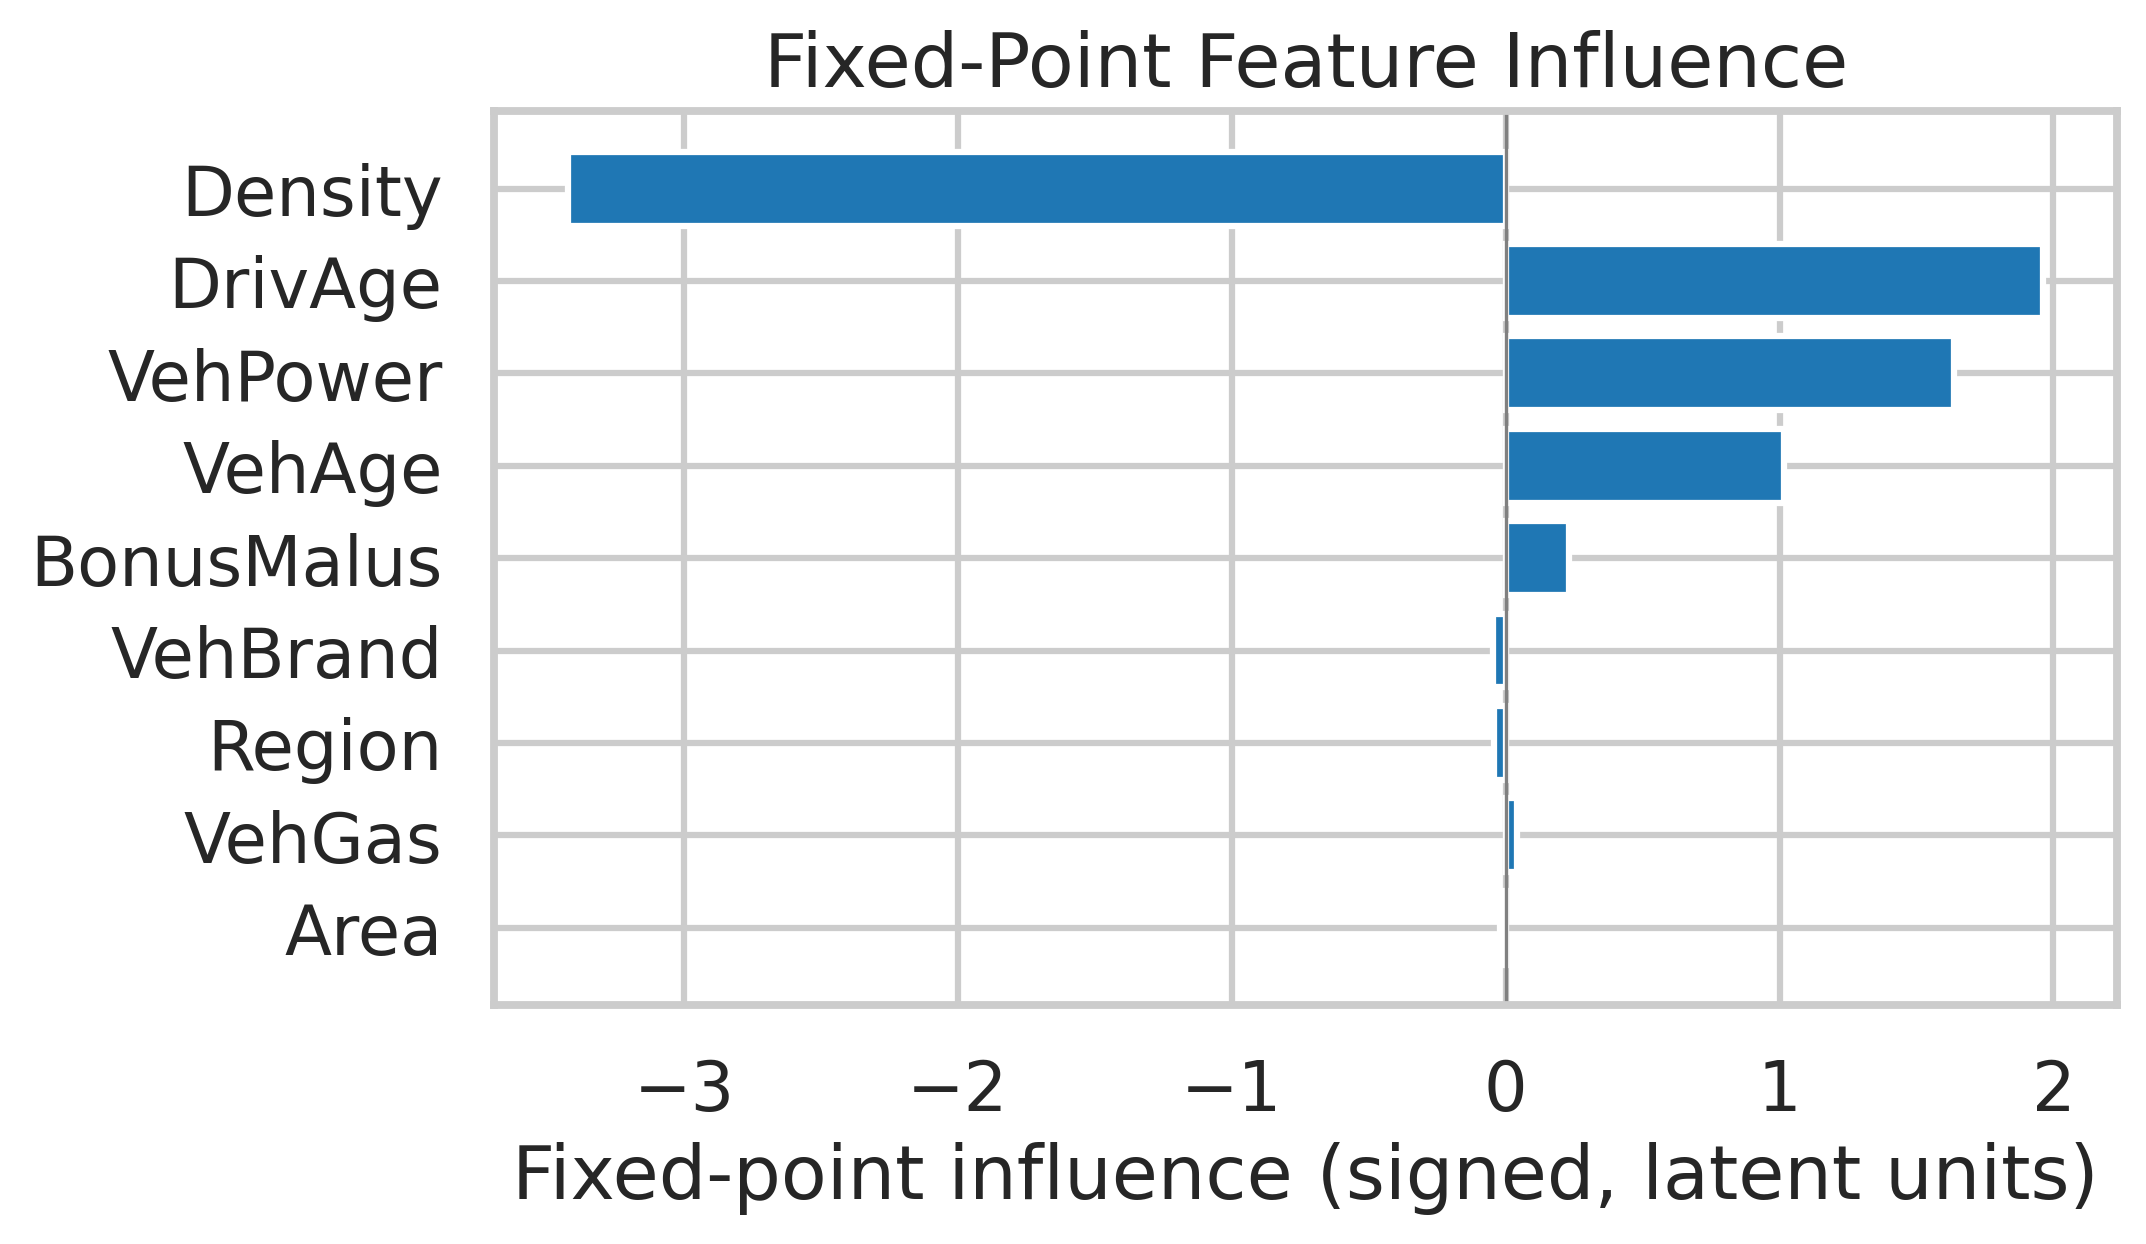
aandztrajectories to tariff relativities or GLM-like coefficients - Probe feature influence over recursion steps (temporal PDPs/SHAP)
- Audit stability of learned representations across seeds and portfolios
- Map
- Regulatory and actuarial governance aspects (constraints) are not considered. Investigate:
- Monotonicity constraints for specific rating factors
- Bounds and smoothness on relativities
- Stability across retraining cycles
- Documentation and auditability requirements
- Calibration beyond deviance is not reported. Provide calibration plots (observed vs predicted by deciles of risk), Brier scores, normalized Gini, and segment-level calibration (e.g., by region, vehicle type, age bands).
- Robustness to preprocessing choices is unclear. Evaluate sensitivity to:
- Quantile-based clipping parameters and decile grid selection
- Exposure extremes (
v_i) and outliers - Rare categorical levels and missing values
- Distribution shift and temporal drift are not studied. Test performance under covariate shift (e.g., new policy mix, macro trends) and propose drift detection and adaptive retraining strategies.
- Computational profile is not provided. Report training/inference time, memory footprint, and energy vs GBMs and FNN baselines; assess scalability when
L(number of tokens) grows beyond 20–50. - Cross-validation and statistical significance are not reported. Use repeated k-fold CV or multiple train/test splits, confidence intervals for deviance differences, and formal tests to support claims of superiority.
- Choice of loss and offsets is narrow. Explore alternative objectives (e.g., weighted deviance, focal losses for rare-claim segments), different exposure treatments (log-offset vs scaled loss) and their impact on calibration.
- The effect of ensembling (nagging) indicates variance reduction but variance sources are not analyzed. Quantify seed sensitivity, parameter variance across runs, and whether recursion depth amplifies or dampens variance.
- Interaction modeling is implicit via recursion but not audited. Provide explicit interaction analyses (e.g., bivariate PDPs, ICE curves) to verify learned nonlinear interactions and compare to GBM-discovered interactions.
- Data leakage safeguards are not detailed. Confirm that quantile/clipping and decile grids are derived strictly from training data and evaluate robustness when validation/test distributions differ.
- Portability to different schema lengths and missing tokens is untested. Evaluate handling of variable-length feature sets, missing features, and schema evolution (added/removed tariff factors).
- Practical deployment guidance is absent. Offer guidance on:
- Hyperparameter tuning budgets and defaults
- Retraining cadence and monitoring KPIs
- Rollout strategies (champion/challenger, shadow mode)
- Backtesting on historical pricing decisions
- Ethical/fairness considerations are not examined. Assess disparate impact across protected groups, introduce fairness constraints or regularization, and audit bias in embeddings and latent dynamics.
Practical Applications
Immediate Applications
The following applications can be deployed with current tools and workflows (Keras/TensorFlow or PyTorch), using standard tabular ML pipelines, entity embeddings, and Poisson deviance training with exposure offsets.
- Insurance (non-life, pricing) — compact replacement/augment for GLMs and GBMs
- What: Use Tab-TRM to estimate claim frequencies with exposure offsets for auto/property lines; drop-in for Poisson GLM workflows to improve deviance while retaining actuarial structure (log-link, offsets, tariff factors).
- Why: Demonstrated competitive performance on the French MTPL benchmark with a very small model; robust to high-cardinality categorical factors via entity embeddings; parameter-efficient and fast to train.
- Tools/products/workflows:
- Tab-TRM pricing module in rating engines (Python microservice with REST API).
- Optuna-backed training pipeline with early stopping and “nagging” ensembling.
- PLE-based factor curves for continuous features (exportable as rating curves).
- Assumptions/dependencies: Poisson frequency assumption and independence across policies; adequate exposure data; proper regularization for rare categorical levels; internal model governance for neural methods.
- Insurance (actuarial tariff refinement and scenario analysis)
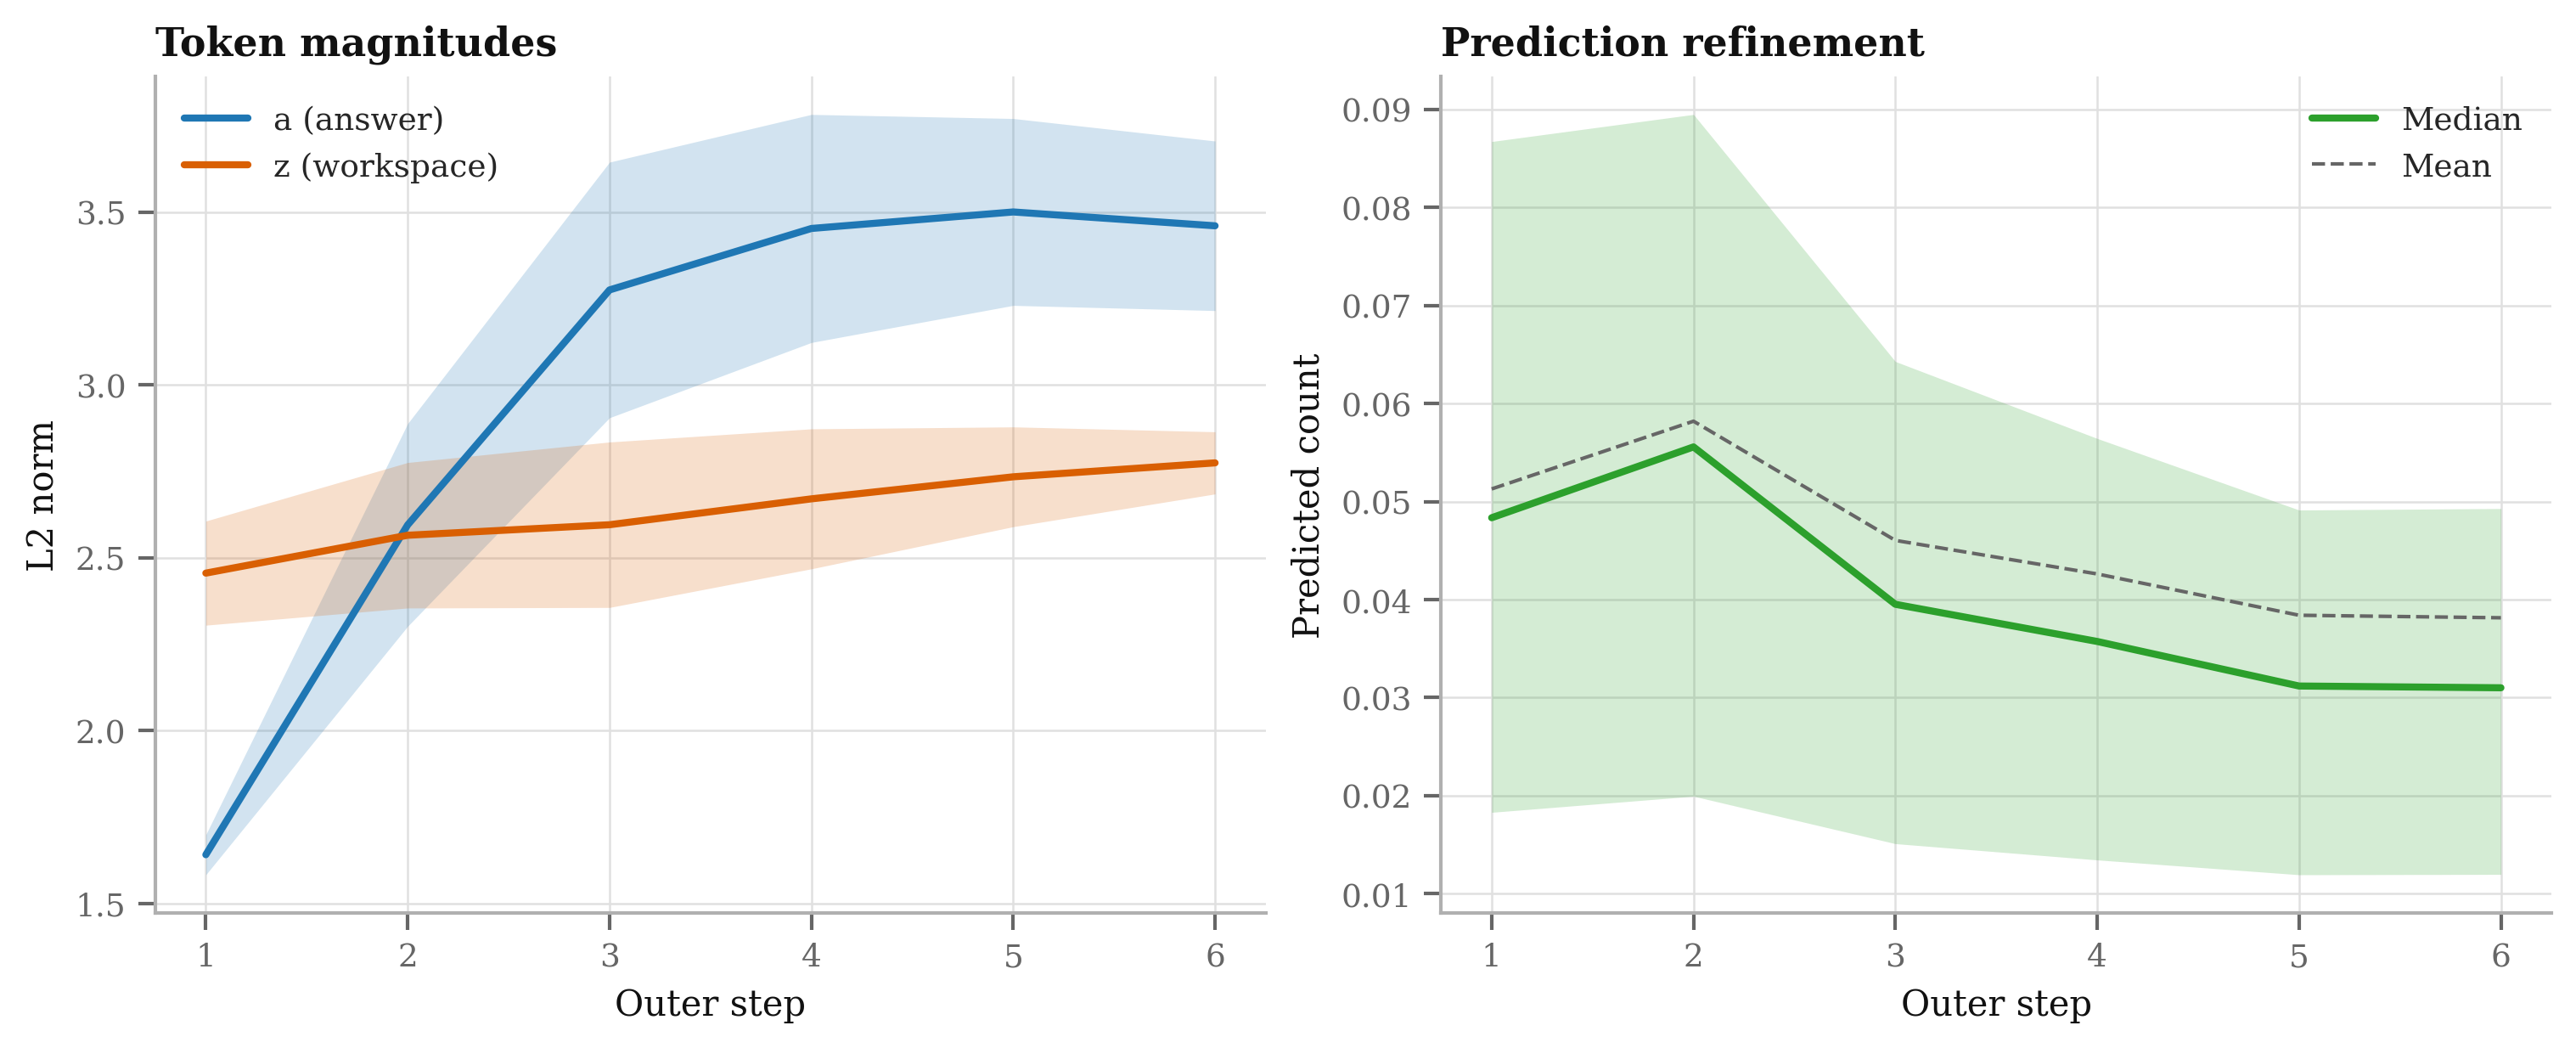
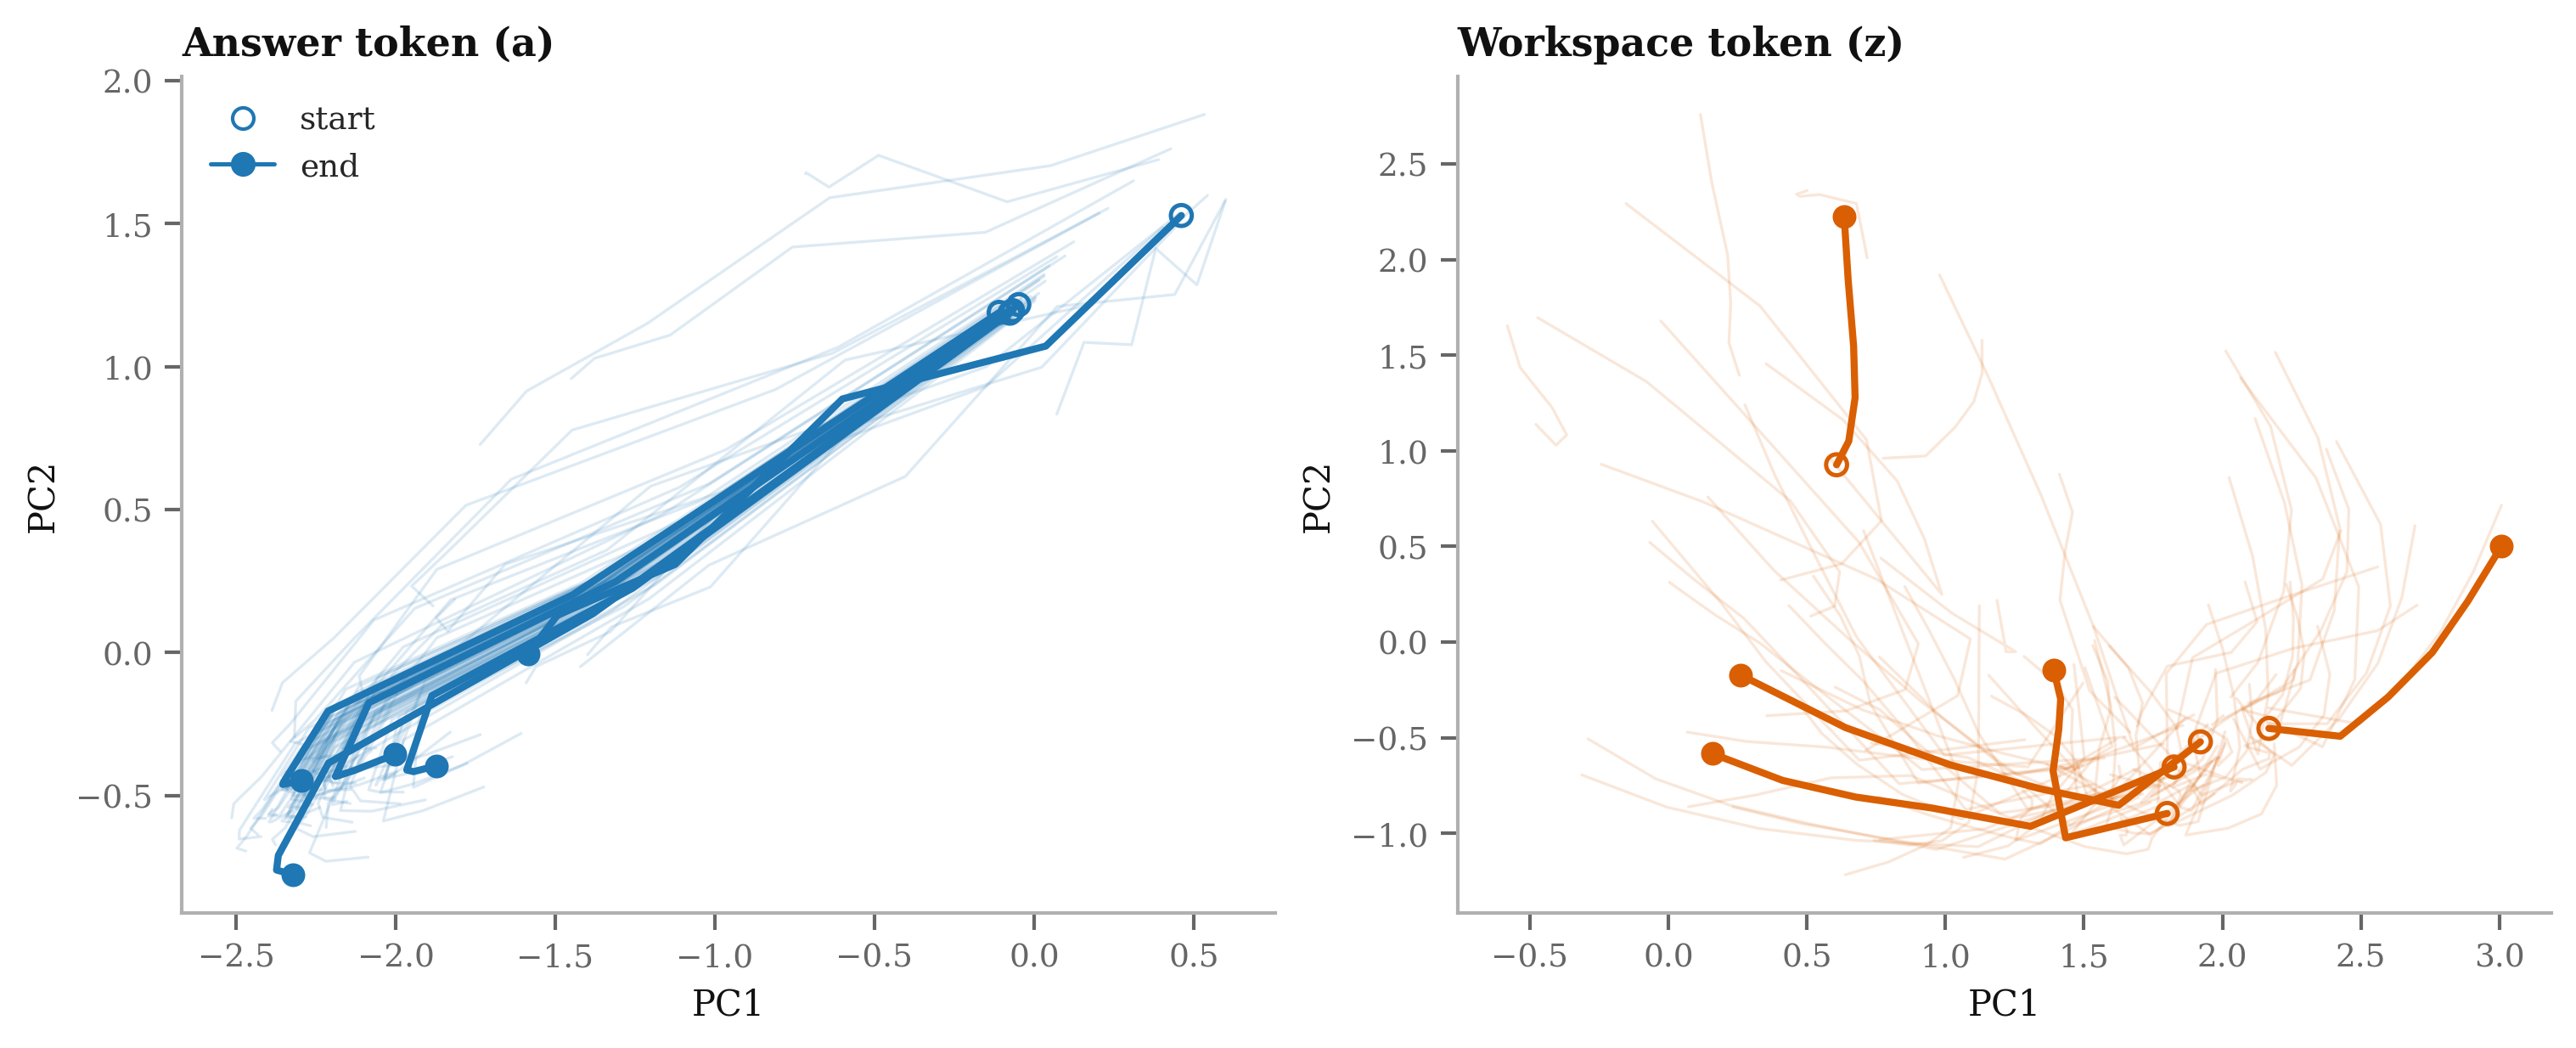
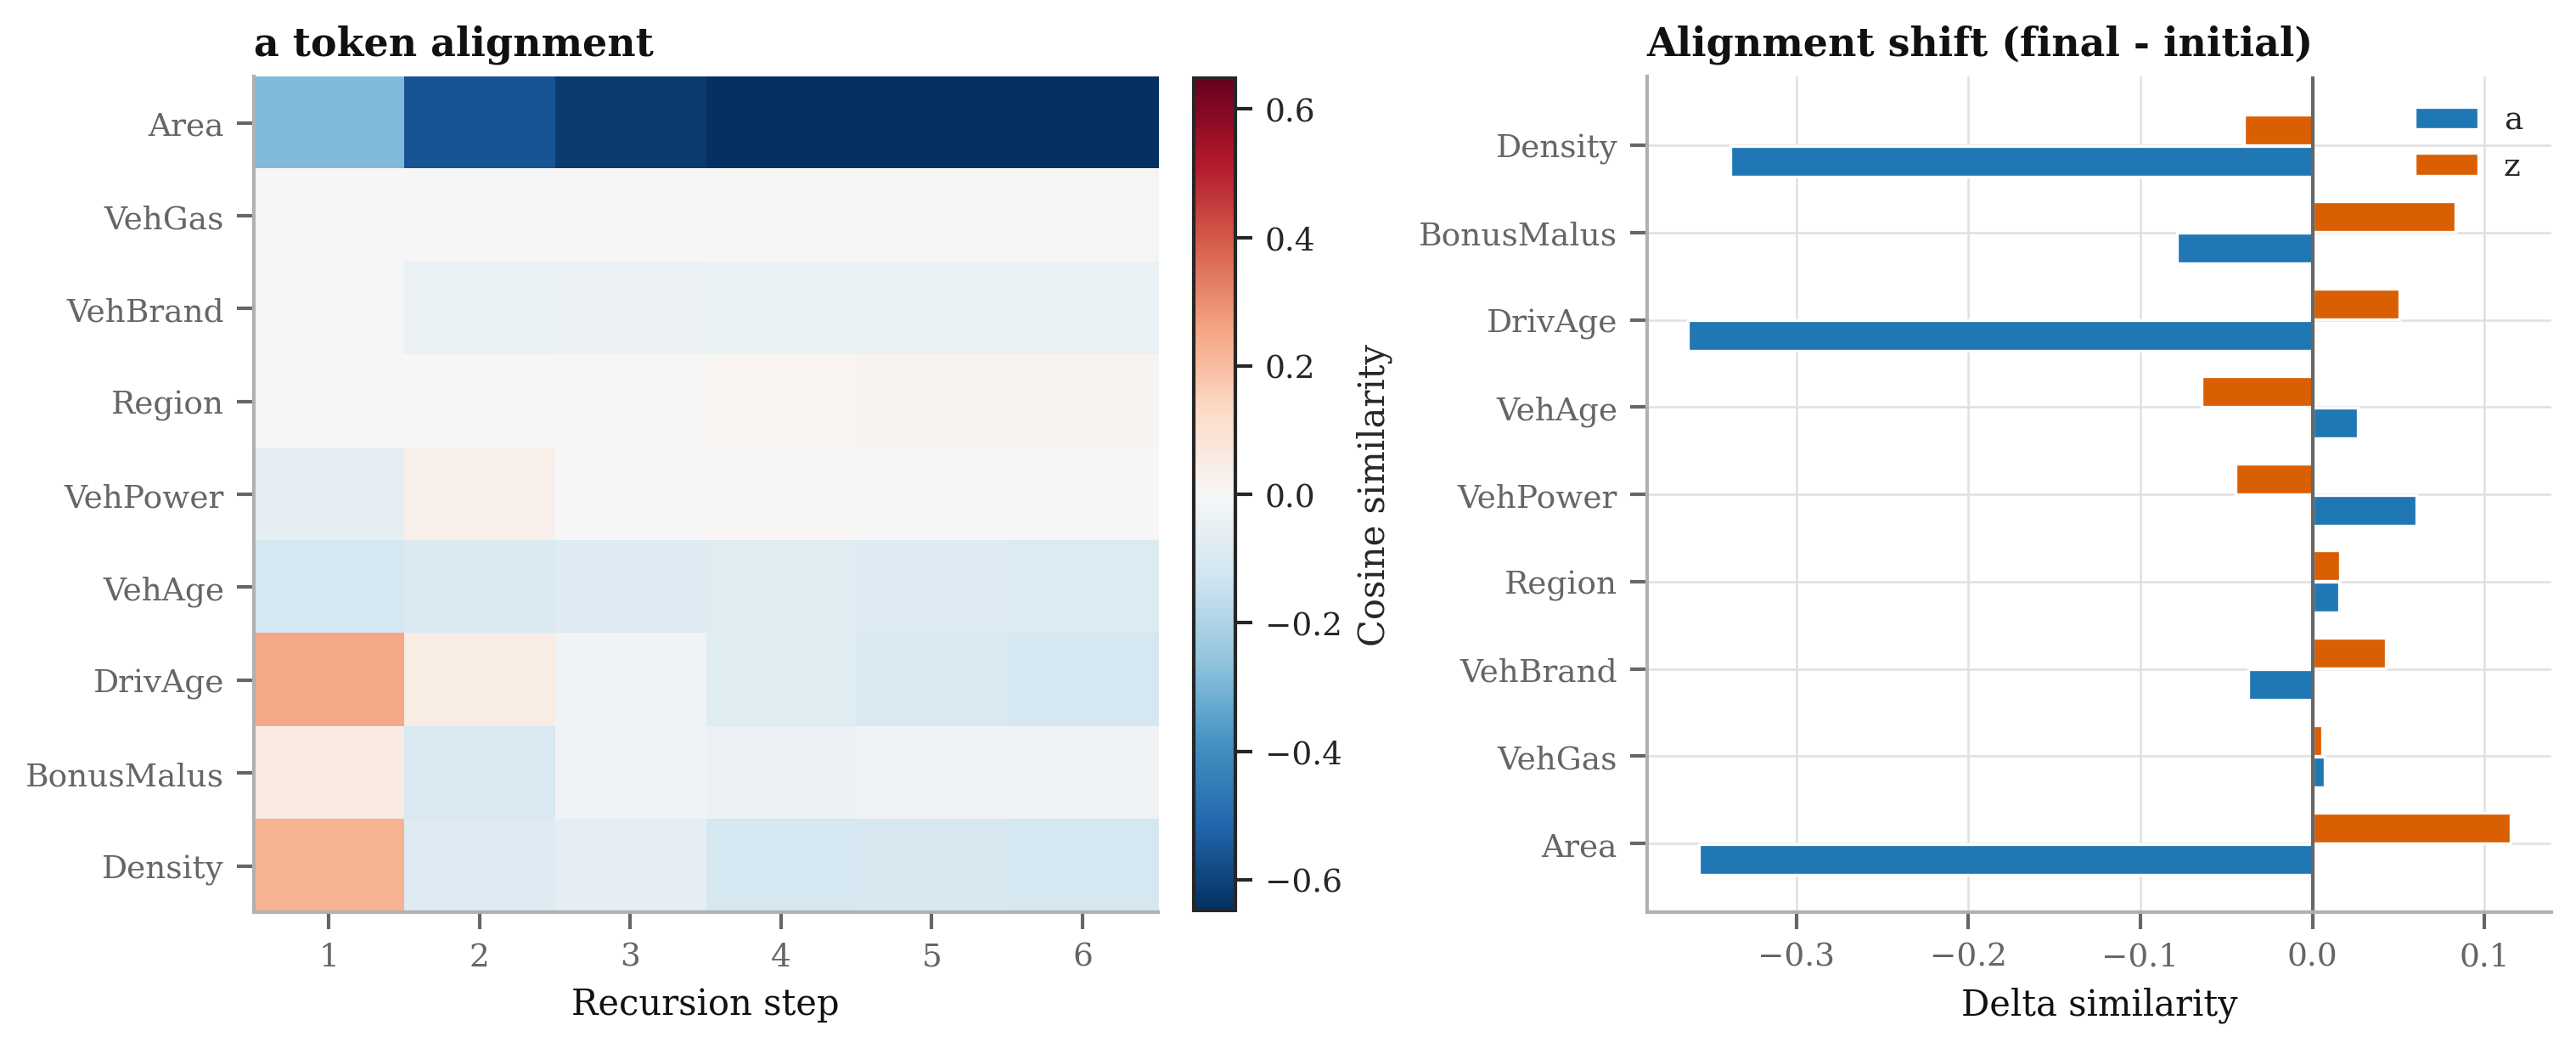
- What: Use the recursive “answer” and “reasoning” tokens to iteratively refine multiplicative tariffs, mirroring iterative GLM/minimum-bias adjustments and boosting-like updates.
- Why: The inner/outer loops act as a learned improvement operator, enabling stagewise corrections akin to GBM but with shared parameters and small footprint.
- Tools/products/workflows:
- “Recursive Tariff Calibrator”: visualize changes in predicted log-rate after each outer step.
- “Latent Reasoning Explorer”: track the z-state to diagnose how features interact across iterations.
- Assumptions/dependencies: Requires internal interpretability tooling (e.g., per-step deltas, sensitivity analysis); training stability tuning for m and T.
- Insurance (experience analysis and reserving prototypes)
- What: Adapt the loss function and link for related actuarial tasks (e.g., NegBin/Tweedie for overdispersion or severity, piecewise hazard for experience).
- Why: Architecture and tokenization are directly reusable for tabular outcomes beyond Poisson frequency.
- Tools/products/workflows:
- Tab-TRM “loss plug-ins” for Tweedie, Gamma, Logistic.
- Shared embedding layers across pricing/experience models.
- Assumptions/dependencies: Requires selecting appropriate deviance/loss and offsets; validate calibration; consider overdispersion.
- Finance (credit risk and fraud screening on tabular data)
- What: Use Tab-TRM as a compact alternative to GBMs for PD/propensity prediction or fraud classification with categorical-heavy features.
- Why: Entity embeddings capture high-cardinality attributes (e.g., merchant IDs); recursion captures interactions with few parameters.
- Tools/products/workflows:
- Real-time scoring service with small-latency footprint.
- Model cards documenting exposure-equivalent offsets (if any) and calibration.
- Assumptions/dependencies: Replace Poisson deviance with logistic/binary cross-entropy; sector-specific governance (fairness, reason codes).
- Healthcare (utilization frequency modeling and risk stratification)
- What: Model counts of events (visits, admissions) with exposure (member-months) using Poisson/NegBin.
- Why: Same tabular structure; compactness favors on-prem/secure deployments.
- Tools/products/workflows:
- HIPAA-compliant on-prem inference.
- PLE-based shape-constrained curves for age/comorbidity features.
- Assumptions/dependencies: Domain regulatory compliance; evaluate overdispersion; fairness auditing.
- MLOps and model governance for tabular deep learning
- What: Productionize Tab-TRM with reproducible hyperparameter search, checkpoints, and light-weight ensembling.
- Why: Small model size reduces infra cost and simplifies deployment.
- Tools/products/workflows:
- Optuna search templates; early stopping; LR schedulers.
- Drift/OOD monitoring for categorical embeddings.
- Assumptions/dependencies: Team familiarity with Keras/TensorFlow; CI/CD integration; governance templates for neural models.
- Education and training (academia/actuarial programs)
- What: Teaching module that bridges GLM, GBM, and deep learning via Tab-TRM’s state-space and recurrent boosting interpretations.
- Why: Clear conceptual link to IRLS/minimum-bias methods; small models fit on laptops.
- Tools/products/workflows:
- Classroom notebooks demonstrating PLE, embeddings, recursion, and Poisson deviance.
- Assumptions/dependencies: Open datasets (e.g., French MTPL) and basic GPU/CPU resources.
Long-Term Applications
The following require additional research, sector validation, scaling, or governance development before widespread deployment.
- Insurance (joint frequency–severity and full pricing stacks)
- What: Multi-task Tab-TRM for joint modeling (frequency, severity, claim cost), with shared embeddings and recursive refinement.
- Why: End-to-end consistent pricing; potential for improved total loss prediction.
- Tools/products/workflows:
- Multi-head decoders (Poisson/Gamma/Tweedie).
- Uncertainty quantification add-ons (e.g., bootstrap, Bayesian heads).
- Assumptions/dependencies: Careful calibration and dependence modeling; governance for joint loss models.
- Cross-portfolio/tabular “foundation” models
- What: Pretrain a Tab-TRM backbone on multiple portfolios, then fine-tune to specific books to improve cold-start and rare-level performance.
- Why: Parameter-efficient recursion may generalize well with limited per-portfolio data.
- Tools/products/workflows:
- Privacy-preserving pretraining (federated or synthetic data augmentation).
- Assumptions/dependencies: Data-sharing constraints; robustness to domain shift; privacy.
- In-context and credibility-enhanced variants
- What: Combine Tab-TRM with context batches (ICL-CT-style) and credibility tokens to handle unseen categories and local adaptation.
- Why: Generalize to new segments and geographies without full retraining.
- Tools/products/workflows:
- Retrieval of similar risks at prediction time; hybrid credibility in latent space.
- Assumptions/dependencies: Additional infrastructure for context retrieval; latency budgets; careful validation of OOD behavior.
- Adaptive computation time (compute-aware halting)
- What: Add an ACT/halting head to stop recursion early on “easy” cases and spend more steps on “hard” ones.
- Why: Reduce average latency and cost while preserving accuracy.
- Tools/products/workflows:
- Halting head and TTC budget controls; cost-aware scoring policies.
- Assumptions/dependencies: Stability of training with ACT; predictability of latency; governance for variable compute.
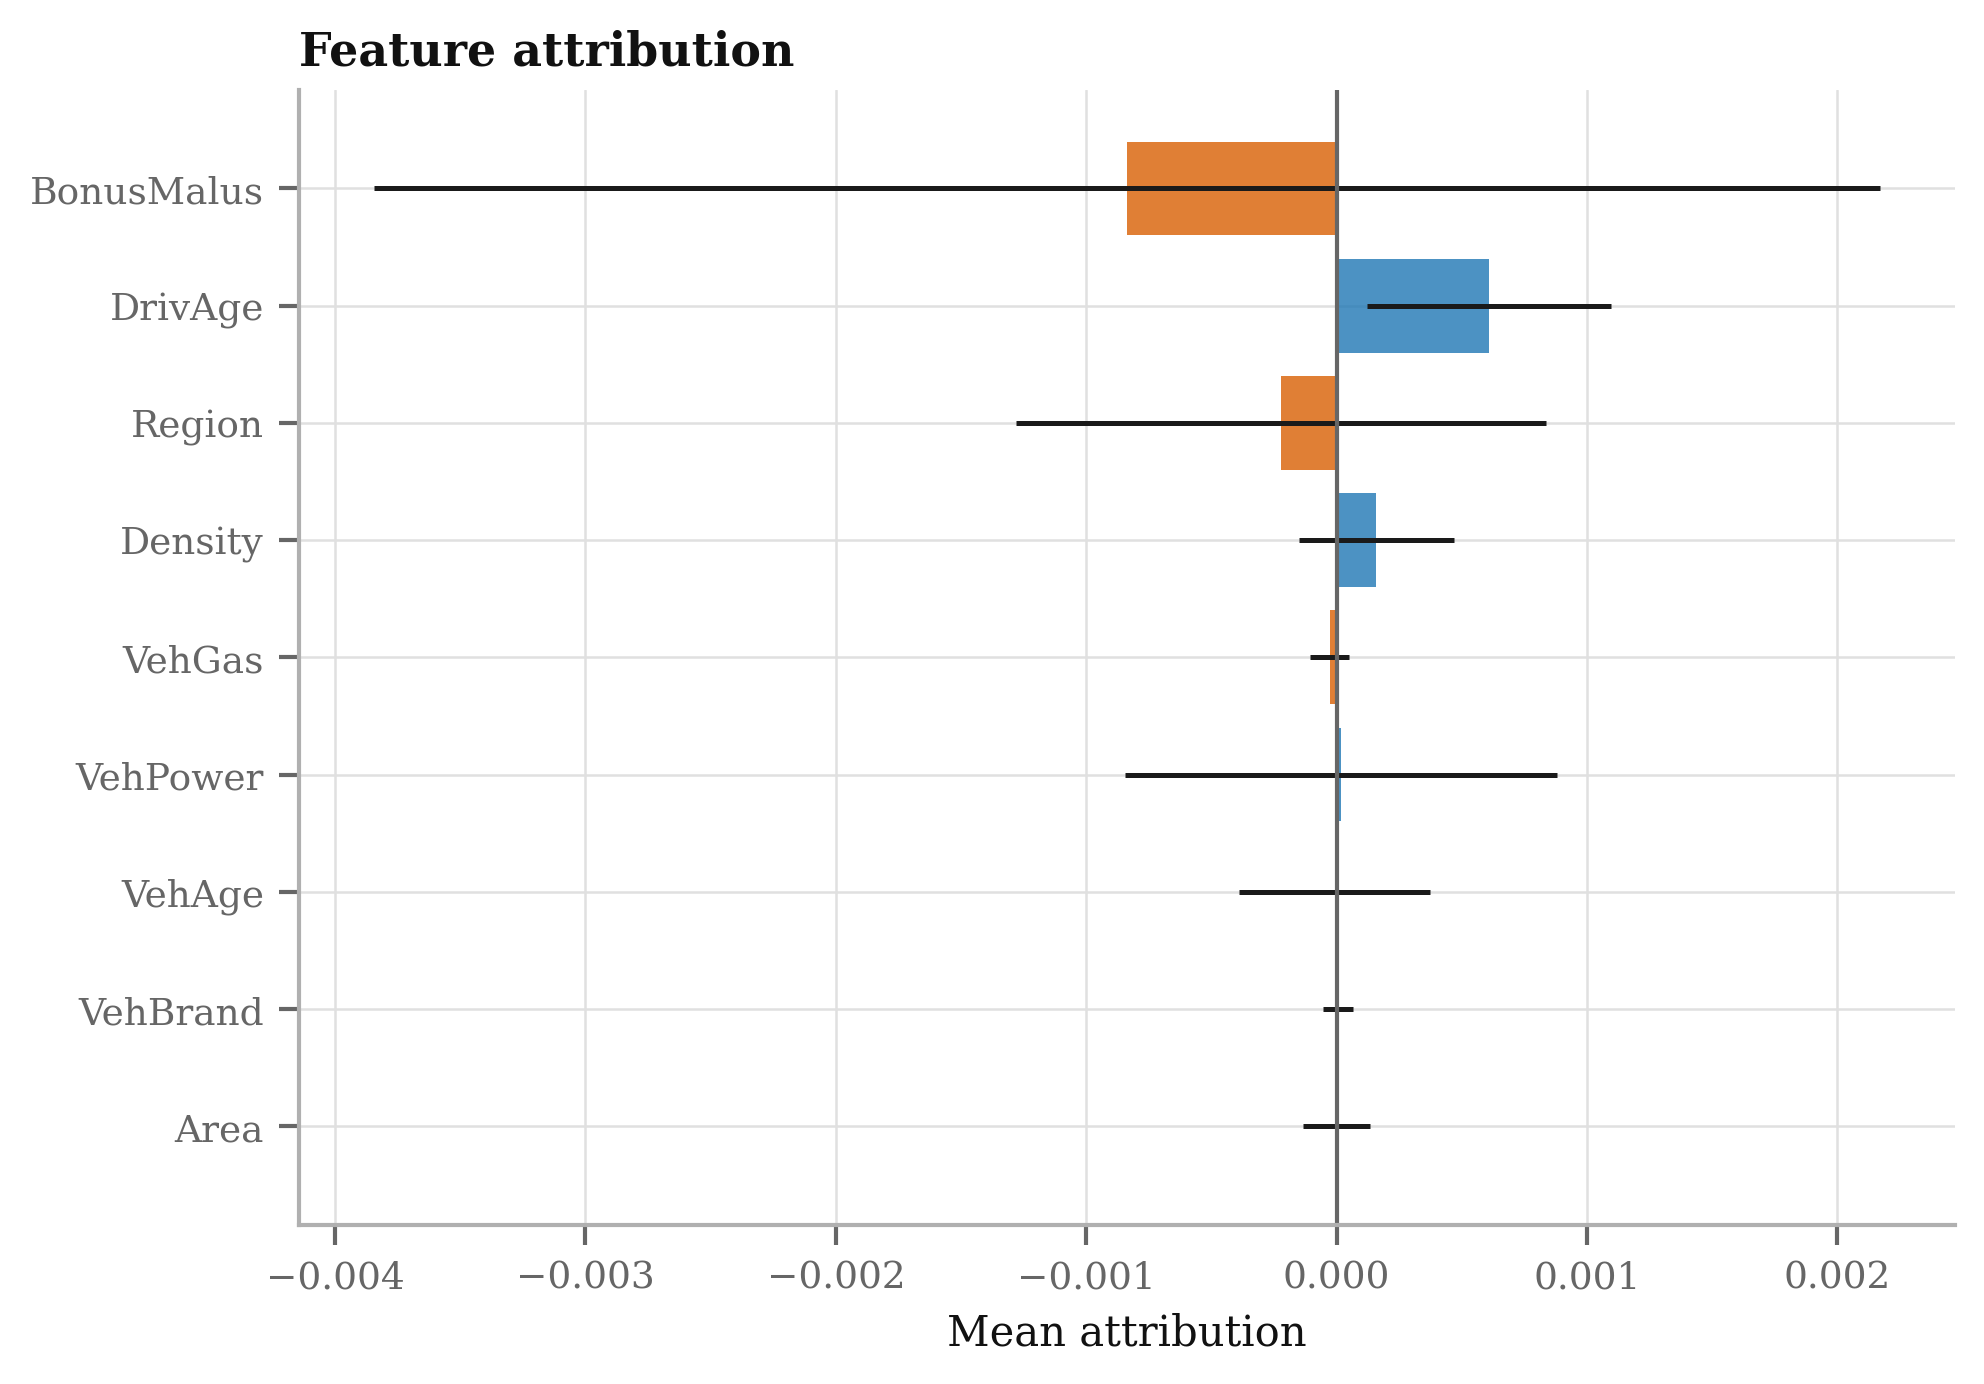
- Regulatory-grade interpretability and reason codes
- What: Standardized explanations for recursive models (e.g., per-iteration feature attributions, monotonic constraints on PLEs).
- Why: Needed for pricing filings and fairness audits in regulated markets.
- Tools/products/workflows:
- Per-step SHAP/IG approximations; monotonicity constraints on rating curves; audit dashboards showing iteration-wise adjustments.
- Assumptions/dependencies: Agreement on acceptable explanation standards; computational cost of attributions.
- Dynamic pricing and real-time underwriting
- What: On-device/mobile or edge inference for quote generation and iterative “what-if” exploration with underwriters or customers.
- Why: Tiny model supports low-latency interactive experiences.
- Tools/products/workflows:
- Embedded inference (TF Lite/ONNX) and interactive scenario simulators driven by a/z token trajectories.
- Assumptions/dependencies: UI/UX development; tight latency SLAs; offline model updates and monitoring.
- State-space control and stability tooling
- What: Use linearized state-space analysis to enforce stability (eigenvalue constraints) and shape latent dynamics.
- Why: Improve robustness and interpretability of recursive updates.
- Tools/products/workflows:
- Spectral regularization; diagnostics for convergence of a/z sequences; constraint-aware training loops.
- Assumptions/dependencies: Added complexity in training; need for theory–practice alignment on constraints.
- Fairness and compliance toolchain for tabular recursion
- What: Bias detection/mitigation at both embedding and recursive-update levels (pre-, in-, post-processing).
- Why: Required for deployment in sensitive domains (insurance, credit, healthcare).
- Tools/products/workflows:
- Group/individual fairness metrics; constrained optimization; counterfactual testing; OOD safety checks.
- Assumptions/dependencies: Access to protected attribute proxies; organization-wide compliance processes.
- Enterprise integration and ecosystem products
- What: Suite of products around Tab-TRM:
- “Rating Engine Plugin” (low-latency scoring + offsets).
- “Recursive Tariff Studio” (per-step refinement visualization).
- “Auto-TRM Builder” (Optuna-based hyperparameter search, nagging ensemble, governance reports).
- Why: Streamlines adoption across pricing teams.
- Assumptions/dependencies: Vendor integration; IT security and data pipelines; change management across actuarial and underwriting teams.
Glossary
- Adaptive Computation Time (ACT): A mechanism that dynamically determines how many reasoning steps a model should apply to each example. "Second, an adaptive computational time (ACT) mechanism is introduced, whereby a Q-learning based halting head decides how many supervision steps to apply to each example, with an extra forward pass used to define the continuation target."
- AdamW optimizer: A variant of Adam that decouples weight decay from the gradient-based update for better regularization. "We implement Tab-TRM in Keras and train it with the AdamW optimizer (decoupled weight decay)"
- Backpropagation-through-time: A training technique for recurrent computations that backpropagates gradients through unrolled time steps. "rather than relying on very long backpropagation through time."
- Bühlmann credibility: An actuarial method that blends individual and portfolio-level information to produce credible rate estimates. "mirroring B\"uhlmann credibility inside an attention mechanism"
- Chain-of-thought (CoT) prompting: A technique that encourages models to generate intermediate reasoning steps before final answers. "popularized as chain-of-thought (CoT) prompting"
- Credibility Theory: An actuarial framework for combining different sources of information weighted by their credibility. "Keywords: Tiny Recursive Models, Hierarchical Reasoning, Insurance Pricing, Regression, Tabular Deep Learning, Credibility Theory, Recursive Neural Networks"
- Credibility Transformer: A Transformer-based architecture tailored to tabular insurance data with a special credibility token. "The Credibility Transformer adapts the Transformer architecture to tabular insurance data by embedding each covariate as a token and introducing a special credibility token."
- Credibility-weighted average: An averaging scheme where weights reflect the credibility of different information sources. "This token combines global portfolio information with observation-specific information through a credibility-weighted average, mirroring B\"uhlmann credibility inside an attention mechanism"
- Deep equilibrium models: Implicit deep models where outputs are fixed points of a transformation, with specialized gradient approximations. "together with a one-step gradient approximation derived from deep equilibrium models"
- Deep supervision: A training strategy that applies losses at multiple intermediate steps to guide learning. "First, deep supervision is used: the model is trained over multiple “supervision steps”, with reuse of the latent states across steps and per-step losses"
- Entity embeddings: Learned dense vectors representing categorical levels, improving generalization and handling high cardinality. "categorical variables can be mapped into low-dimensional continuous entity embeddings learned jointly with the prediction task."
- Exposure (time at risk): The amount of time or measure over which risk is accumulated for an insurance policy. " is the exposure (time at risk)"
- Exposure offset: A GLM adjustment that accounts for differing exposure by including it as a fixed component in the linear predictor. "deep learning models tailored to actuarial structure - exposure offsets, credibility, tariff factors - can be both accurate and interpretable."
- GELU (Gaussian Error Linear Unit): A smooth, non-linear activation function commonly used in modern neural networks. "The depth of each FNN is a hyper-parameter (0--5 hidden layers) with GELU activation function;"
- Generalized Linear Model (GLM): A flexible statistical model that relates a transformed mean of the response to linear predictors. "complement or alternative to classical generalized linear models (GLMs);"
- Gradient Boosting Machines (GBMs): Ensemble methods that build additive models by sequentially fitting weak learners to residuals. "gradient boosting machines (GBMs) - in particular XGBoost - have become a de facto benchmark for predictive performance on tabular insurance data."
- Hierarchical Reasoning Model (HRM): A recurrent Transformer architecture with multi-scale latent states refined iteratively. "The HRM of \citet{wang2025hrm} is a recurrent Transformer architecture with two interacting latent states "
- In-context learning (ICL): The ability of a model to adapt its behavior by conditioning on provided examples at inference time. "An in-context learning mechanism then allows the model to adapt its internal representation to local risk patterns and even generalize to unseen categorical levels"
- Iteratively Reweighted Least Squares (IRLS): An algorithm for fitting GLMs by iteratively solving weighted least squares problems. "Instead of Iteratively Reweighted Least Squares (IRLS), a tiny shared network learns how to map a “working predictor” and latent tariff structure to a slightly improved one."
- LayerNorm (Layer Normalization): A normalization technique applied across features within a layer to stabilize training. "\tilde{u}_i{(t,s)} &= \LayerNorm\bigl( u_i{(t,s)} \bigr),"
- Latent recursion: Iterative refinement of latent states within a model to improve intermediate representations and answers. "This stage corresponds to the TRM latent recursion, where is repeatedly updated from "
- Minimum-bias calibration: An actuarial iterative procedure to adjust rating relativities to minimize bias across segments. "iterative generalized linear model fitting and minimum-bias calibration"
- Nagging ensemble: An ensemble technique that averages predictions from multiple independently initialized runs to reduce variance. "we train a 10-run nagging ensemble"
- Optuna: A framework for automated hyper-parameter optimization via efficient search strategies. "We performed global hyper-parameter optimization with Optuna"
- Piecewise-linear encoding (PLE): A learnable transformation of continuous variables using localized linear basis functions. "we apply a learnable piecewise-linear encoding (PLE), inspired by \citet{gorishniy2022embeddings}"
- Poisson deviance loss: A loss function derived from the Poisson likelihood used to evaluate and train count models. "and the model is trained by minimizing the Poisson deviance loss, which corresponds to maximum likelihood estimation under the Poisson assumption"
- Poisson GLM: A GLM with Poisson-distributed response and typically a log link for modeling count data. "preserving the log-link structure of Poisson GLMs."
- Poisson model: A statistical model for count data where events occur independently at a constant rate. "We furthermore assume a Poisson model for the claim counts"
- Q-learning: A reinforcement learning method that learns action-value functions to guide decision-making. "a Q-learning based halting head decides how many supervision steps to apply to each example"
- Recurrent Neural Networks (RNNs): Neural architectures that maintain a hidden state across sequential steps, enabling temporal or iterative computation. "Another analogy is to Recurrent Neural Networks (RNNs): if one “unrolls” the recursive core over its inner and outer iterations, the effective computation closely resembles that of a RNN"
- Residual connection: A skip connection that adds inputs to outputs of a layer, aiding optimization and enabling deeper networks. "Both updates are residual connections."
- Scratchpad: A latent memory representation used to store intermediate computations during reasoning. "an auxiliary latent state that acts as a scratchpad of intermediate computations."
- State-space model: A model that describes system dynamics via hidden states and observation equations over discrete time. "Tab-TRM can be viewed as a discrete-time state-space model"
- Tariff factors: Insurance rating variables (covariates) used to determine premiums and relativities. "inputs are naturally decomposed into a small, fixed set of tokens (grid cells or tariff factors);"
- Test-time compute (TTC): Additional computation at inference aimed at improving performance (e.g., iterative reasoning). "the computational budgets required by test-time compute (TTC)."
- Tiny Recursive Model (TRM): A compact architecture that iteratively refines an answer and a latent state via a small shared network. "The Tiny Recursive Model (TRM) of \citet{jolicoeur2025trm} provides a compelling simplification"
- Tokenisation of tabular inputs: Representing each feature as a separate token for transformer-like processing. "tokenisation of tabular inputs via entity embeddings"
- XGBoost: A high-performance implementation of gradient boosting that is a strong baseline on tabular data. "in particular XGBoost"
Collections
Sign up for free to add this paper to one or more collections.