- The paper introduces a novel method using random sequential feature additions to detect higher-order interactions with an intuitive L-score measure.
- It demonstrates that the L-score effectively distinguishes between synergy (L ≈ -1) and redundancy (L ≈ +1) across varied datasets.
- The approach outperforms traditional metrics like Pearson correlation and SHAP values, offering a unified framework for complex system analysis.
A General Algorithm for Detecting Higher-Order Interactions via Random Sequential Additions
The paper "A General Algorithm for Detecting Higher-Order Interactions via Random Sequential Additions" (2512.11793) introduces an innovative method to detect complex feature interactions, such as synergy and redundancy, using geometric analysis of performance contributions when features are added in random sequences. This novel approach leverages the L-score, a continuous metric ranging from −1 (indicating perfect synergy) to +1 (indicating perfect redundancy), providing a unified geometric framework applicable across various domains and models.
Introduction and Motivation
Understanding the interactions among system components is a pivotal challenge in machine learning, particularly in disentangling overlapping or synergistic contributions to predictions. Traditional methods often require specific assumptions about the model structure or domain, impeding their general applicability. This paper addresses these limitations by introducing a method based on visualizing L-shaped patterns that reflect interaction structures. These patterns naturally emerge from the incremental performance changes observed when features are sequentially added, revealing characteristic order-dependent contributions.
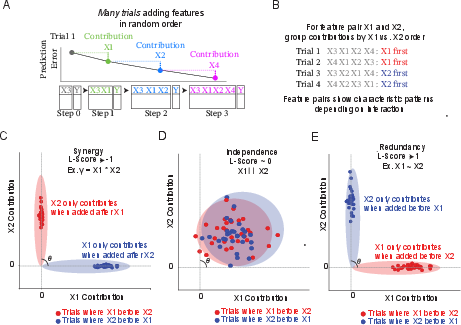
Figure 1: Order-dependent feature contributions reveal redundancy and synergy. (A) Features are added in random sequential orders across trials, and marginal contributions are measured via performance change. (B) For each feature pair (X1,X2), contributions are grouped by relative addition order. (C) Synergy: mirror L-shaped distributions where features contribute primarily when added after one another (L≈−1). (D) Independence: diffuse, symmetric contribution clouds with no order dependence (L≈0). (E) Redundancy: L-shaped distributions where only the first-added feature contributes (L≈+1).
Methodology: Sequential Feature Addition and the L-Score
The method centers around the L-score, computed from the performance gains observed during randomized sequential feature additions. This process involves evaluating the marginal reduction in mean squared error (MSE) for each feature pair, plotted as point clouds that reveal structural relationships like synergy, independence, and redundancy.
- Sequential Addition: Features are added in random orders, and their contributions to performance are recorded, leading to distinct geometric patterns. These patterns are classified into categories based on their shapes and orientations—synergistic, independent, and redundant.
- L-Score Calculation: The L-score is calculated using PCA-derived metrics such as skinniness and horizontalness, which quantify the elongation and orientation of the contribution clouds for each feature pair.
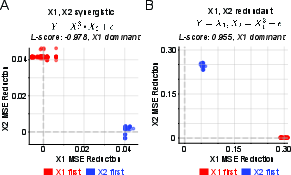
Figure 2: L-score scatter plot for the asymmetric synergy (A) and redundancy (B) datasets (X1,X2).
Results and Analysis
The paper validates the method on synthetic datasets designed to simulate synergistic and redundant interactions. In asymmetric polynomial synergy scenarios, where the interaction term Y=X13⋅X2 is examined, the L-score effectively identifies strong negative values indicative of synergy. Conversely, for redundancy scenarios, positive L-scores confirm overlapping feature contributions.
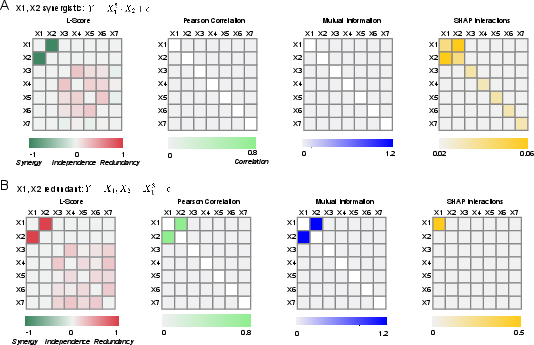
Figure 3: Comparison of correlation, mutual information, and SHAP values on the asymmetric synergy (A) and redundancy (B) datasets.
The L-score is shown to outperform traditional metrics such as Pearson Correlation, Mutual Information, and SHAP values by providing a more unified and intuitive measure of interaction strength and type. Mutual Information fails to capture synergy, and SHAP values do not always reflect redundancy accurately, underscoring the L-score's utility in diverse interaction contexts.
Implications and Future Directions
The proposed method offers a robust, model-agnostic approach for investigating feature interactions, applicable beyond machine learning to areas like biology and network theory. Its ability to detect higher-order interactions with reduced computational complexity positions it as a valuable tool for exploring complex systems.
Future developments could enhance scalability and precision, enabling real-time applications in dynamic environments. Expanding the approach to accommodate temporal data or multi-modal inputs holds considerable promise for advancing the study of interactive systems.
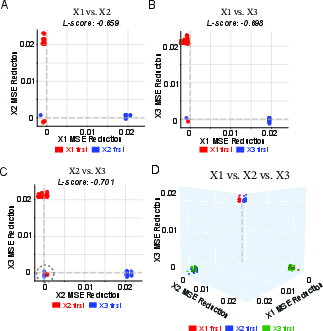
Figure 4: Tri-feature relationships, when Y=X1⋅X2⋅X3. In pairwise plots (A-C), points near the origin (circled in C) represent trials where the non-plotted feature was added last. All three features are plotted in D.
Conclusion
The introduction of the L-score represents a significant step towards simplifying the analysis of feature interactions within complex datasets. By offering a consistent metric to gauge redundancy and synergy, this method bridges the gap between theoretical investigation and practical implementation, paving the way for deeper insights into the structural roles of features in predictive modeling. This framework holds substantial potential for application in various scientific fields, promising to facilitate a nuanced understanding of interdependencies in complex systems.