Polyspectral Mean based Time Series Clustering of Indian Stock Market
Published 9 Apr 2025 in q-fin.ST and stat.AP | (2504.07021v1)
Abstract: In this study, we employ k-means clustering algorithm of polyspectral means to analyze 49 stocks in the Indian stock market. We have used spectral and bispectral information obtained from the data, by using spectral and bispectral means with different weight functions that will give us varying insights into the temporal patterns of the stocks. In particular, the higher order polyspectral means can provide significantly more information than what we can gather from power spectra, and can also unveil nonlinear trends in a time series. Through rigorous analysis, we identify five distinctive clusters, uncovering nuanced market structures. Notably, one cluster emerges as that of a conglomerate powerhouse, featuring ADANI, BIRLA, TATA, and unexpectedly, government-owned bank SBI. Another cluster spotlights the IT sector with WIPRO and TCS, while a third combines private banks, government entities, and RELIANCE. The final cluster comprises publicly traded companies with dispersed ownership. Such clustering of stocks sheds light on intricate financial relationships within the stock market, providing valuable insights for investors and analysts navigating the dynamic landscape of the Indian stock market.
The paper presents a novel methodology using polyspectral means and k-means clustering to extract both linear and nonlinear temporal patterns from stock price time series.
It validates the approach through simulation studies with accuracies exceeding 80% and applies it to group 49 NIFTY 50 stocks into five distinct clusters.
The study highlights the significant role of bispectral means and VWAP-based features in revealing hidden interdependencies and guiding portfolio diversification.
Polyspectral Mean Based Time Series Clustering of Indian Stock Market
This paper introduces a methodology for clustering stocks in the Indian stock market based on the k-means algorithm applied to polyspectral means derived from stock price time series. The study utilizes spectral and bispectral information to uncover linear and nonlinear temporal patterns, offering insights into market structures beyond traditional methods. The approach is validated through simulation studies and applied to a dataset of 49 stocks from the NIFTY 50 index, revealing distinctive clusters reflecting nuanced financial relationships.
Methodology and Feature Extraction
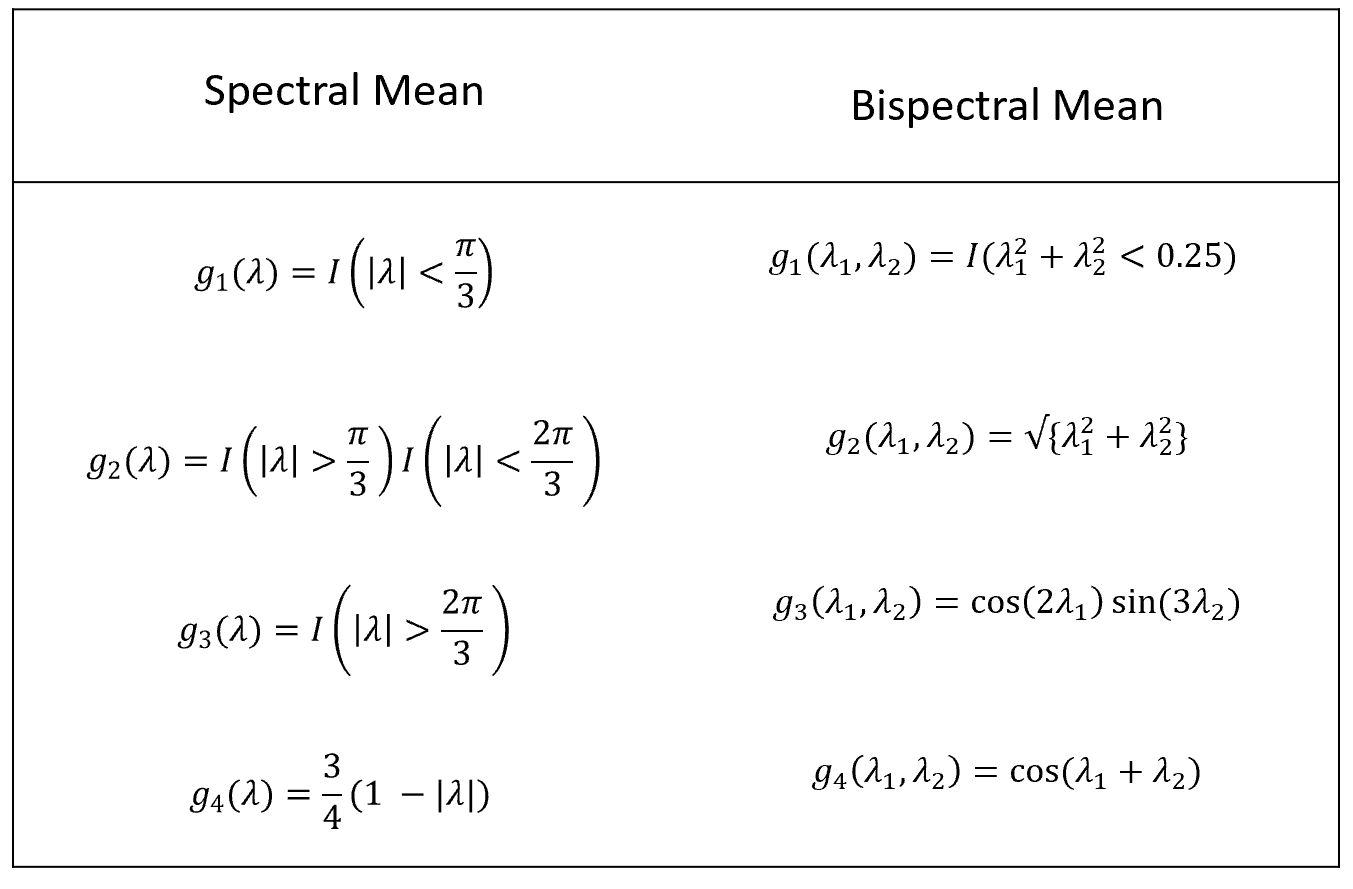
The methodology involves extracting spectral and bispectral means from the Value-Weighted Average Price (VWAP) of stocks. VWAP is used to gauge the average price of a stock over a trading day, weighted by volume. The dataset spans from January 2000 to April 2021, with the analysis focusing on the last 1000 days of available data. Spectral and bispectral means are computed using Fourier transforms of autocumulants, capturing higher-order interactions indicative of nonlinearity. The weight functions employed for spectral and bispectral means are illustrated in Figure 1.
Figure 1: Weight functions taken for the spectral and bispectral means.
where d(λ) is the Discrete Fourier Transform of the time series, and Φ(λ) is an indicator function ensuring non-redundancy in frequency combinations.
To ensure stationarity, the time series are differenced, aligning with the theoretical requirements for the asymptotic distribution of polyspectral means. Additional features, such as the period of the time series and mean of the differenced time series are also incorporated. K-means clustering is then applied to these extracted features for unsupervised clustering of the stocks.
Simulation Studies
The paper presents three simulation studies to validate the proposed methodology.
Simulation I (Binary-Class Stationary): This simulation involves two groups of time series, one generated from an ARMA(2,2) process and the other from a GARCH(1,1) process, with added Gaussian noise. The classification accuracy measures, including sensitivity, specificity, F1-score, balanced accuracy, and AUC, demonstrate robust performance, with most measures exceeding 80%.
Simulation II (Binary-Class with Different Trend): In this simulation, temporal trends are introduced to the two groups in addition to the stationary noise. The classification accuracy in this scenario reaches 100%, highlighting the algorithm's sensitivity to divergent trend structures.
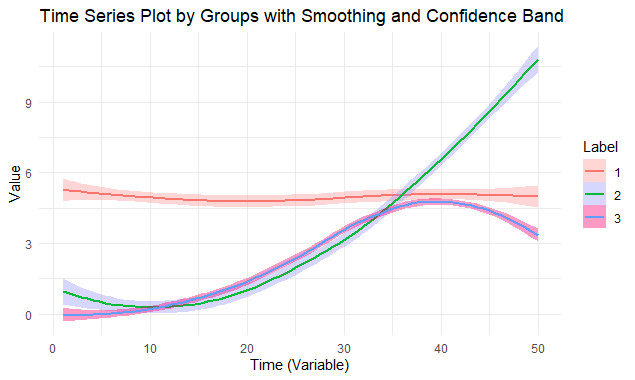
Simulation III (3 Groups with Same or Different Trends): This setup involves three classes of time series, each with distinct mean trends and stationary distributions. The k-means clustering method continues to exhibit high classification accuracy, with rates nearing 90%.
Figure 2: Time Series of 5 groups with different number of time series in each group.
These simulation studies underscore the robustness of the k-means clustering technique in discerning and classifying time series data.
Indian Stock Market Analysis
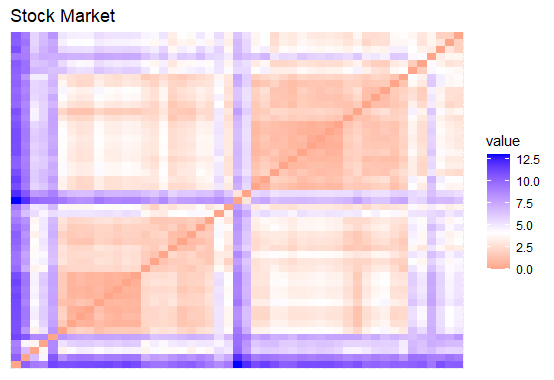
The proposed algorithm is applied to a dataset of 49 stocks from the NIFTY 50 index. The clustering ability of the dataset is assessed using the Hopkins index, yielding a value of 0.7997 with a p-value of <0.001, indicating a high likelihood of clustering.
Figure 3: Dissimilarity matrix of stock market feature matrix (left panel) and a randomly generated dataset (right panel).
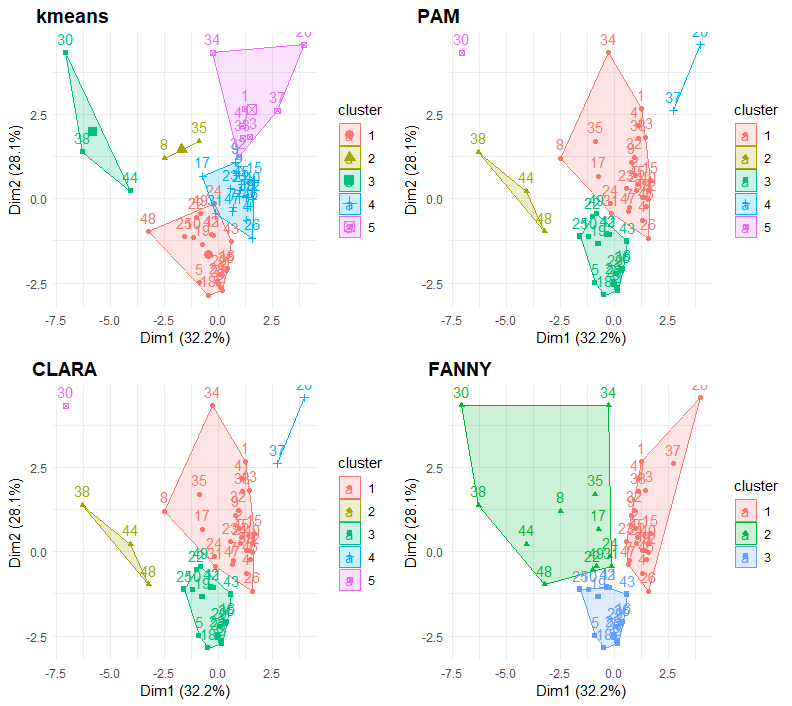
Various measures, including the Elbow Method, Silhouette index, Gap Statistic, and Dunn index, are used to determine the optimal number of clusters. Based on these metrics, the analysis primarily focuses on five clusters. The clustering results, obtained using k-means, PAM, CLARA, and FANNY algorithms, reveal several interesting patterns. One cluster includes WIPRO, TCS, and POWERGRID, identifying leading IT companies and a major power transmission entity. Another cluster comprises ADANIPORTS, TATASTEEL, BAJAJ AUTO, ULTRACEMCO, and HINDALCO, along with the government-owned SBIN, suggesting a conglomerate powerhouse. A third cluster consists of private banks like HDFCBANK and INDUSINDBK, as well as government-owned companies involved in natural resources, such as COALINDIA, BPCL, and ONGC.
Figure 4: Clustering Results for the four types of clusters using number of desired clusters as 5.
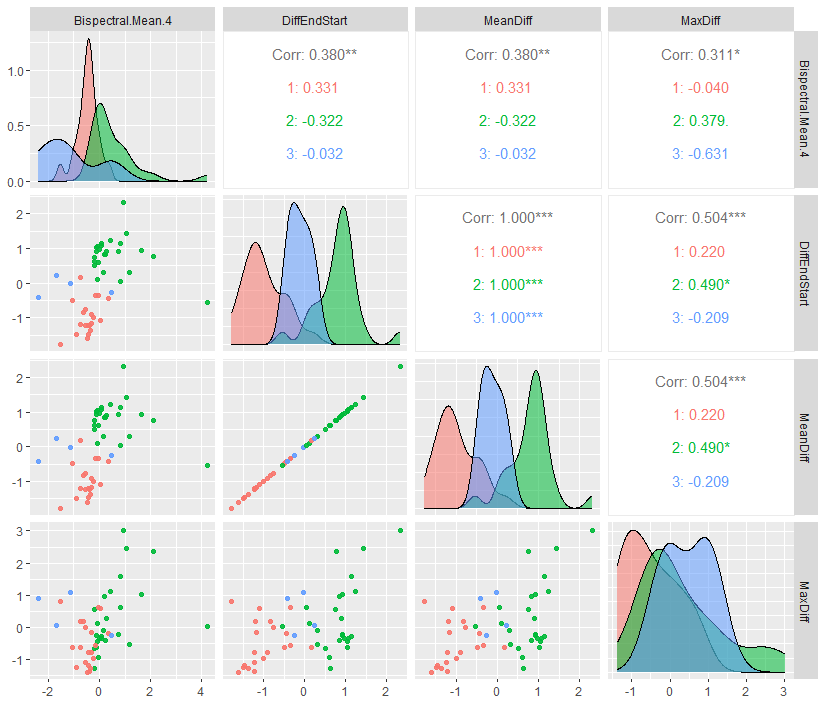
Figure 5 illustrates the feature-wise classification power, highlighting the contribution of bispectral mean and VWAP difference-based features in distinguishing the clusters. The feature-wise classification power of the selected clustering variables is validated by displaying pairwise correlations, density distributions, and scatterplots. The scatterplots reveal that while some clusters exhibit clear separability in certain dimensions, others show overlapping patterns, reinforcing the idea that multiple interacting factors contribute to the clustering outcome. The separation of clusters in terms of Bispectral Mean indicates that higher-order spectral interactions significantly influence the clustering structure.
Figure 5: Featurewise Classification Power.
Discussion of Clusters
The resulting clusters reveal meaningful groupings based on shared market dynamics, institutional investment patterns, and macroeconomic sensitivities.
Cluster 1: Consists of large industrial conglomerates and core economic sectors. These companies are highly sensitive to infrastructure development, commodity price cycles, and government policies on industrial expansion.
Cluster 2: A diverse mix of companies spanning energy, banking, automobiles, FMCG, and infrastructure. This cluster contains a blend of both private and public-sector companies, making it more exposed to policy-driven economic shifts, interest rate fluctuations, and global commodity price trends.
Cluster 3: Includes TCS, Wipro, and Power Grid Corporation of India, characterized by stable revenue generation, low volatility, and strong institutional investor participation.
Cluster 4: Links HCL Technologies and Sun Pharmaceuticals, likely due to their strong global presence, innovation focus, and institutional ownership rather than industry similarities.
Cluster 5: Contains a diverse set of large-cap companies, suggesting a grouping driven by market capitalization, institutional investment, and overall economic resilience rather than industry classification alone.
Conclusion
This study demonstrates the efficacy of using polyspectral means and k-means clustering to analyze the Indian stock market. The identified clusters reflect market-driven groupings based on shared dynamics and sensitivities, rather than purely sector-based classifications. The approach uncovers hidden interdependencies and offers a new perspective on stock market structures for risk assessment and portfolio diversification. Further research should explore alternative feature extraction techniques and clustering models to refine these insights.