GraphiMind: LLM-centric Interface for Information Graphics Design
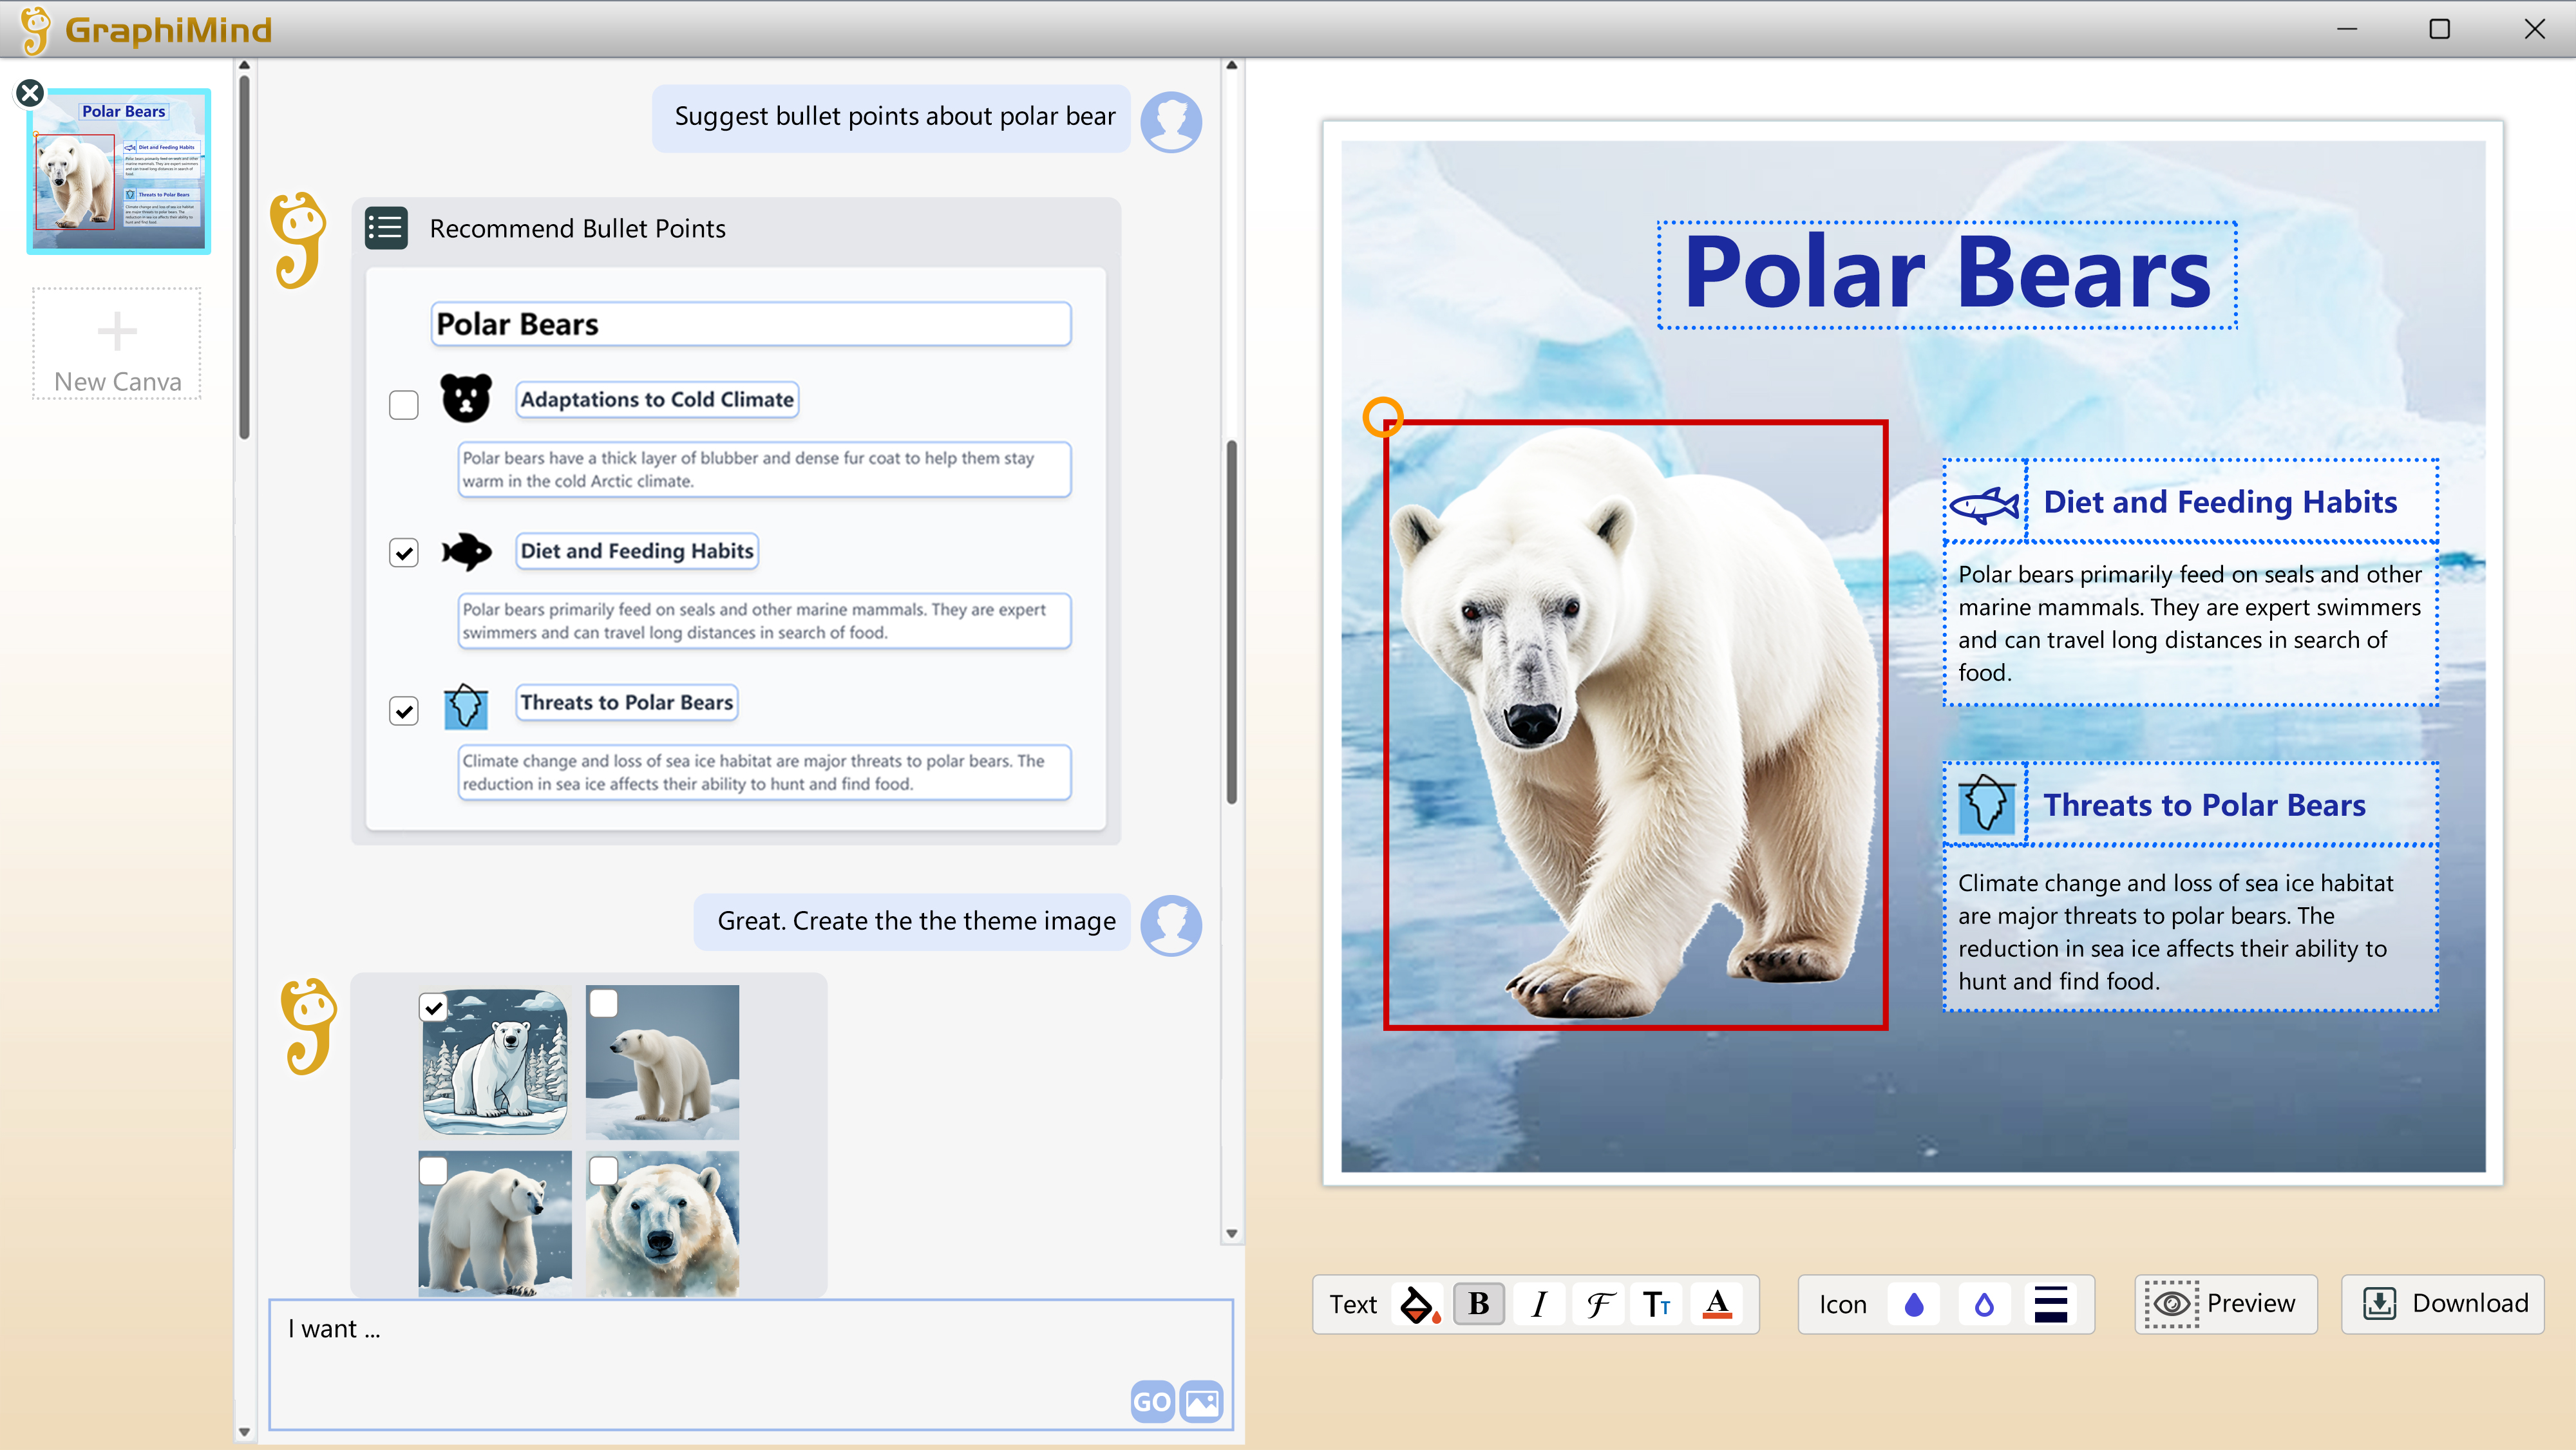
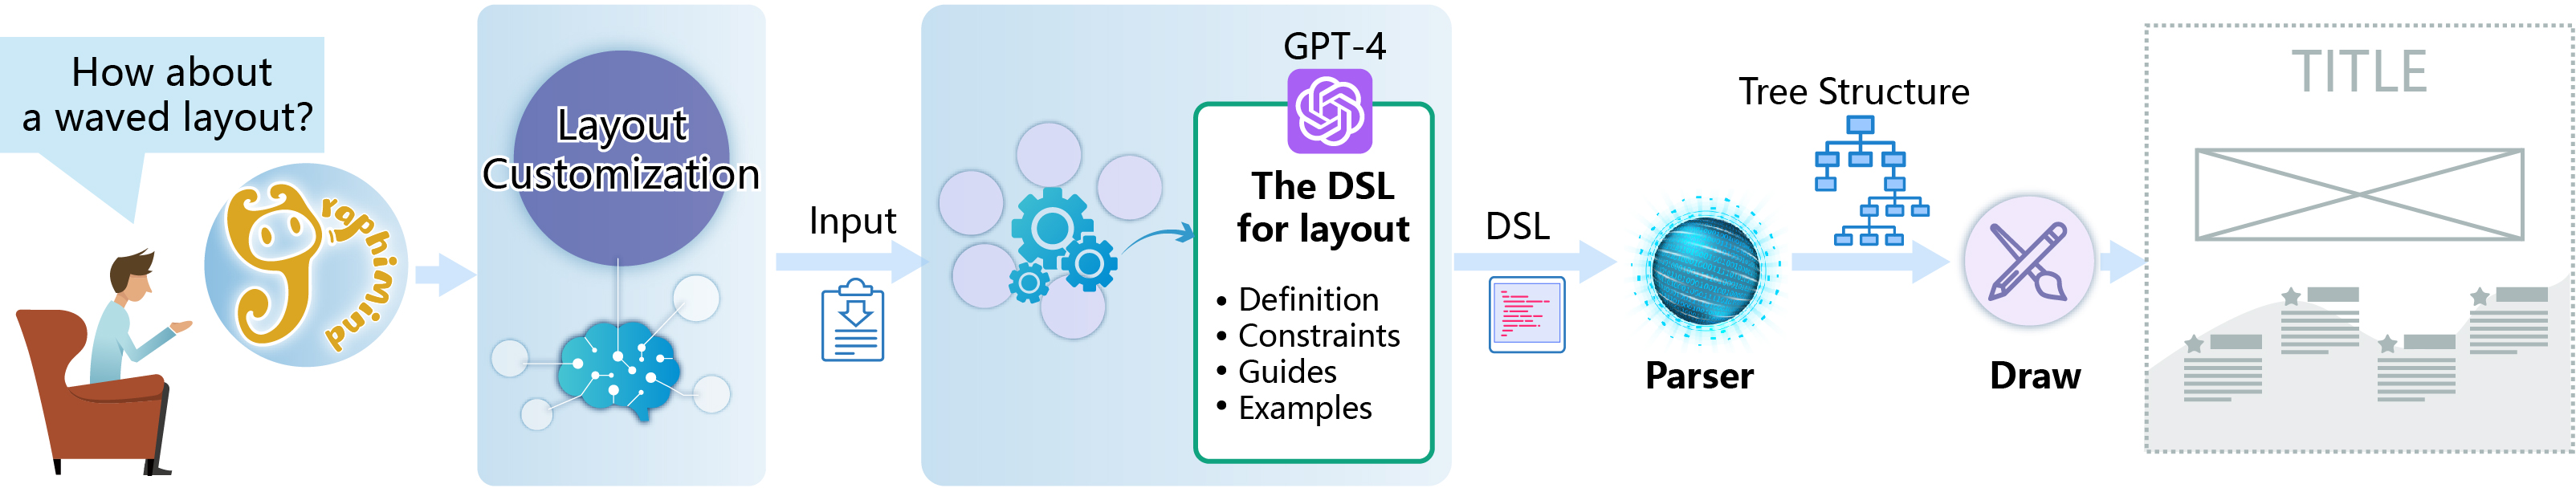
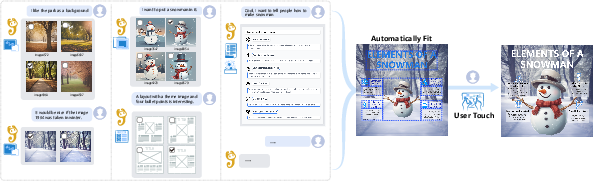
Abstract: Information graphics are pivotal in effective information dissemination and storytelling. However, creating such graphics is extremely challenging for non-professionals, since the design process requires multifaceted skills and comprehensive knowledge. Thus, despite the many available authoring tools, a significant gap remains in enabling non-experts to produce compelling information graphics seamlessly, especially from scratch. Recent breakthroughs show that LLMs, especially when tool-augmented, can autonomously engage with external tools, making them promising candidates for enabling innovative graphic design applications. In this work, we propose a LLM-centric interface with the agent GraphiMind for automatic generation, recommendation, and composition of information graphics design resources, based on user intent expressed through natural language. Our GraphiMind integrates a Textual Conversational Interface, powered by tool-augmented LLM, with a traditional Graphical Manipulation Interface, streamlining the entire design process from raw resource curation to composition and refinement. Extensive evaluations highlight our tool's proficiency in simplifying the design process, opening avenues for its use by non-professional users. Moreover, we spotlight the potential of LLMs in reshaping the domain of information graphics design, offering a blend of automation, versatility, and user-centric interactivity.
- Adobe Inc. Adobe illustrator, 2023.
- Do as i can, not as i say: Grounding language in robotic affordances. arXiv preprint arXiv:2204.01691, 2022.
- Authoring data-driven videos with dataclips. IEEE transactions on visualization and computer graphics, 23(1):501–510, 2016.
- Useful junk? the effects of visual embellishment on comprehension and memorability of charts. In Proceedings of the SIGCHI conference on human factors in computing systems, pages 2573–2582, 2010.
- On the opportunities and risks of foundation models. arXiv preprint arXiv:2108.07258, 2021.
- Instructpix2pix: Learning to follow image editing instructions. In Proceedings of the IEEE/CVF Conference on Computer Vision and Pattern Recognition, pages 18392–18402, 2023.
- Language models are few-shot learners. Advances in neural information processing systems, 33:1877–1901, 2020.
- Towards automated infographic design: Deep learning-based auto-extraction of extensible timeline. IEEE transactions on visualization and computer graphics, 26(1):917–926, 2019.
- Quantifying the creativity support of digital tools through the creativity support index. ACM Transactions on Computer-Human Interaction (TOCHI), 21(4):1–25, 2014.
- Palm: Scaling language modeling with pathways. arXiv preprint arXiv:2204.02311, 2022.
- Infomages: Embedding data into thematic images. In Computer Graphics Forum, pages 593–606. Wiley Online Library, 2020.
- Text-to-viz: Automatic generation of infographics from proportion-related natural language statements. IEEE transactions on visualization and computer graphics, 26(1):906–916, 2019.
- A mixed-initiative approach to reusing infographic charts. IEEE Transactions on Visualization and Computer Graphics, 28(1):173–183, 2021.
- Bert: Pre-training of deep bidirectional transformers for language understanding. arXiv preprint arXiv:1810.04805, 2018.
- Palm-e: An embodied multimodal language model. arXiv preprint arXiv:2303.03378, 2023.
- A case study using visualization interaction logs and insight metrics to understand how analysts arrive at insights. IEEE transactions on visualization and computer graphics, 22(1):51–60, 2015.
- Visual programming: Compositional visual reasoning without training. In Proceedings of the IEEE/CVF Conference on Computer Vision and Pattern Recognition, pages 14953–14962, 2023.
- Isotype visualization: Working memory, performance, and engagement with pictographs. In Proceedings of the 33rd annual ACM conference on human factors in computing systems, pages 1191–1200. ACM, 2015.
- Infographic aesthetics: Designing for the first impression. In Proceedings of the 33rd Annual ACM Conference on Human Factors in Computing Systems, pages 1187–1190. ACM, 2015.
- Metagpt: Meta programming for multi-agent collaborative framework. arXiv preprint arXiv:2308.00352, 2023.
- Tool documentation enables zero-shot tool-usage with large language models. arXiv preprint arXiv:2308.00675, 2023.
- Language models as zero-shot planners: Extracting actionable knowledge for embodied agents. In International Conference on Machine Learning, pages 9118–9147. PMLR, 2022.
- Draco: bringing life to illustrations with kinetic textures. In Proceedings of the SIGCHI Conference on Human Factors in Computing Systems, pages 351–360, 2014.
- Data-driven guides: Supporting expressive design for information graphics. IEEE transactions on visualization and computer graphics, 23(1):491–500, 2016.
- Dataselfie: Empowering people to design personalized visuals to represent their data. In Proceedings of the 2019 CHI conference on human factors in computing systems, pages 1–12, 2019.
- Segment anything. arXiv preprint arXiv:2304.02643, 2023.
- Sheetcopilot: Bringing software productivity to the next level through large language models. arXiv preprint arXiv:2305.19308, 2023.
- Code as policies: Language model programs for embodied control. In 2023 IEEE International Conference on Robotics and Automation (ICRA), pages 9493–9500. IEEE, 2023a.
- Taskmatrix. ai: Completing tasks by connecting foundation models with millions of apis. arXiv preprint arXiv:2303.16434, 2023b.
- Data illustrator: Augmenting vector design tools with lazy data binding for expressive visualization authoring. In Proceedings of the 2018 CHI Conference on Human Factors in Computing Systems, pages 1–13, 2018.
- Internchat: Solving vision-centric tasks by interacting with chatbots beyond language. arXiv preprint arXiv:2305.05662, 2023.
- Exploring visual information flows in infographics. In Proceedings of the 2020 CHI Conference on Human Factors in Computing Systems, pages 1–12, 2020.
- Augmented language models: a survey. arXiv preprint arXiv:2302.07842, 2023.
- Talm: Tool augmented language models. arXiv preprint arXiv:2205.12255, 2022.
- Graphoto: Aesthetically pleasing charts for casual information visualization. IEEE computer graphics and applications, 38(6):67–82, 2018.
- Retrieve-then-adapt: Example-based automatic generation for proportion-related infographics. IEEE Transactions on Visualization and Computer Graphics, 27(2):443–452, 2020.
- Tool learning with foundation models. arXiv preprint arXiv:2304.08354, 2023.
- Tptu: Task planning and tool usage of large language model-based ai agents. arXiv preprint arXiv:2308.03427, 2023.
- Content-driven layout for visualization design. In Proceedings of the 15th International Symposium on Visual Information Communication and Interaction, pages 1–8, 2022.
- Critical reflections on visualization authoring systems. IEEE transactions on visualization and computer graphics, 26(1):461–471, 2019.
- Toolformer: Language models can teach themselves to use tools. arXiv preprint arXiv:2302.04761, 2023.
- Hugginggpt: Solving ai tasks with chatgpt and its friends in huggingface. arXiv preprint arXiv:2303.17580, 2023.
- Reverse-engineering information presentations: recovering hierarchical grouping from layouts of visual elements. Visual Intelligence, 1(1):1–14, 2023a.
- De-stijl: Facilitating graphics design with interactive 2d color palette recommendation. In Proceedings of the 2023 CHI Conference on Human Factors in Computing Systems, pages 1–19, 2023b.
- Mark Smiciklas. The power of infographics: Using pictures to communicate and connect with your audiences. Que Publishing, 2012.
- Llama: Open and efficient foundation language models. arXiv preprint arXiv:2302.13971, 2023.
- Infographics Wizard: Flexible Infographics Authoring and Design Exploration. Computer Graphics Forum, 2022.
- Infonice: Easy creation of information graphics. In Proceedings of the 2018 CHI Conference on Human Factors in Computing Systems, pages 1–12, 2018.
- Animated presentation of static infographics with infomotion. In Computer Graphics Forum, pages 507–518. Wiley Online Library, 2021.
- Claes Wohlin. Guidelines for snowballing in systematic literature studies and a replication in software engineering. In Proceedings of the 18th international conference on evaluation and assessment in software engineering, pages 1–10, 2014.
- Visual chatgpt: Talking, drawing and editing with visual foundation models. arXiv preprint arXiv:2303.04671, 2023.
- Promptchainer: Chaining large language model prompts through visual programming. In CHI Conference on Human Factors in Computing Systems Extended Abstracts, pages 1–10, 2022.
- React: Synergizing reasoning and acting in language models. arXiv preprint arXiv:2210.03629, 2022.
- Tablegpt: Towards unifying tables, nature language and commands into one gpt. arXiv preprint arXiv:2307.08674, 2023.
- Dataquilt: Extracting visual elements from images to craft pictorial visualizations. In Proceedings of the 2020 CHI Conference on Human Factors in Computing Systems, pages 1–13, 2020.
- Data-copilot: Bridging billions of data and humans with autonomous workflow. arXiv preprint arXiv:2306.07209, 2023.
Paper Prompts
Sign up for free to create and run prompts on this paper using GPT-5.
Top Community Prompts
Collections
Sign up for free to add this paper to one or more collections.

