- The paper introduces the BARN dataset, standardizing environmental evaluations with 300 cellular automaton-generated scenarios and difficulty metrics.
- The methodology integrates simulation with DWA and E-Band planners and employs a neural network to predict navigation difficulty.
- The paper validates the model through real-world trials with a Clearpath Jackal, showing strong correlation between predicted and actual navigation performance.
Benchmarking Metric Ground Navigation
Introduction
"Benchmarking Metric Ground Navigation" (2008.13315) explores the establishment of a standardized testbed for evaluating ground robot navigation performance across diverse environmental scenarios. Autonomously navigating through obstacle-occupied planar environments is a critical capability for intelligent mobile robots, yet there has been a notable absence of universally accepted benchmarks for assessing navigation systems as a whole. This paper introduces the Benchmark for Autonomous Robot Navigation (BARN) dataset, which consists of 300 structured environments rated on difficulty metrics. Standardization aims to eliminate the ad hoc nature of testing and provide a systematic, objective framework for predicting environmental difficulty, comparing navigation systems, and potentially guiding cost function and curriculum development for both planning-based and learning-based navigation techniques.
Navigation Environments
The BARN dataset leverages cellular automata to generate diverse navigation environments, ensuring variability and realism in obstacle configurations. The cellular automaton technique involves the iterative evolution of grid cells according to specific rules, representing obstacles with black cells and free spaces with white. This process is augmented by parameters such as initial fill percentage, smoothing iterations, fill threshold, and clear threshold, accommodating different environmental complexities. Generated environments are validated by implementing flood-fill algorithms to ensure feasible navigation paths before employing A* for path planning on the robot's Configuration Space (C-Space).
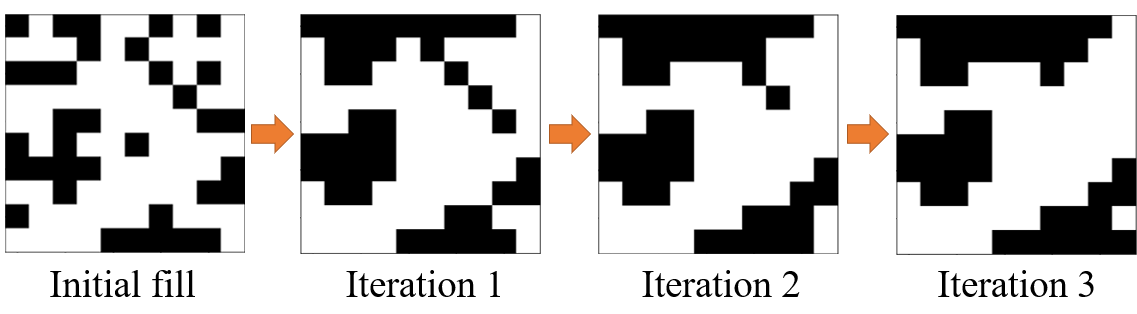
Figure 1: Three smoothing iterations of a cellular automaton with an initial fill percentage of 0.35, fill threshold of 5, and clear threshold of 1.
Difficulty Metrics
To systematically quantify navigation difficulty, several metrics are computed along the path through each environment:
- Distance to Closest Obstacle: The mean distance from path cells to the nearest obstacles, signifying spatial freedom for the robot.
- Average Visibility: Calculated from obstacle distances along rays in a 360-degree scan, averaged across the path, reflecting how exposed or obscured pathways are.
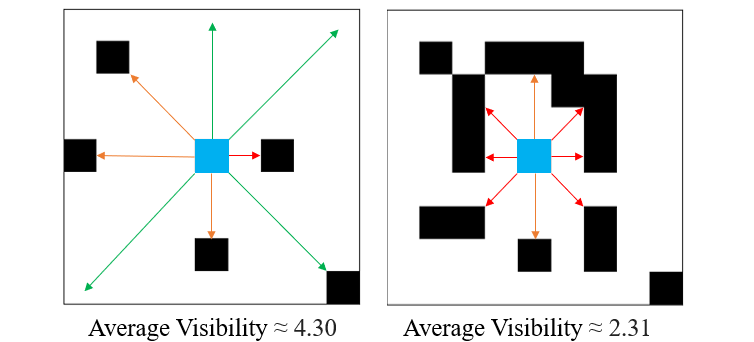
Figure 2: An example of high and low Average Visibility.
- Dispersion: The number of alternations between occupied and unoccupied space along a 360-degree scan, indicating the environmental complexity faced by sampling-based planners.
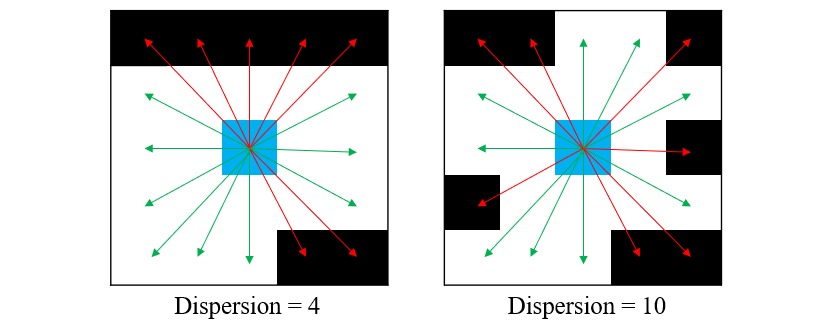
Figure 3: Dispersion represents the alternations from occupied to unoccupied space or vice versa.
- Characteristic Dimension: Visibility measured by the axis with the lowest visibility, capturing environmental tightness which might affect passageways.
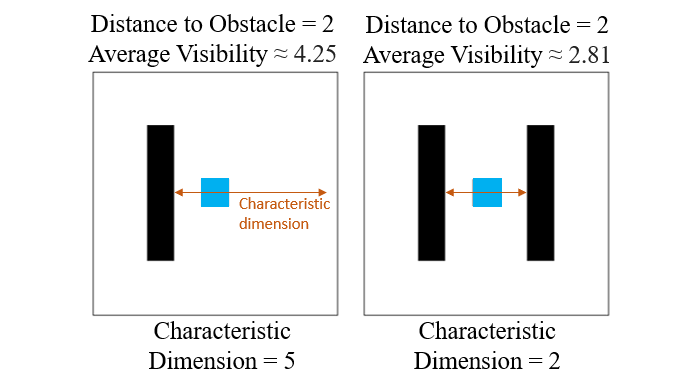
Figure 4: Characteristic Dimension captures the tightness of a state in an environment.
- Tortuosity: Reflects the curve complexity of a path, calculated via the arc-chord ratio, assessing navigation difficulty due to intricate paths that deviate from linearity.
These metrics collectively influence an environment's difficulty rating, centering on spatial constraints and navigational complexity.
Simulation and Function Approximation
The dataset's environments undergo extensive testing using the Dynamic Window Approach (DWA) and Elastic Bands (E-Band), two planners representative of sampling-based and optimization-based paradigms. These trials benchmark the environments' difficulty levels by assessing normalized traversal time and variance. DWA demonstrates higher sensitivity to complexity than E-Band, giving insights into planner resilience.
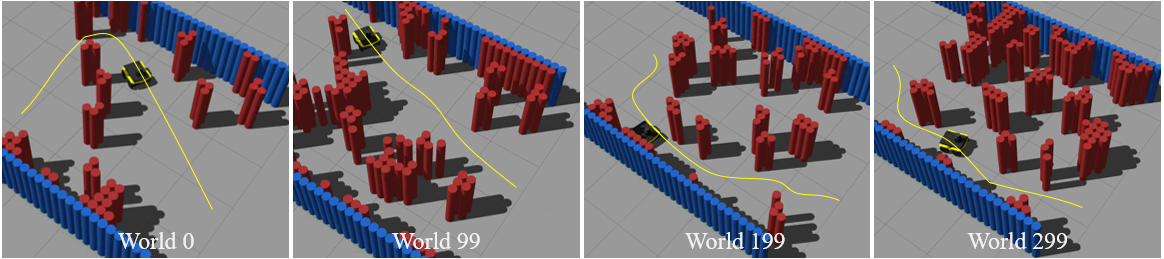
Figure 5: Four Example Environments in Gazebo Simulation (ordered by ascending relative difficulty level).
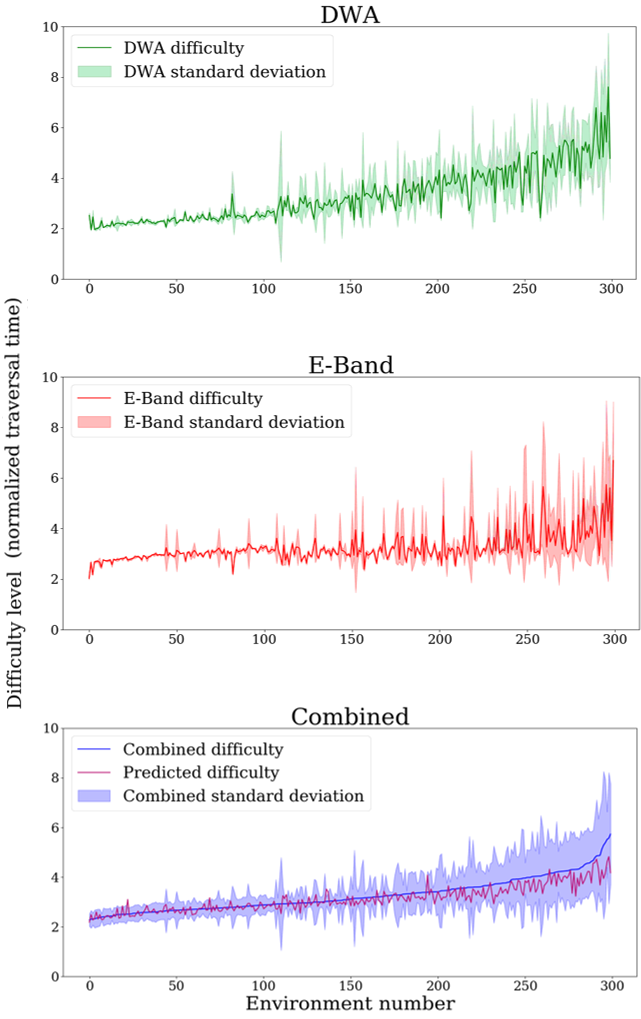
Figure 6: Environment Difficulty Benchmarked by Navigation Performance of DWA and E-Band.
A neural network function approximator synthesizes the interaction of individual difficulty metrics to predict environmental difficulty seamlessly. The network's predictive capacity supports accurate difficulty assessments of previously unseen environments, bridging simulation performance data and real-world application.
Real-World Validation
To validate the predictive model, physical trials are conducted with a Clearpath Jackal using DWA and E-Band planners across five environments constructed from cellular automaton-generated designs. The trials consistently demonstrated that predicted difficulty levels align with actual navigational performance, underscoring the model's robustness and practical utility in physical settings.
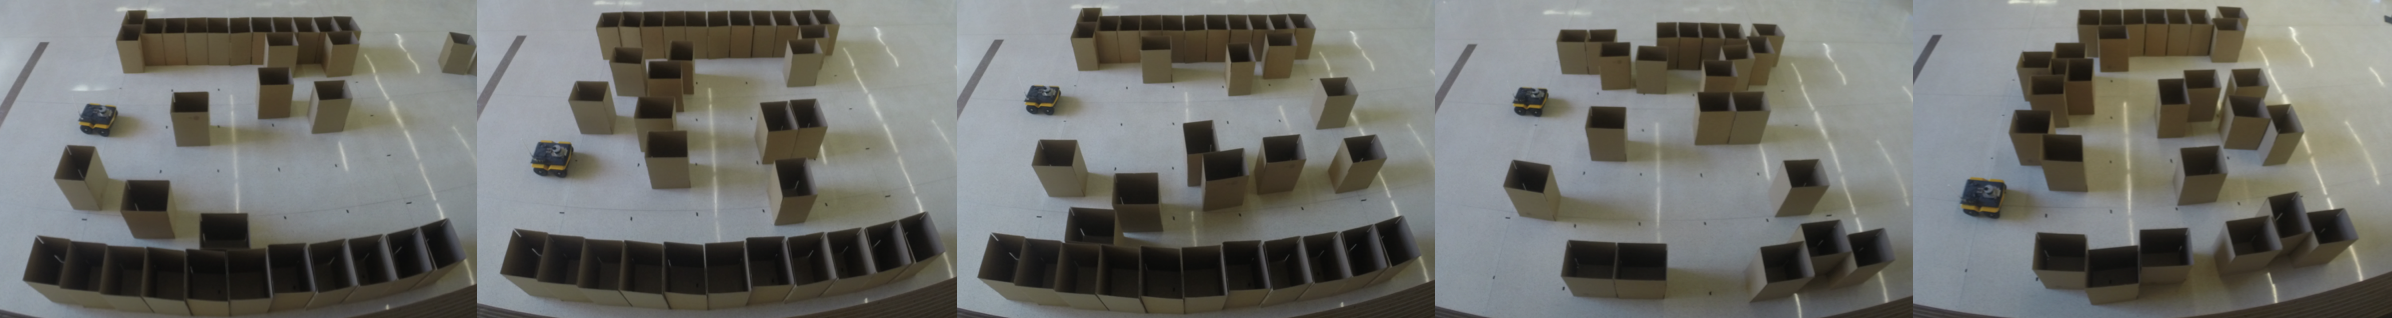
Figure 7: For each of the five physical navigation environments, five DWA and five E-Band trials are conducted.
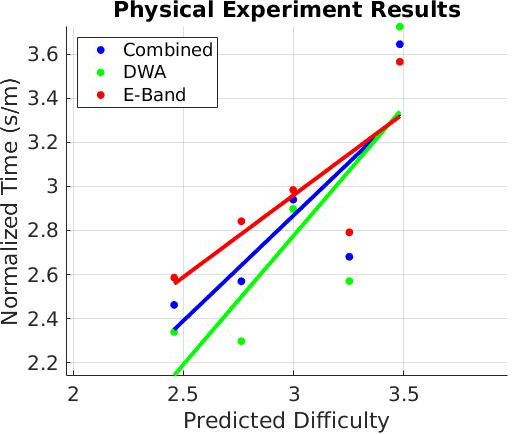
Figure 8: Real-World Navigation Performance vs. Predicted Difficulty.
Conclusion
The proposed BARN dataset and its accompanying difficulty metrics offer comprehensive benchmarking for metric ground navigation systems. The testbed enhances objective evaluation, expedites development of novel navigation strategies, and supports the evolution of autonomous navigation technologies. The successful real-world validation suggests that the benchmark can serve as a foundational tool for guiding system comparisons and curriculum design in robotic navigation. Continued exploration of data-driven modeling and integration of additional dimensions of navigational challenges promise further refinement and application diversity within this standardized framework.