Characterising epithelial tissues using persistent entropy
Abstract: In this paper, we apply persistent entropy, a novel topological statistic, for characterization of images of epithelial tissues. We have found out that persistent entropy is able to summarize topological and geometric information encoded by \alpha-complexes and persistent homology. After using some statistical tests, we can guarantee the existence of significant differences in the studied tissues.
Paper Prompts
Sign up for free to create and run prompts on this paper using GPT-5.
Top Community Prompts
Explain it Like I'm 14
What this paper is about (in simple terms)
This paper shows a new way to “summarize the shape” of cell tissues in pictures using a math tool called persistent entropy. The authors study images of tightly packed cells (epithelial tissues) and show that this one number, persistent entropy, can tell different tissue types apart by capturing how the cells are arranged.
What questions the researchers asked
- Can we use a single, easy-to-compute number (persistent entropy) to describe the overall organization of cells in a tissue image?
- Is this number good enough to tell apart three real biological tissues that look similar: chick neuroepithelium (cNT), and two stages of the fruit fly wing (dWL and dWP)?
- Can this work even when we don’t have a lot of images (small datasets), which is common in biology?
How they did it (with everyday explanations)
First, a bit of background with simple analogies:
- Topological Data Analysis (TDA): Think of it as studying the “shape” of data, not the exact distances. It cares about features like “how many pieces?” and “how many holes?” rather than perfect measurements.
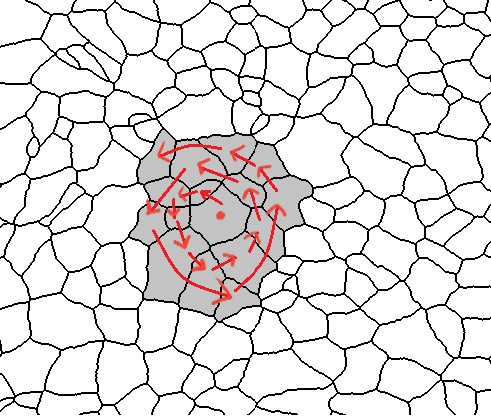
- Persistent homology: Imagine you place dots where the centers of cells are. Now pretend you slowly grow circles around each dot. As circles grow:
- Dots connect into groups (count “pieces”).
- Loops appear and disappear (count “holes”).
- This evolution is recorded as bars in a barcode: each bar shows how long a feature (a piece or a hole) exists while the circles grow.
- Alpha complex: This is a smart way to decide which dots to connect as the circles grow, using ideas from geometry (Voronoi/Delaunay). You can think of it as connecting nearby dots when their growing circles touch, but in a careful, consistent way.
Persistent entropy:
- Look at the barcode (a bunch of bars). Long bars matter more; short bars matter less.
- Persistent entropy is like a “mixiness” score of bar lengths. If many bars have similar lengths, the entropy is higher. If one or a few bars dominate, it’s lower.
- It condenses the barcode into one number that’s fairly stable and robust to small changes (noise).
What they actually did with the tissue images:
- They had three groups of tissue images: 16 cNT, 15 dWL, and 13 dWP.
- To make fair comparisons, they made sure each image used the same number of cells (400). They picked 400 cells per image by starting at the center and spiraling outwards until they collected enough cells.
- For each image:
- They took the centers (centroids) of the selected cells as dots.
- They built an alpha complex (the connection structure as circles grow).
- They computed the persistent homology barcodes in two dimensions:
- Dimension 0 (pieces/connected components).
- Dimension 1 (holes/loops).
- They turned each barcode into a persistent entropy number:
- PE0 for dimension 0,
- PE1 for dimension 1,
- PEall combining both.
- They then used standard statistical tests (Kruskal–Wallis to compare all three groups at once, and Dunn’s test for pairwise comparisons) to check if the entropy numbers differ between tissue types.
What they found and why it matters
Main findings:
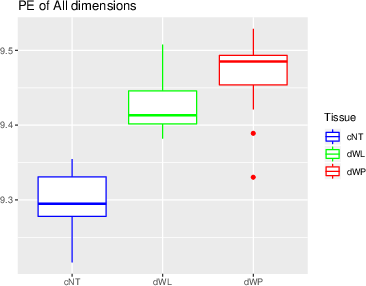
- All three tissues show different patterns in persistent entropy overall.
- PE1 (holes) gave the strongest overall difference across the three groups, but it did not clearly separate the two fly tissues (dWL vs dWP) from each other.
- PE0 (pieces) was the only measure that distinguished all three tissues pairwise, including the two very similar fly stages.
- PEall (combining pieces and holes) was especially good at separating the chick tissue (cNT) from the two fly tissues (dWL and dWP).
Why it matters:
- With just one number per image, they could detect meaningful differences in how cells are organized.
- This is helpful when you don’t have many images and want a quick, robust summary.
- It suggests that topological features (like how groups and holes appear as you connect cells) capture real biological organization.
What this could mean for the future
- Persistent entropy could be added to existing image analysis tools (like EpiGraph) as a new, easy-to-use feature to compare tissues.
- It may help scientists spot subtle changes in tissue organization during development, disease, or experiments.
- The authors suggest improving the method by building the filtration directly from the actual cell shapes (not just from cell centers) and by testing more tissue types.
- Because persistent entropy is stable and simple, it could become a standard “shape summary” for biological images, especially in small studies.
Collections
Sign up for free to add this paper to one or more collections.

