- The paper presents 39 actionable heuristics distilled from 95 recommendations, advancing cooperative dashboard interactions.
- It structures dashboard communication into five states—initiation, grounding, turn-taking, repair, and close—to guide interactive dialogue.
- Expert reviews and student evaluations reveal strengths in initiation and grounding while highlighting challenges in dynamic interactivity and error repair.
Heuristics for Supporting Cooperative Dashboard Design
This paper explores the concept of cooperative dashboards, which are interactive systems designed to facilitate analytical conversations between users and data. By applying the principles of conversational flow, this study introduces a set of heuristics aimed at enhancing the cooperative nature of dashboard interactions.
Conceptual Framework
Cooperative Conversation
The paper defines cooperative dashboards as those following the Gricean Maxims, which include quantity, quality, relation, and manner. These principles enable effective communication akin to a human-human conversation. The study frames this in the context of analytical dashboards to ensure they serve as productive conversational partners.
Analytical Conversation States
The authors delineate five conversational states—initiation, grounding, turn-taking, repair and refinement, and close—which guide the development of dashboard interactions. Initiation involves welcoming the user to the data space. Grounding establishes context and clarity about data. Turn-taking ensures interactive dialogue, like enabling queries and responses in data exploration. Repair and refinement address ambiguities or errors, while close provides clear summaries or decision-making conclusions.
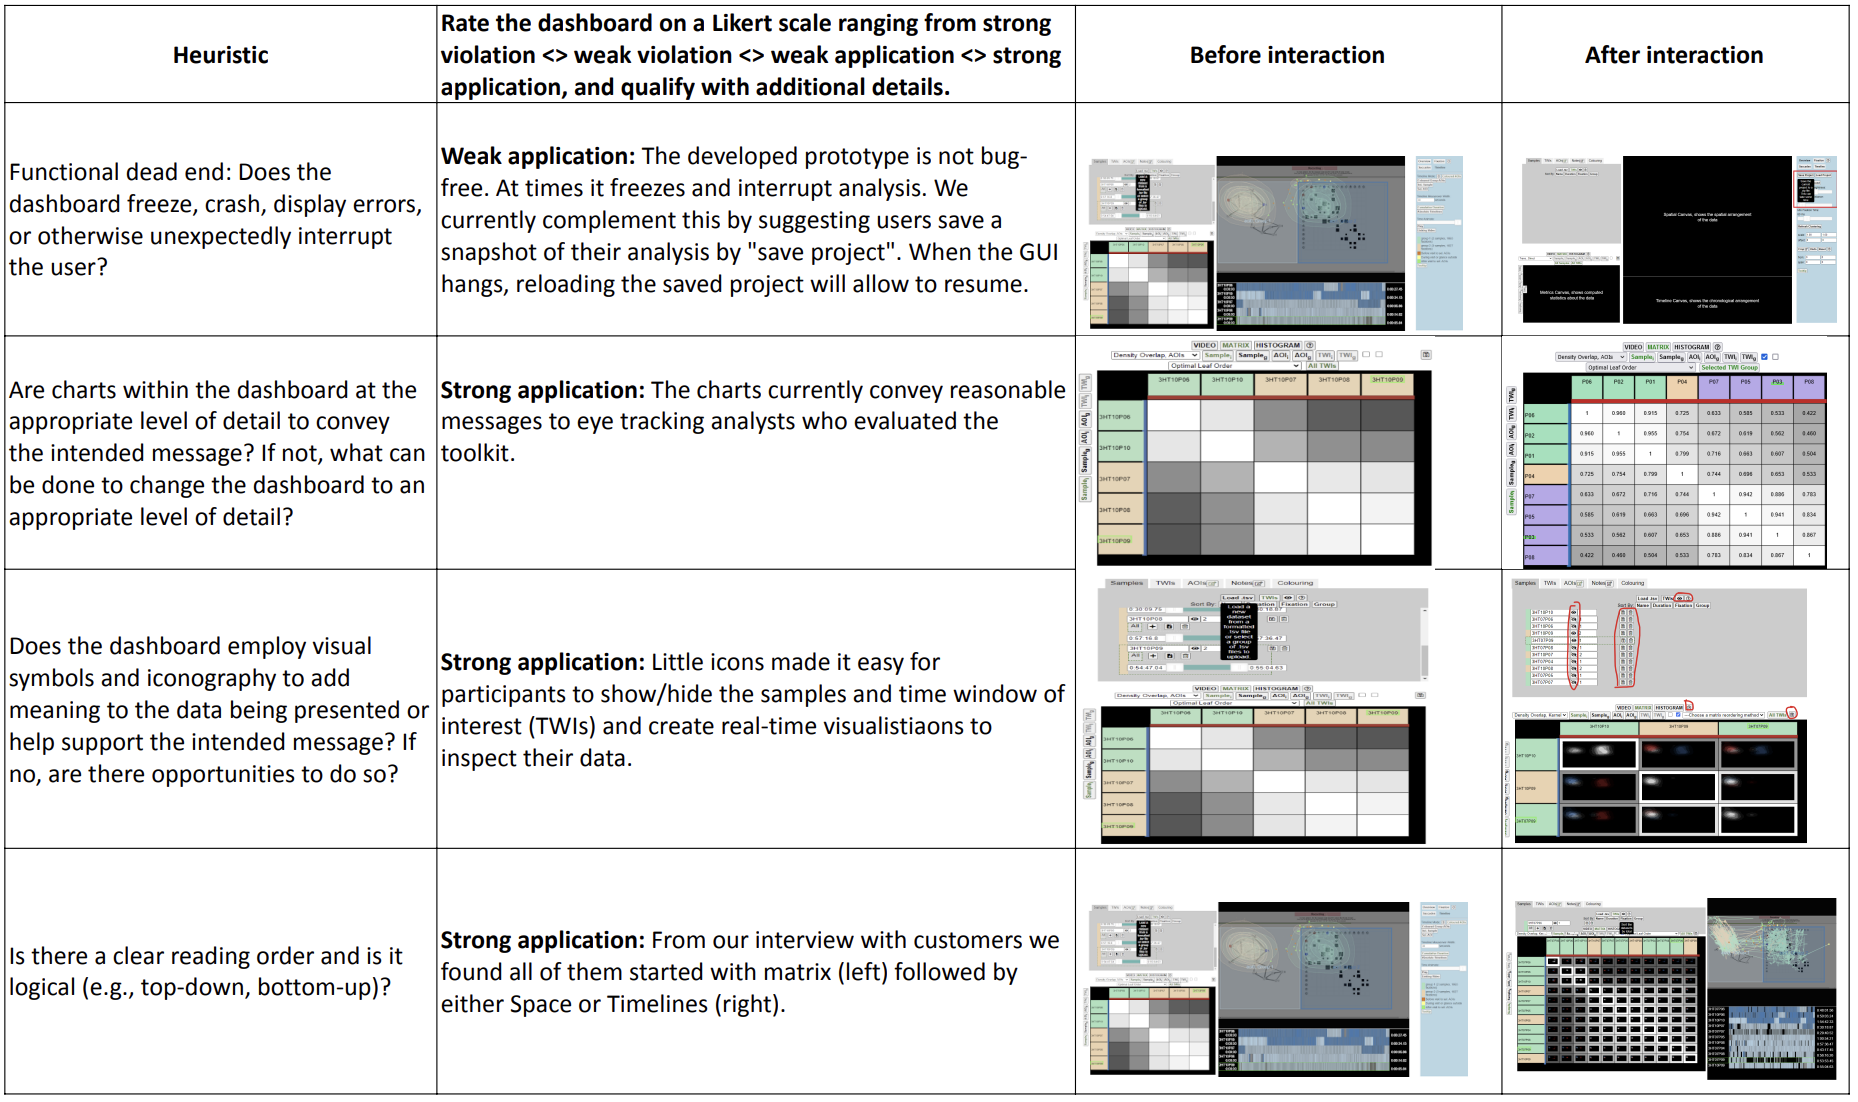
Figure 1: Example of four heuristics used to evaluate a visual eye-tracking dashboard by an expert.
Methodology
Heuristic Development
Initially, the authors generated 95 heuristics through iterative consultations with visualization practitioners. These heuristics were distilled into 39 actionable recommendations that align dashboard design with conversational principles.
Pilot Reviews and Expert Feedback
The heuristics underwent testing phases with both pilot participants and expert reviewers. Feedback from 16 expert users highlighted insights and areas for refinement in the heuristics, emphasizing aspects like visual communication and analytic flexibility.
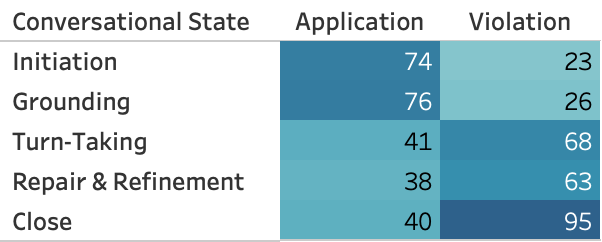
Figure 2: Part A heatmap showing frequencies of heuristic applications and violations grouped by conversational state.
Application in Educational Context
Student Evaluations
The heuristics were employed in a visualization course, where 52 students analyzed existing dashboards using the guidelines. Evaluations revealed dashboards often excel at initiation and grounding but lag in turn-taking and repair dynamics.
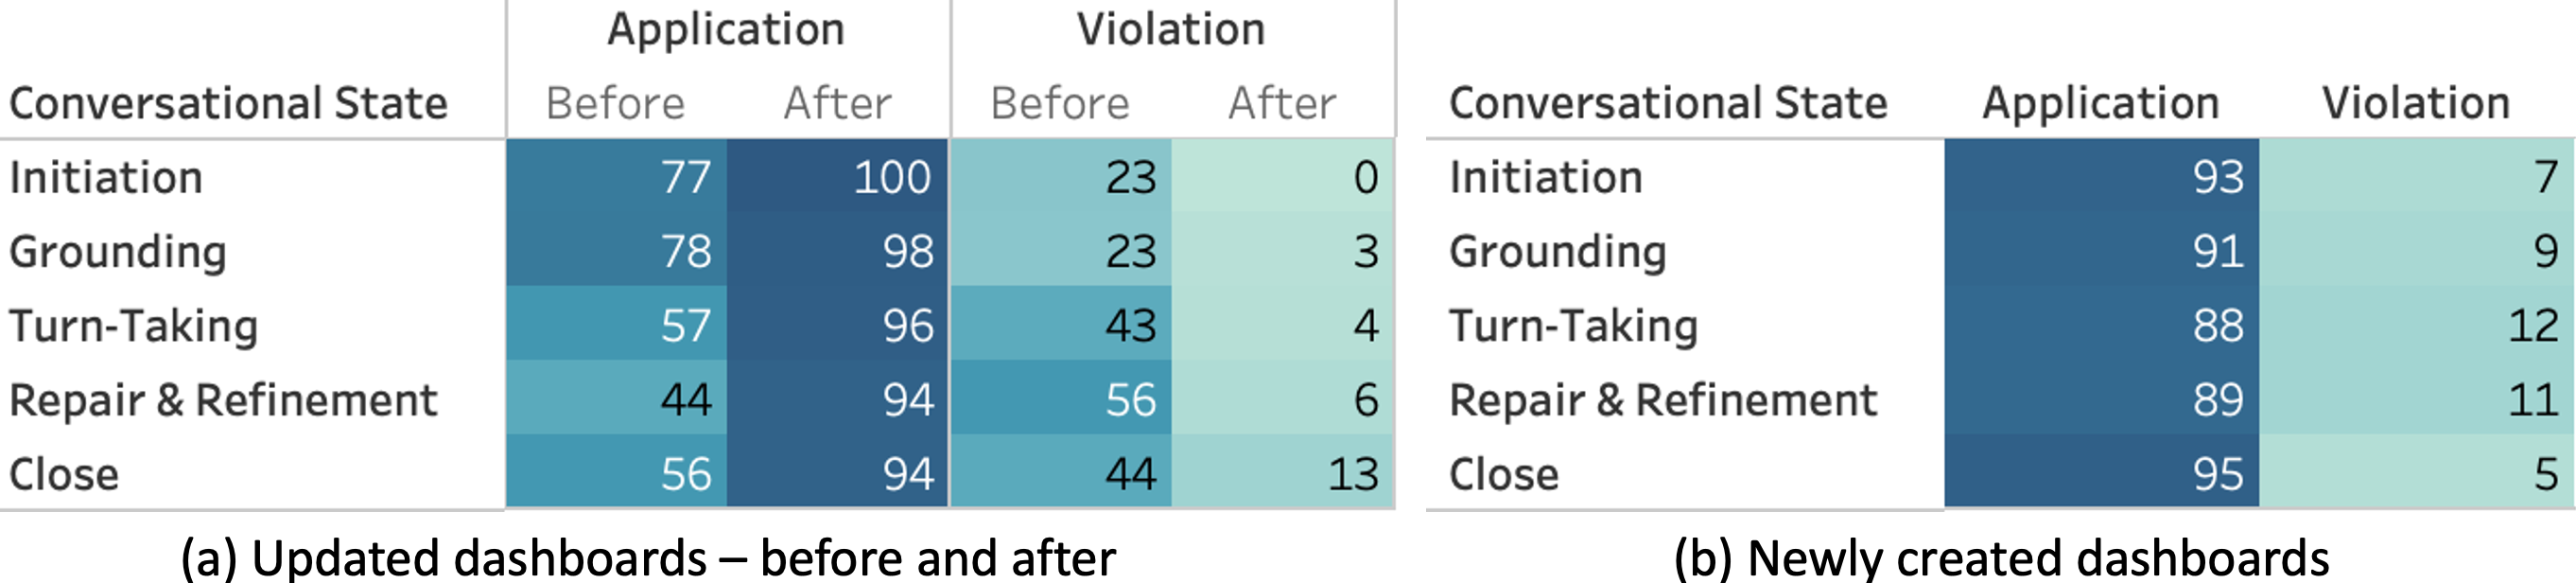
Figure 3: Part B heatmaps showing frequencies of applying or violating conversational heuristics.
Dashboard Redesigns
Subsequent assignments tasked students with designing or redesigning dashboards to align with cooperative principles. Students reported the heuristics enhanced their focus on user interaction and data communication clarity.
Discussion
The study finds that many dashboards underperform in maintaining conversational flow, particularly in allowing dynamic user interactions and facilitating error handling. The discussion emphasizes the need for dashboards to evolve beyond static displays to engaging dialogue systems.
Future Work
Future research should explore combining these heuristics with visual design methodologies to create comprehensive dashboard creation tools. There's potential for extending these cooperative principles to broader analytical systems and non-dashboard interfaces.
Conclusion
This paper introduces a novel framework for considering dashboards as cooperative partners in data analysis. The proposed heuristics provide a structured approach for enhancing dashboard interactivity and communication, thereby paving the way for more intuitive user experiences in data-driven environments. The insights and feedback gained through expert and educational applications suggest possible directions for future refinement and evolution of interactive dashboards.

