- The paper demonstrates that using the full test set drastically lowers variance in metric evaluations by approximately 99%.
- The study shows that limiting evaluations to realistic system pairs reveals near-zero ROUGE-1 correlation with human judgment.
- The modifications align evaluation methodology with practical applications, urging more granular and accurate metric assessments.
Re-Examining System-Level Correlations of Automatic Summarization Evaluation Metrics
This paper addresses the inconsistencies within the current frameworks used to evaluate automatic summarization metrics and proposes modifications to align these frameworks more closely with practical use cases. The study scrutinizes two key areas: the evaluation dataset size and the system pair quality used in system-level correlation assessments.
Introduction
Automatic summarization evaluation metrics, such as ROUGE, BERTScore, and QA, are integral in assessing the quality of generated summaries without extensive human annotation. The standard method involves calculating system-level correlations to determine how well these metrics mirror human judgment. However, common practices fail to reflect the way these metrics are applied for system evaluations in research development, leading to potentially unreliable assessments.
Improving System-Level Correlation Estimations
Utilizing the Full Test Set
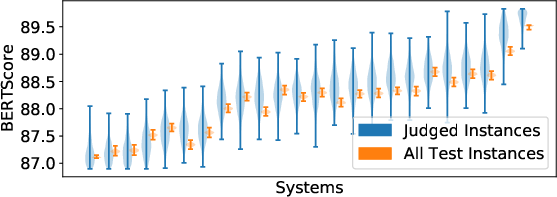
The paper suggests calculating system scores using the complete test set of summaries instead of only the human-judged subset.
Reducing Variance in Metric Evaluations
By utilizing more comprehensive datasets, the estimated variance of the automatic metric scores declines sharply (approximately 99% on average), enhancing ranking stability and confidence in the evaluation outcomes.
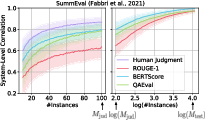
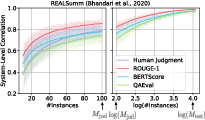
Figure 2: Bootstrapped estimates of the stabilities of the system rankings for automatic metrics and human annotations on Summ (left) and REAL (right). The tau value quantifies how similar two system rankings would be if they were computed with two random sets of M input documents. When all test instances are used, the automatic metrics' rankings become near constant. The error regions represent ±1 standard deviation.
Evaluating Metrics with Realistic System Pairs
Adjusting the Quality Gap in Evaluations
Current practices offer a skewed view by including all system pairs, even those with large score differentials, in evaluations. This paper proposes measuring correlations only among systems that have minor performance discrepancies, mimicking realistic usage scenarios.
- Findings: When the evaluation is limited to such realistic pairs, very popular metrics, such as ROUGE-1, show negligible correlation with human judgment (approximately zero), contradicting prevalent beliefs regarding its efficacy in tighter benchmarks.
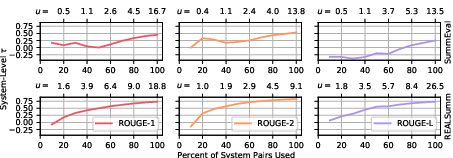
Figure 3: The sys\Delta(\ell,u) correlations on the Summ (top) and REAL (bottom) datasets for ℓ=0 and various values of u for ROUGE-1, ROUGE-2, and ROUGE-L.
Implications and Recommendations
This study suggests that future evaluations should calculate metrics over entire datasets to lower estimation variance and more accurately reflect the typical gap in system quality when reporting metrics. Although current metrics achieve moderate correlations over larger ranges, they falter when systems perform closely, pointing to a need for improvements in metric sensitivity.
Practical measures should involve obtaining more accurate and consistent human judgments or enhanced methodology for metric evaluations with high granularity in system performance. Moreover, when new metrics are proposed, reporting more granular correlation assessments would provide a better perspective on their reliability.
Conclusion
The proposed evaluation modifications effectively reduce the variance and improve the precision in estimating system-level correlations, aligning evaluations better with practical applications. These changes unveil significant weaknesses within popular metrics like ROUGE, emphasizing the pressing demand for their enhancement and the need for additional high-quality human evaluations. Future work must focus on developing metrics capable of distinguishing subtle differences in system performance to maximize reliability in real-world scenarios.