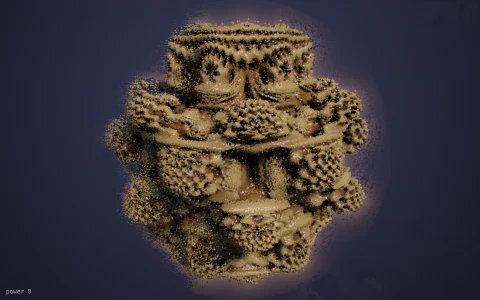
Escaping Mandelbrot orbits stacked into a deep-space nebula by Metropolis-Hastings.
For each c outside the Mandelbrot set, the orbit of z -> z^2 + c flies off to infinity, and the Buddhabrot plots every point that orbit visits on the way out, piling millions of orbits into a density map. Orbits that escape after 10 to 50, 50 to 500 and 500 to 5,000 iterations make three maps that become the blue, green and red channels (the 'Nebulabrot' coloring), each with its own levels, square-root compression and a film-like shoulder; the real axis runs vertically, which is how the figure got its name. Most random c contribute nothing to a given view, so each channel runs a Metropolis-Hastings chain whose target is the number of orbit points landing in the frame: small log-uniform jumps plus occasional fresh uniform samples, accepted with probability min(1, F'/F), with each visit deposited at weight 1/F so the image stays unbiased. Mirror-image orbits come free by symmetry, and the short-orbit channel is binned at half resolution to keep its haze smooth. Zoom anywhere and the chains retarget to the new frame while the previous picture fades out behind it.
Try it. Scroll to zoom, drag a box to zoom into it, click to zoom in at a point, and right-click or Esc to zoom out. Click a channel in the legend (or press 1, 2 or 3) to hide it, Space steps through a tour of views that includes a tiny Buddha hidden in the crown, E changes the exposure and 0 returns to the whole figure.
Paste this into Claude Code, Codex or any coding agent to get a simple version running, then take it wherever you like.
Render a Buddhabrot, the Mandelbrot set drawn from its escaping orbits, with JavaScript and the HTML canvas element. Put everything in a single index.html file with no libraries or build step, so I can open it directly in a browser.

Start simple:
- Make a canvas that fills the window, stays sharp on high-DPI screens (scale by devicePixelRatio), and resizes with the window. Use a black background.
- Keep a Float32Array density buffer, one value per pixel. Map the complex plane so the real axis runs vertically (real -2 at the top) and the view spans about -2 to 1 on the real axis.
- Every frame, pick a few thousand random points c in the box from -2 to 2 in both directions. Skip any c inside the main cardioid or the period-2 disc (they never escape), iterate z = z^2 + c from z = 0 up to 1,000 times, and if the orbit escapes (|z| > 2), iterate it again and add 1 to the density at every point it visited.
- Draw the buffer with putImageData, using the square root of density divided by a high percentile of the densities, so the faint outer structure shows.
- Keep accumulating across frames: the image gets less noisy as you watch.

Once that works, make it a nebula:
- Keep three buffers for orbits that escape after 10 to 50, 50 to 500 and 500 to 5,000 iterations, and use them as the blue, green and red channels, each with its own brightness level.
- Every orbit of c has a mirror image (the orbit of its conjugate), so add the mirrored points too for twice the detail for free.
- Use a soft shoulder like x / (1 + x) instead of clipping so the bright core stays colorful.

Explain the key ideas in short code comments. When you're done, tell me how to open it and suggest three directions I could take it next, such as Metropolis-Hastings sampling so zoomed views fill in quickly, zooming with the mouse wheel, or rendering a large print-quality image.