Exact hydrogen wavefunctions as glowing 3D point clouds, colored by quantum phase.
Up to 70,000 points are drawn from the exact hydrogen wavefunction, built from Laguerre and associated Legendre polynomials and sampled through inverse CDFs of the radial and angular parts, so every cloud is a true picture of |psi|^2. Hue is the complex phase: real orbitals show their two signed lobes, complex ones a rainbow that winds m times around the axis, and the whole pattern turns at a rate set by the energy. Superposition presets mix two states using importance sampling, so the cloud sloshes at the beat frequency, which is how an atom radiates; when the transition is dipole allowed, faint wavefronts spread out in the color of the emitted spectral line. A radial probability plot shows the nodes, and the cloud is splatted additively, tone mapped and bloomed.
Try it. Drag to rotate. Press 1 to 6 for single orbitals and 7, 8, 9 and 0 for superpositions such as the Lyman alpha and red Balmer alpha transitions. Arrow keys change n and l, [ and ] change m, C switches between real and complex orbitals, and Space jumps to the next stop on the tour.
Paste this into Claude Code, Codex or any coding agent to get a simple version running, then take it wherever you like.
Build a 3D point cloud of hydrogen atom orbitals with JavaScript and the HTML canvas element. Put everything in a single index.html file with no libraries or build step, so I can open it directly in a browser.

Start simple:
- Make a canvas that fills the window, stays sharp on high-DPI screens (scale by devicePixelRatio), and resizes with the window. Paint it deep navy.
- Write the hydrogen wavefunction psi(n, l, m) in atomic units as a radial part times an angular part. Compute the radial part with the generalized Laguerre polynomial recurrence and the angular part with the associated Legendre recurrence. Start with real orbitals (cos(m phi) or sin(m phi)) so psi is just positive or negative.
- Sample points from |psi|^2 by rejection sampling: pick random points in a cube big enough for the orbital, and keep each one with probability |psi|^2 divided by a maximum you estimate first. Collect about 20,000 points over several frames.
- Rotate the cloud slowly around the vertical axis, project it with a simple perspective divide, and draw each point as a tiny square: one color where psi is positive, another where it is negative.
- Let the number keys switch between a few orbitals such as 1s, 2p, 3d and 4f.

Once that works, make it beautiful:
- Replace rejection sampling with exact sampling: tabulate the cumulative distribution of r^2 R(r)^2 and of the angular part and invert them, so even large orbitals sample instantly.
- Accumulate points additively into a Float32Array image, then tone map it, so dense regions glow instead of clipping. Fade far points to give depth.
- Use complex orbitals (e^(i m phi)) and color each point by its phase with a smooth cyclic palette. Add drag to rotate with inertia.

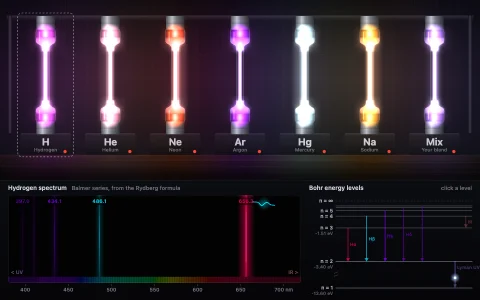
Explain the key ideas in short code comments. When you're done, tell me how to open it and suggest three directions I could take it next, such as superposing two states so the cloud sloshes at the transition frequency, plotting the radial probability with its nodes, or adding the energy level diagram with spectral lines.