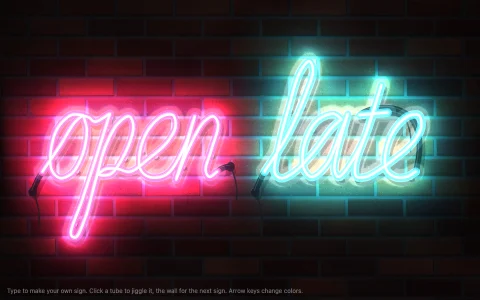
Glowing gas tubes whose colors are computed from their real spectral lines.
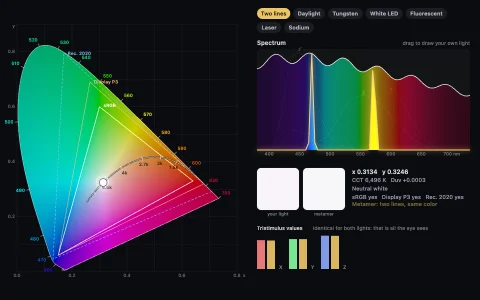
Each tube's glow is not picked from a palette. Every gas is a table of its strongest emission lines (hydrogen's straight from the Rydberg formula), and the lines are summed through the CIE 1931 color matching functions into XYZ, converted to linear sRGB, and tone mapped so the bright capillary over-exposes toward white like a photograph. A bloom pyramid of repeatedly halved buffers adds the halo and the reflections on the bench. The spectroscope splits the selected tube into its lines; for hydrogen, electrons fall between Bohr energy levels and each fall fires a photon at its line, and for the other gases a chromaticity diagram shows the glow as the center of mass of its lines.
Try it. Click a tube (or press 1 to 7) to point the spectroscope at it. Drag a gas tube onto Mix to pour it in, or drag the Mix sliders to blend your own color. Click a hydrogen energy level to drop an electron from it, hover the spectrum to read wavelengths, and press Space to switch the power off and strike the tubes again.
Paste this into Claude Code, Codex or any coding agent to get a simple version running, then take it wherever you like.
Build a glowing gas discharge tube display with JavaScript and the HTML canvas element, where each tube's color is computed from its real spectral lines. Put everything in a single index.html file with no libraries or build step, so I can open it directly in a browser.

Start simple:
- Make a canvas that fills the window, stays sharp on high-DPI screens (scale by devicePixelRatio), and has a near-black background.
- Write the CIE 1931 color matching functions as the Wyman, Sloan and Shirley multi-lobe Gaussian fit (three short formulas for x, y and z bar), so no data tables are needed.
- Give four gases a short list of their strongest visible lines as [wavelength in nm, relative intensity]: hydrogen (656.3, 486.1, 434.0, 410.2), neon (a dozen lines between 585 and 703), sodium (589.0 and 589.6) and mercury (404.7, 435.8, 546.1, 577.0, 579.1).
- For each gas, sum intensity times the matching functions to get X, Y and Z, convert to linear sRGB with the standard 3x3 matrix, add white until no channel is negative, scale so the largest channel is 1, then gamma encode.
- Draw a row of vertical tubes (rounded rectangles with a thin bright core) in those colors, and below them a black strip that shows the selected tube's lines as thin vertical bars at their wavelengths, each tinted with its own spectral color.

Once that works, make it beautiful:
- Add bloom: draw the glowing parts into a small offscreen canvas, shrink it two or three times with drawImage, and add the copies back over the scene with globalCompositeOperation = "lighter".
- Over-expose the tube cores so they burn toward white while the halo keeps the gas's color.
- Click a tube to show its spectrum, and add a wavelength axis in nanometers.

Explain the color science in short code comments. When you're done, tell me how to open it and suggest three directions I could take it next, such as a hydrogen energy level diagram that fires photons at its lines, mixing gases into new colors, or plotting each tube on a CIE chromaticity diagram.