- The paper presents ChartSync, a benchmark that formalizes visuo-logical cascading editing (VLCE) for statistical charts by synchronizing text and geometric changes.
- It details a three-phase pipeline combining semantic instruction synthesis, code-driven generation, and expert quality assurance to ensure precise ground truth.
- Evaluation using objective metrics and VLM judgment reveals that while models often succeed in text edits, they struggle with geometric synchronization, highlighting key research gaps.
ChartSync: Benchmarking Visuo-Logical Cascading Chart Editing
Motivation and Problem Definition
Generative models for instruction-based image editing exhibit significant limitations when operating in the domain of statistical charts, where precise text-object and data-geometry synchronization are required. Unlike natural scene editing, chart editing is governed by strong underlying data-structure dependencies. Current approaches often focus on text-level substitutions, neglecting the requisite visuo-logical coupling needed to preserve and propagate data-driven geometric relations. To formalize this evaluation gap, Visuo-Logical Cascading Editing (VLCE) is introduced as the canonical task, which explicitly demands synchronous modification of chart text and coupled geometry, as clearly exemplified by chart types such as pie and bar charts.
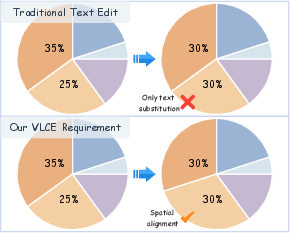
Figure 1: VLCE is illustrated as requiring synchronous spatial (geometric) alignment upon data or text modifications, in contrast to naive instruction-based editing.
Although chart editing has been explored via intermediate code-level solutions, such as extracting plotting scripts for subsequent modification, these approaches are hampered when original source code is unavailable or the chart-image-to-code pipeline is lossy and imprecise. The need for robust direct pixel-space editing strategies is evident, yet the absence of rigorous, expert-validated benchmarks for geometric synchronization inhibits progress.
Benchmark Construction: The ChartSync Pipeline
ChartSync constitutes a curated benchmark for the rigorous evaluation of generative VLCE, comprising 870 expert-validated triplets (original image, edit instruction, edited ground truth) across 9 chart types and 4 editing paradigms. Notably, 235 of these instances focus on geometry-coupled VLCE, where textual edits are inherently tied to geometric state updates.
The dataset is constructed through a three-phase programmatic pipeline:
- Semantic Instruction Synthesis: A VLM proposes candidate edits by extracting key-value pairs and generating instruction prompts, favoring complex, non-trivial chart elements.
- Code-Driven Chart Generation: An LLM-powered code generator edits chart-generation scripts to deterministically realize visuo-logical propagation required by the instruction, with a strict logic validator ensuring consistency and code safety.
- Expert Quality Assurance: All constructed data is inspected by multiple PhD-level AI experts, enforcing consensus around edit goal clarity, geometric coupling, and absence of artifacts.
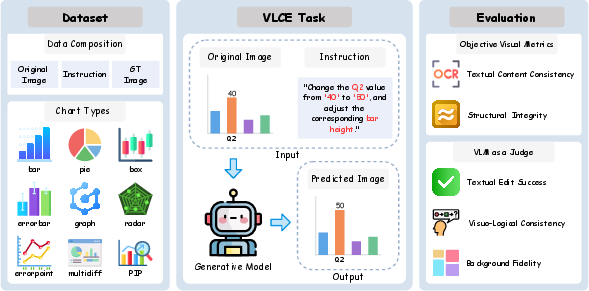
Figure 2: ChartSync consists of the dataset, a VLCE task specification, and a two-tiered evaluation protocol.
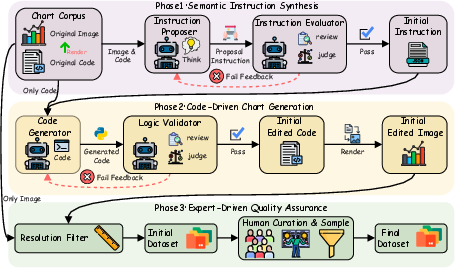
Figure 3: Data construction involves instruction generation, logic-validated programmatic code editing, and final expert review, ensuring high-fidelity GT for both text and geometry.
This pipeline ensures ChartSync uniquely supplies deterministic, high-precision ground truth for both text and spatially-coupled geometric elements. The dataset design also encompasses standard and advanced chart structures, such as bar, box, error, graph, radar, PIP, and multidiff, providing a diverse testbed for multimodal reasoning.
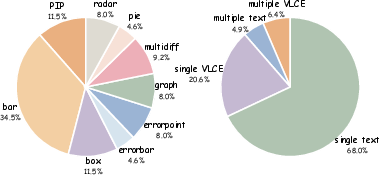
Figure 4: Distribution of chart categories and editing task types exhibits broad coverage of both visual and logical complexity within ChartSync.
Evaluation Protocol
A two-tiered evaluation strategy is employed, integrating both standard objective metrics and a VLM-as-a-Judge paradigm:
- Objective Visual Metrics:
- OCR F1 Score: Measures the semantic and spatial fidelity of textual content.
- SSIM: Captures pixel-wise structural similarities between prediction and ground-truth.
- VLM Judgment:
- Textual Edit Success Rate (TESR): Discrete measure of textual realization accuracy.
- Visuo-Logical Consistency Score (VLCS): Evaluates if paired geometric elements underwent appropriate visuo-logical transformation, strictly penalizing models that only update text without geometric synchronization.
- Background Fidelity Score (BFS): Judges the integrity of non-target chart regions, penalizing visual bleeding or unintended corruption.
The VLCS, in particular, is essential for evaluating whether a model executes cascading reasoning from data / text edits to geometry—a core ChartSync innovation.
Experimental Results
A battery of 14 image editing models, spanning recent open-source and proprietary vision-language architectures, were benchmarked alongside a code-mediated pipeline.
Key findings:
- Severe Failure of Cascading Reasoning: Most models demonstrate a marked capability gap, with strong TESR but subpar VLCS—i.e., they reliably edit text but rarely synchronize geometry with data edits. For example, Qwen-Image-Edit-2511 achieves TESR 61.8 vs. VLCS 13.8, reinforcing the lack of visuo-logical coupling.
- Proprietary Model Lead, But Not Universally: Only select proprietary models (e.g., Nano Banana Pro, GPT-Image-2) show strong VLCE, with VLCS up to 83.7. Other proprietary and open-source models remain confined to literal substitutions, lacking dependency-aware reasoning.
- Code-mediated Editing Limitations: While high TESR and OCR F1 are achieved, code-based pipelines exhibit substantial geometric and visual fidelity loss when source code is not provided or accurately reconstructable.
- Illusion of Global Structure: High SSIM does not imply strong VLCE; many models maintain superficial layout while failing semantic/geometric isolation, as evidenced by low BFS and qualitative error patterns.
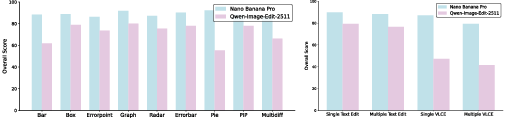
Figure 5: Comparative performance across chart categories and task complexities for proprietary and open-source systems, emphasizing significant capability disparities in VLCE.
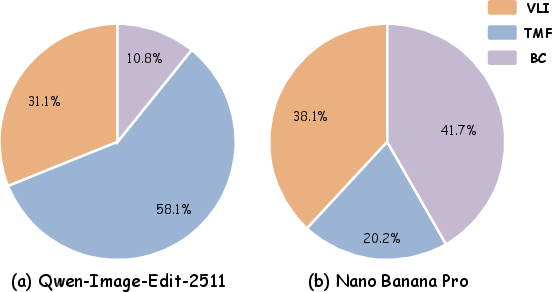
Figure 6: Error analysis within the VLCE subset reveals dominant failure modalities: Textual Manipulation Failure, Visuo-Logical Inconsistency, and Background Corruption.
The results codify a hard boundary in current generative editing. Only a subset of leading proprietary models begin to realize the hierarchical meta-abilities required: (1) foundation perception, (2) causal reasoning and synchronization, (3) high-fidelity generation with semantic isolation.
Qualitative Error Analysis
Representative qualitative cases demonstrate categorical model failure regimes and the challenge boundaries.
- Case 1: Open-source model Qwen-Image-Edit-2511 collapses both text rendering and geometry; proprietary Nano Banana Pro executes accurate multi-segment synchronization.
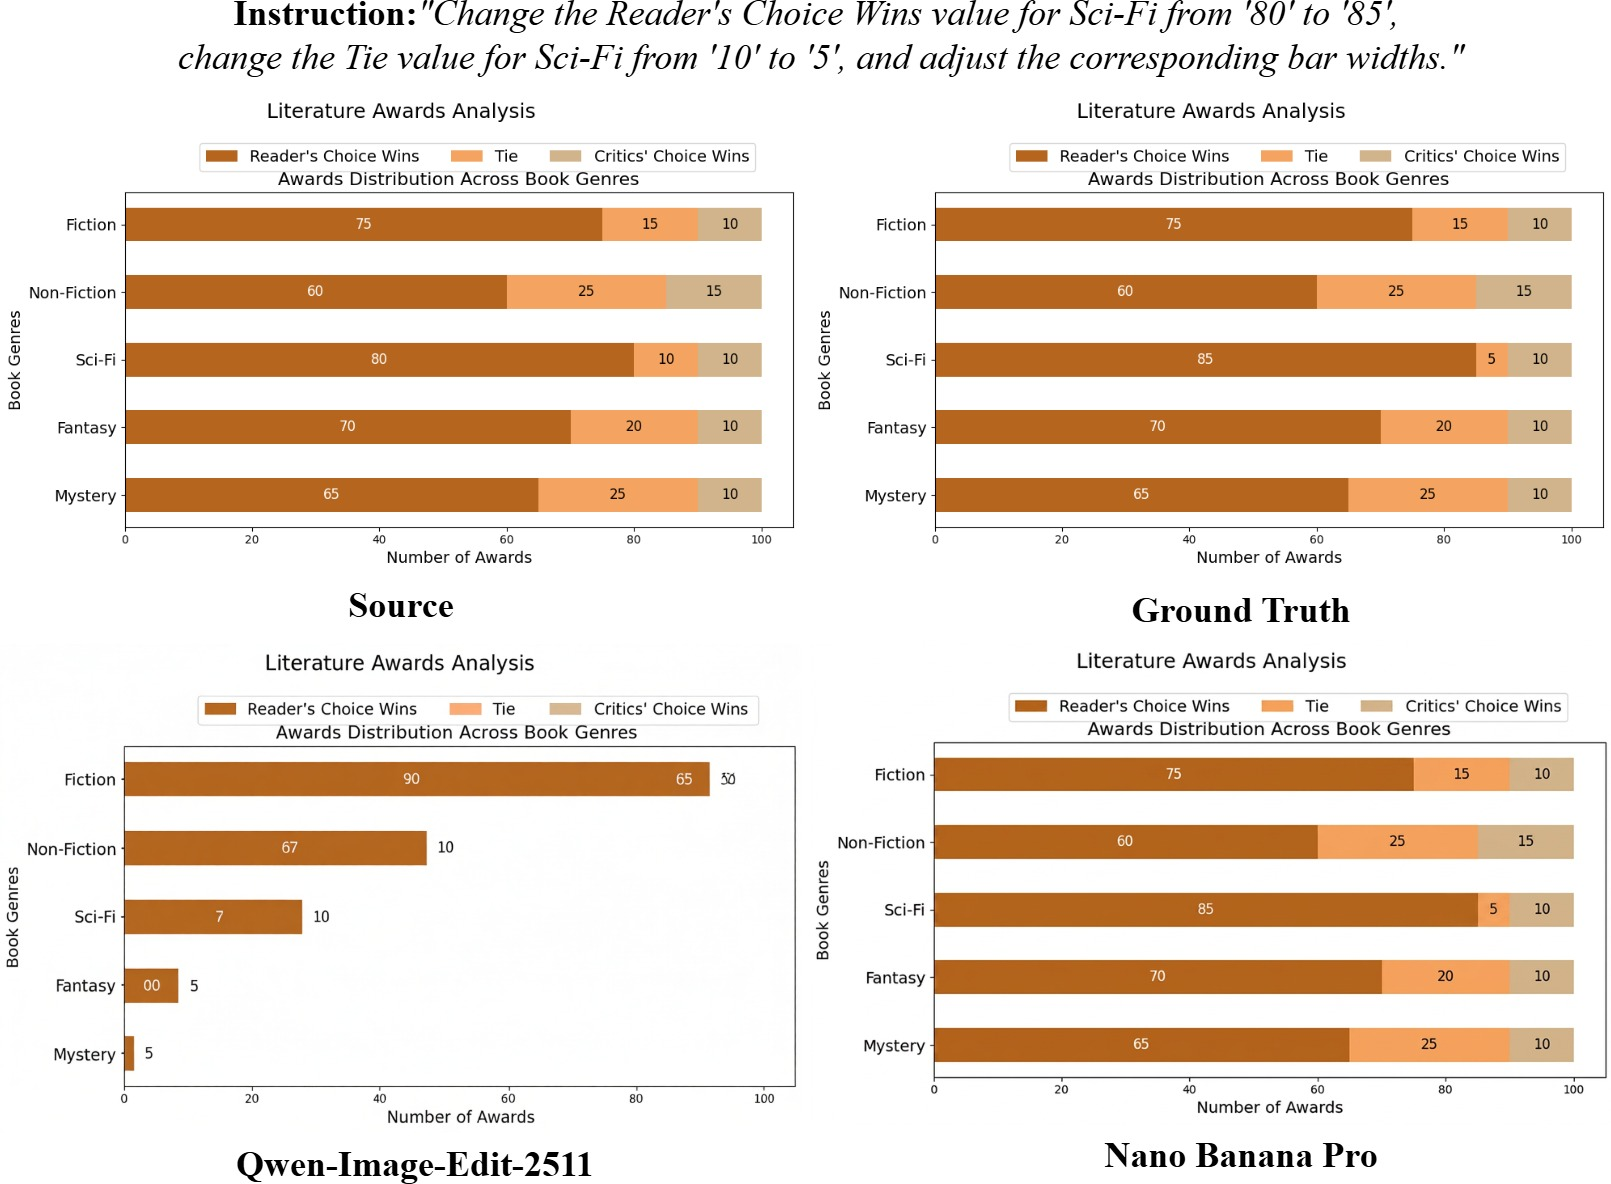
Figure 7: Nano Banana Pro perfectly updates both numerical values and corresponding geometric widths; Qwen-Image-Edit-2511 suffers label hallucination and geometric loss.
- Case 2: Open-source model edits text but not corresponding geometry, leading to critical VLI; proprietary model achieves exact text-geometry alignment.
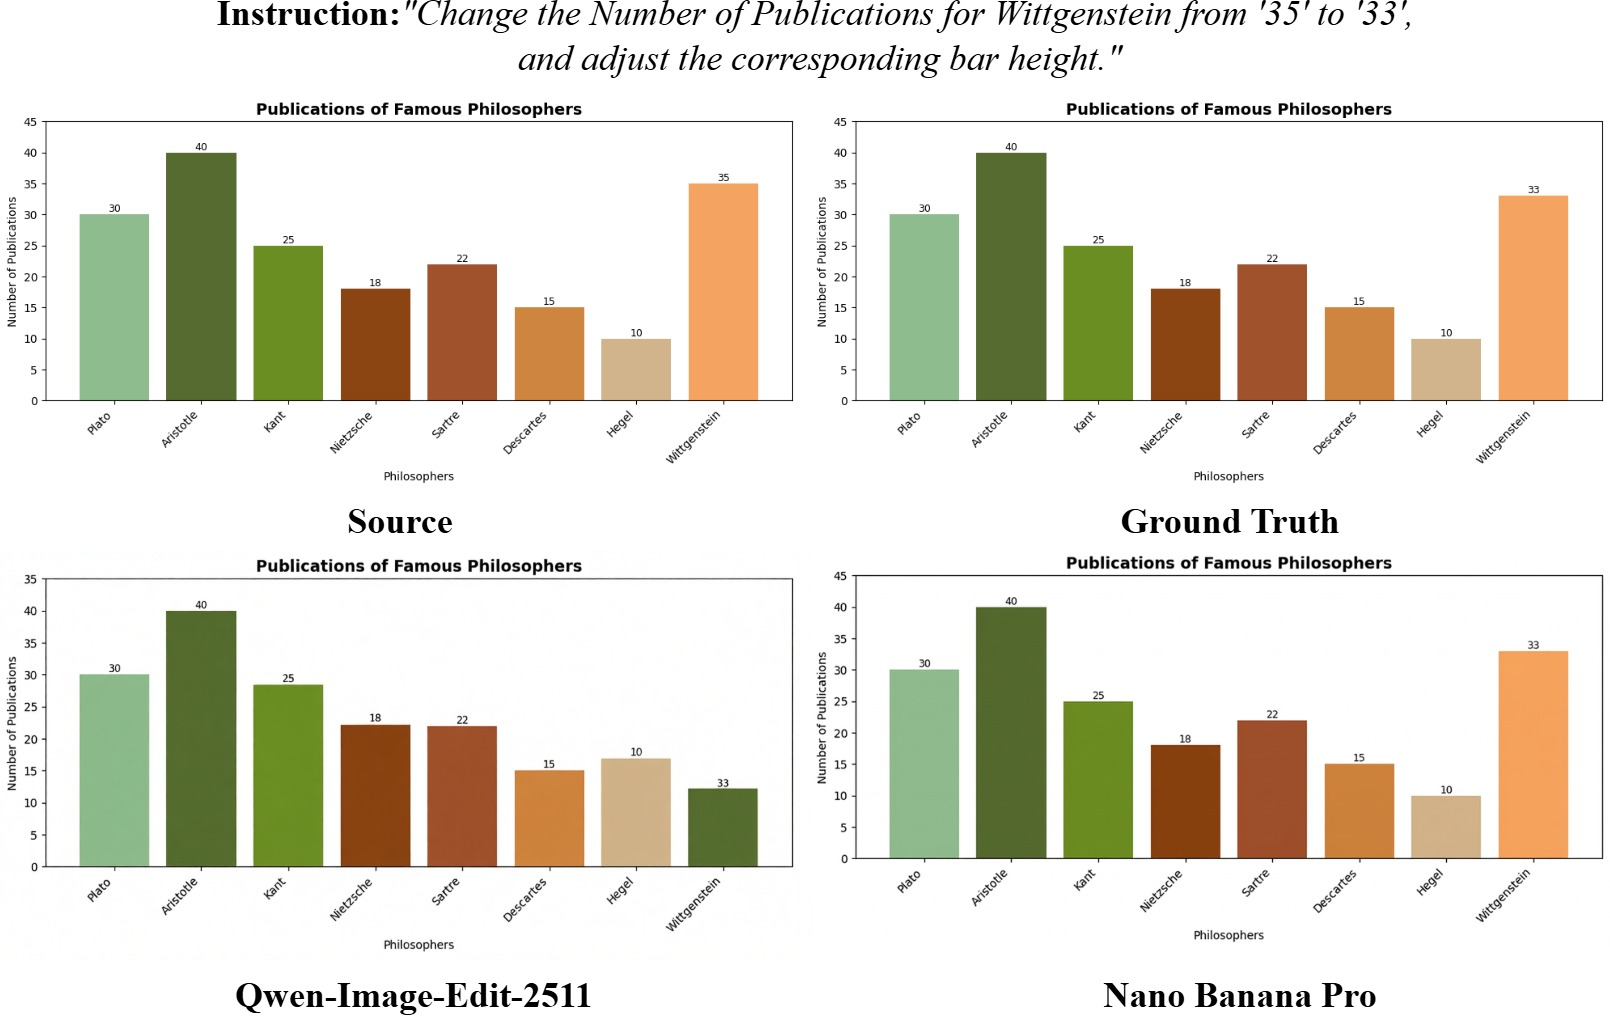
Figure 8: Only Nano Banana Pro maintains strict data-to-graphics synchronization across the instructed edit.
- Case 3: Even high-performing models can sporadically corrupt non-target (background) elements, indicating residual weaknesses in semantic isolation.
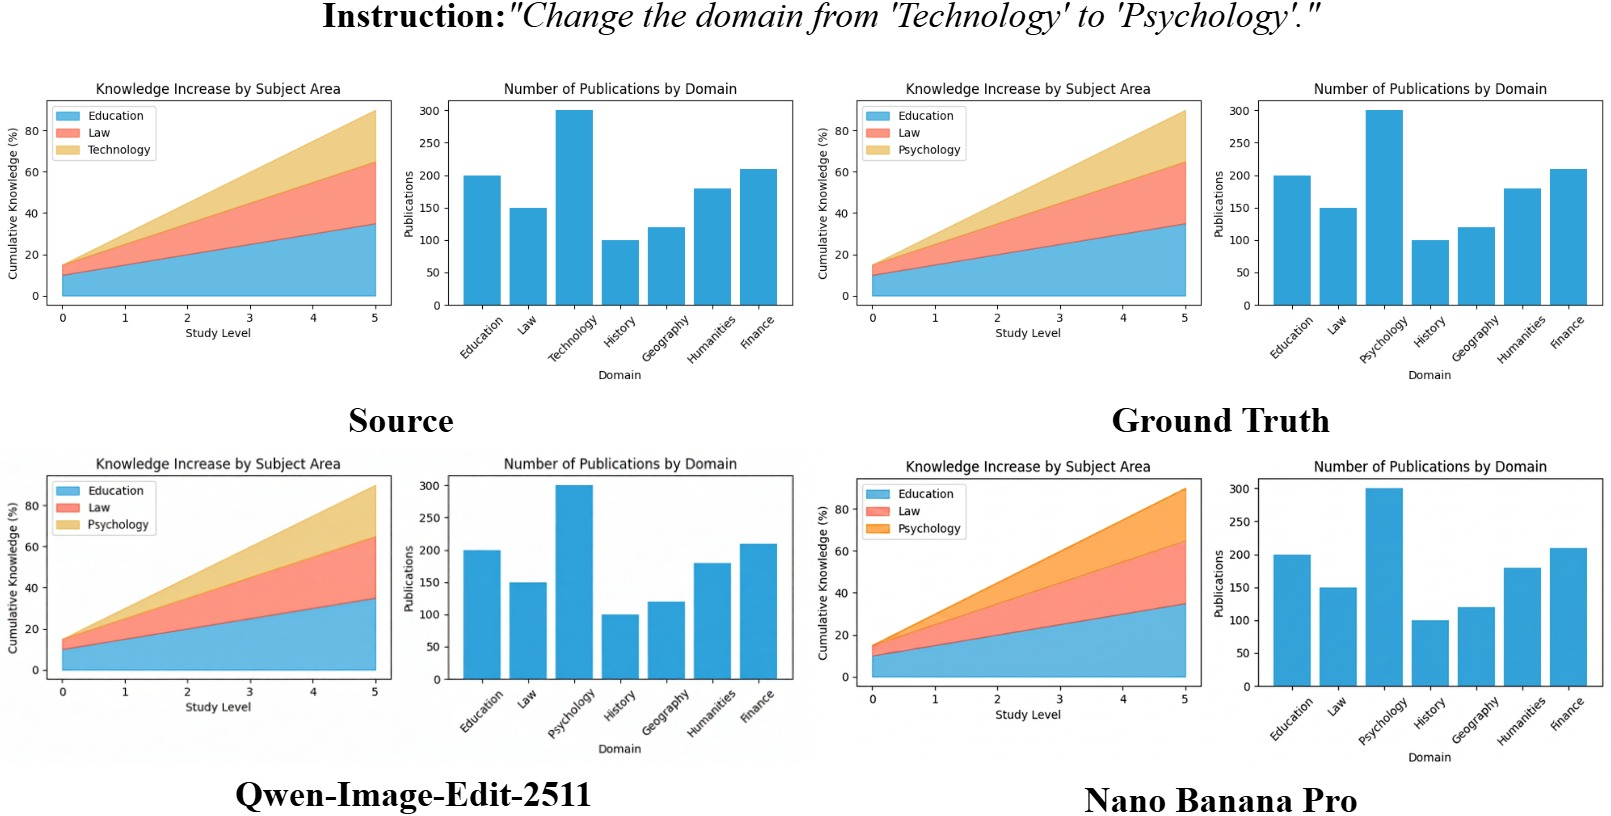
Figure 9: Both models perform correct text edits, but Nano Banana Pro inadvertently shifts non-target bar colors—an example of a residual error not representative of average performance.
- Case 4: Under highly coupled cascading dependencies, both top-tier proprietary and open-source models fail, demonstrating the non-saturated frontier of ChartSync.
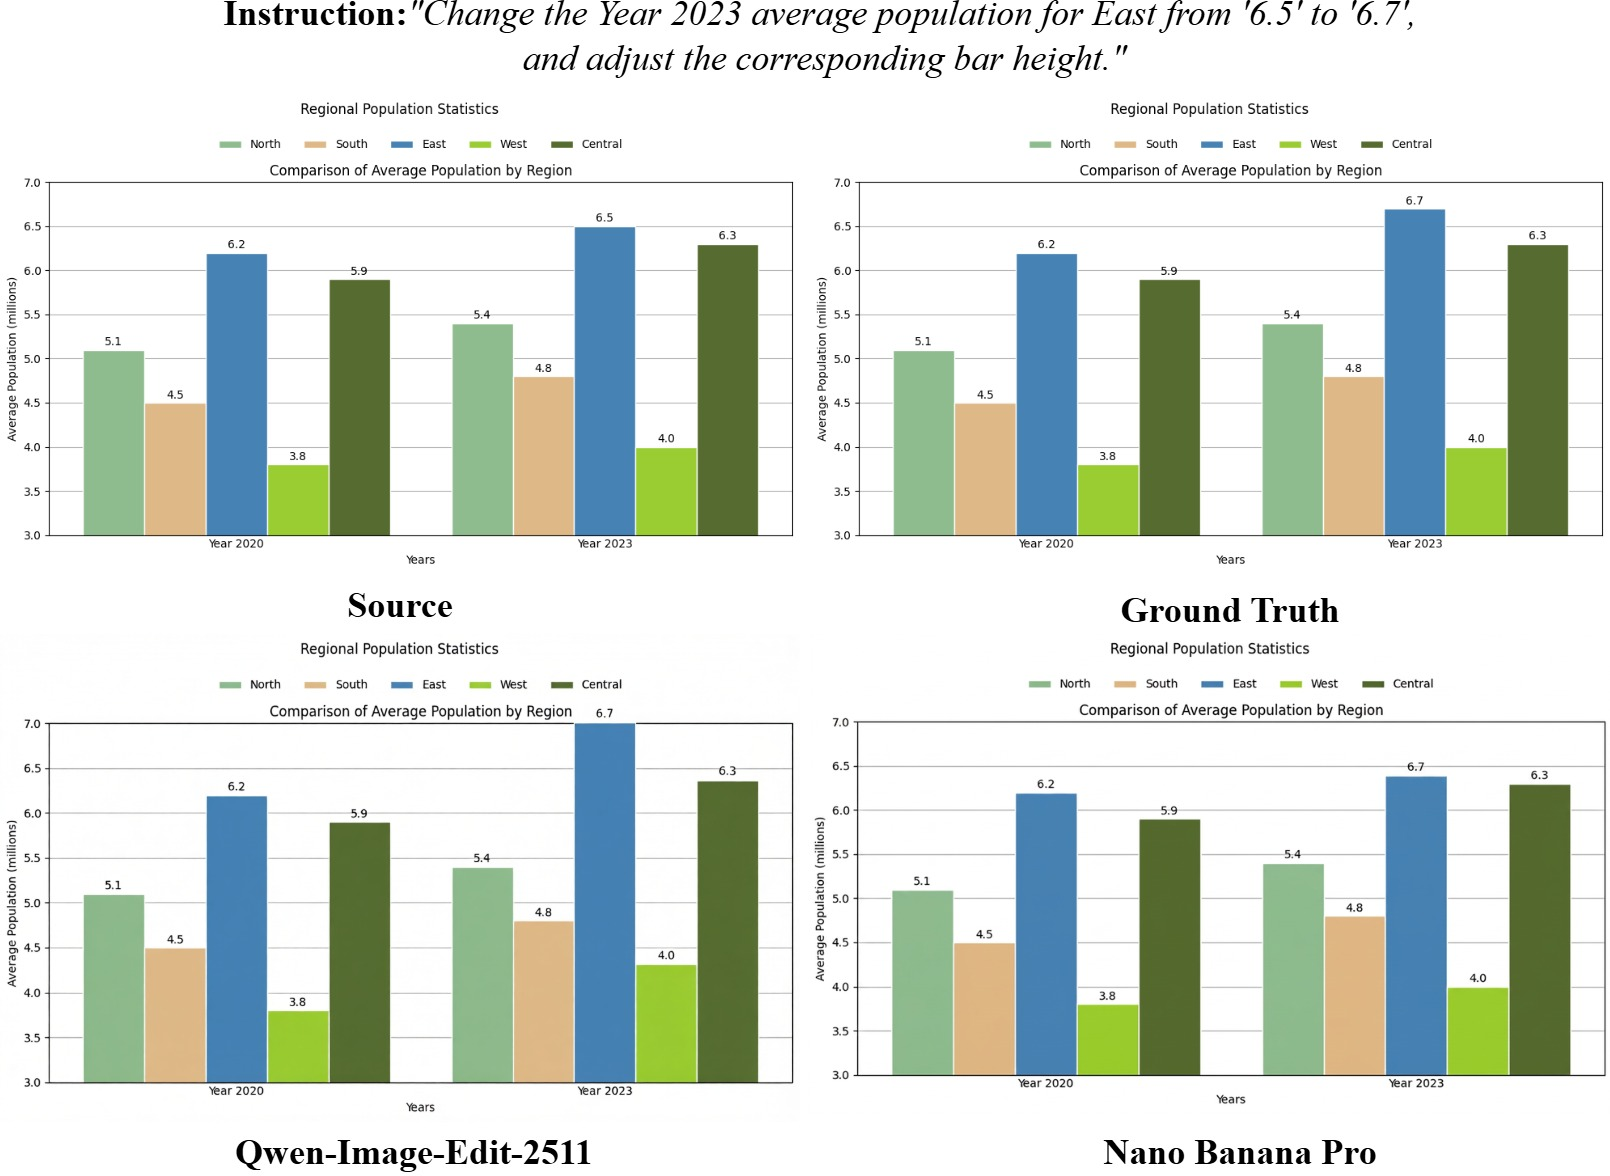
Figure 10: In complex cascading tasks, all models fail to accurately synchronize geometry, exposing the hardest open challenges in VLCE.
Implications and Future Directions
From a practical perspective, ChartSync exposes non-trivial specification gaps in generative editing models—most are not equipped for dependency tracking or structured cascading reasoning. The strong performance of select proprietary architectures may be linked to advances in visual-quantitative reasoning, hierarchical representation learning, or specialized component integration, though publicly reproducible mechanisms remain obscure. For open-source and future multimodal architectures, performance on ChartSync necessitates architectural innovations targeting explicit structural reasoning, advanced semantic grounding, and robust isolation mechanisms. Furthermore, the benchmark underscores the need for new training methodologies, potentially involving dual-modality supervision, explicit programmatic constraints, or even hybrid neuro-symbolic pipelines.
From a theoretical standpoint, ChartSync formalizes VLCE as an essential step in evaluating multimodal editing beyond surface-level manipulation—i.e., toward structured visual document understanding that parallels code reasoning, tabular manipulation, or graphical model prediction.
Conclusion
ChartSync defines a new standard for benchmarking multimodal generative model capacity for visuo-logical cascading editing, supplying a uniquely validated and challenging dataset. The two-tier evaluation formalism and strong error taxonomy elucidate core research challenges: foundational perception, synchronized structural reasoning, and high-fidelity artifact-free generation with robust semantic isolation. As ChartSync is adopted, requisite model improvements are expected to drive further integration of programmatic logic, spatial reasoning, and fine-grained multimodal alignment in future AI systems (2607.10301).