- The paper introduces a scene-graph based system that encodes entities, spatial relations, void space, and context for Chinese painting analysis.
- It leverages a TCP-specific vocabulary and four-layer queries to facilitate scalable, evidence-driven compositional exploration.
- User studies and case analyses validate the system’s ability to support iterative, hypothesis-driven cohort comparisons in art history.
CompoVista: Composition-Graph-Based Visual Analytics for Traditional Chinese Painting Collections
Motivation and Context
Compositional analysis in Traditional Chinese Paintings (TCPs) encodes rich spatial, narrative, and cultural-aesthetic information, central to art historical interpretation and stylistic comparison. Traditional methodologies emphasize close reading, but struggle to scale for large digitized corpora and are limited by qualitative, manual approaches. Computational strategies in digital art history have made advances in style analysis and semantic annotation, but remain deficient in modeling explicit compositional structures. CompoVista ("CompoVista: A Composition-Graph-Based Visual Analytics System for Compositional Analysis of Traditional Chinese Paintings" (2607.07105)) addresses this by introducing a scene-graph-based Composition Graph specific to TCPs and deploying an integrated, visual analytics system for scalable compositional exploration, comparison, and evidence inspection.
Composition Graph Model
CompoVista operationalizes composition analysis via a four-layer Composition Graph:
- Entity Layer: Nodes representing pictorial motifs annotated by category, bounding region, and coordinates. Uses a TCP-specific vocabulary refined from VisTCP (Zhou et al., 7 Jul 2026), organized by semantic classes: human figures, vegetation, landform, water, animals, artefacts.
- Relation Layer: Typed edges encoding spatial (location) and semantic (event) relationships among entities, allowing compositional structure to be objectively queried and compared.
- Void Space Layer: Annotated regions representing reserved white space, modeled as compositional primitives and detected via ink density and texture analysis with human verification.
- Context Layer: Painting-level metadata (artist, period, subject, format, material, etc.) providing scope for context-driven cohort construction, filtering, and comparison.
This structured representation enables fine-grained compositional queries and traceable groupings at scale.
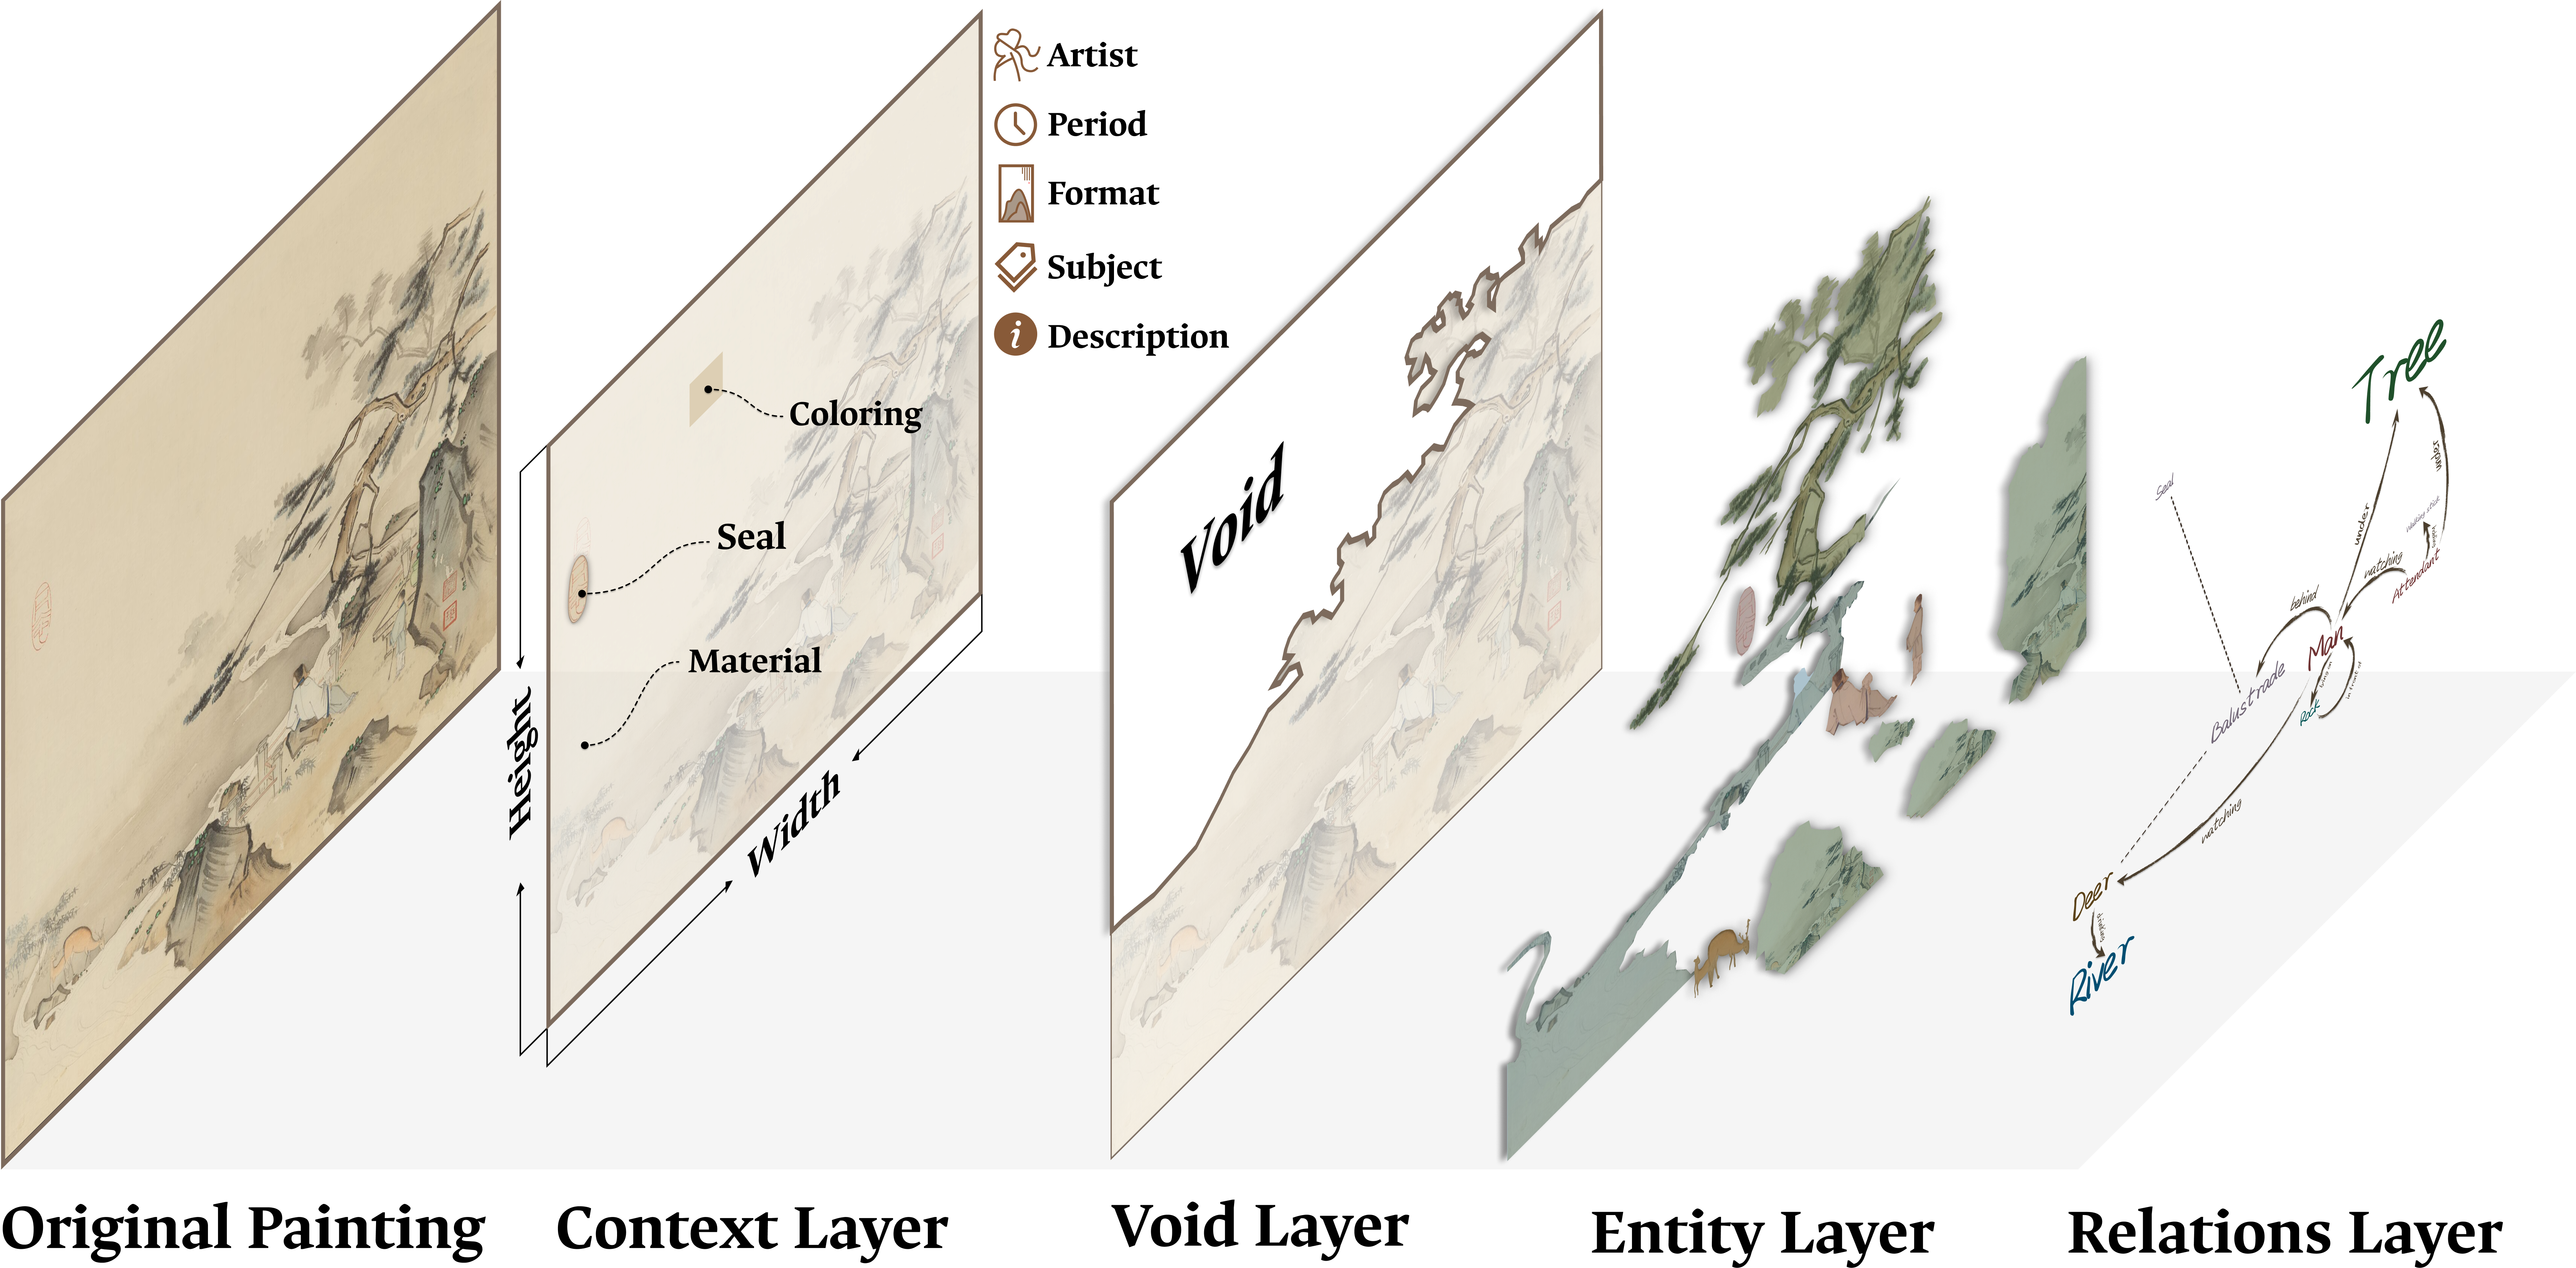
Figure 1: Four-layer Composition Graph example, encoding entities, spatial/semantic relations, reserved void space, and context for a TCP.
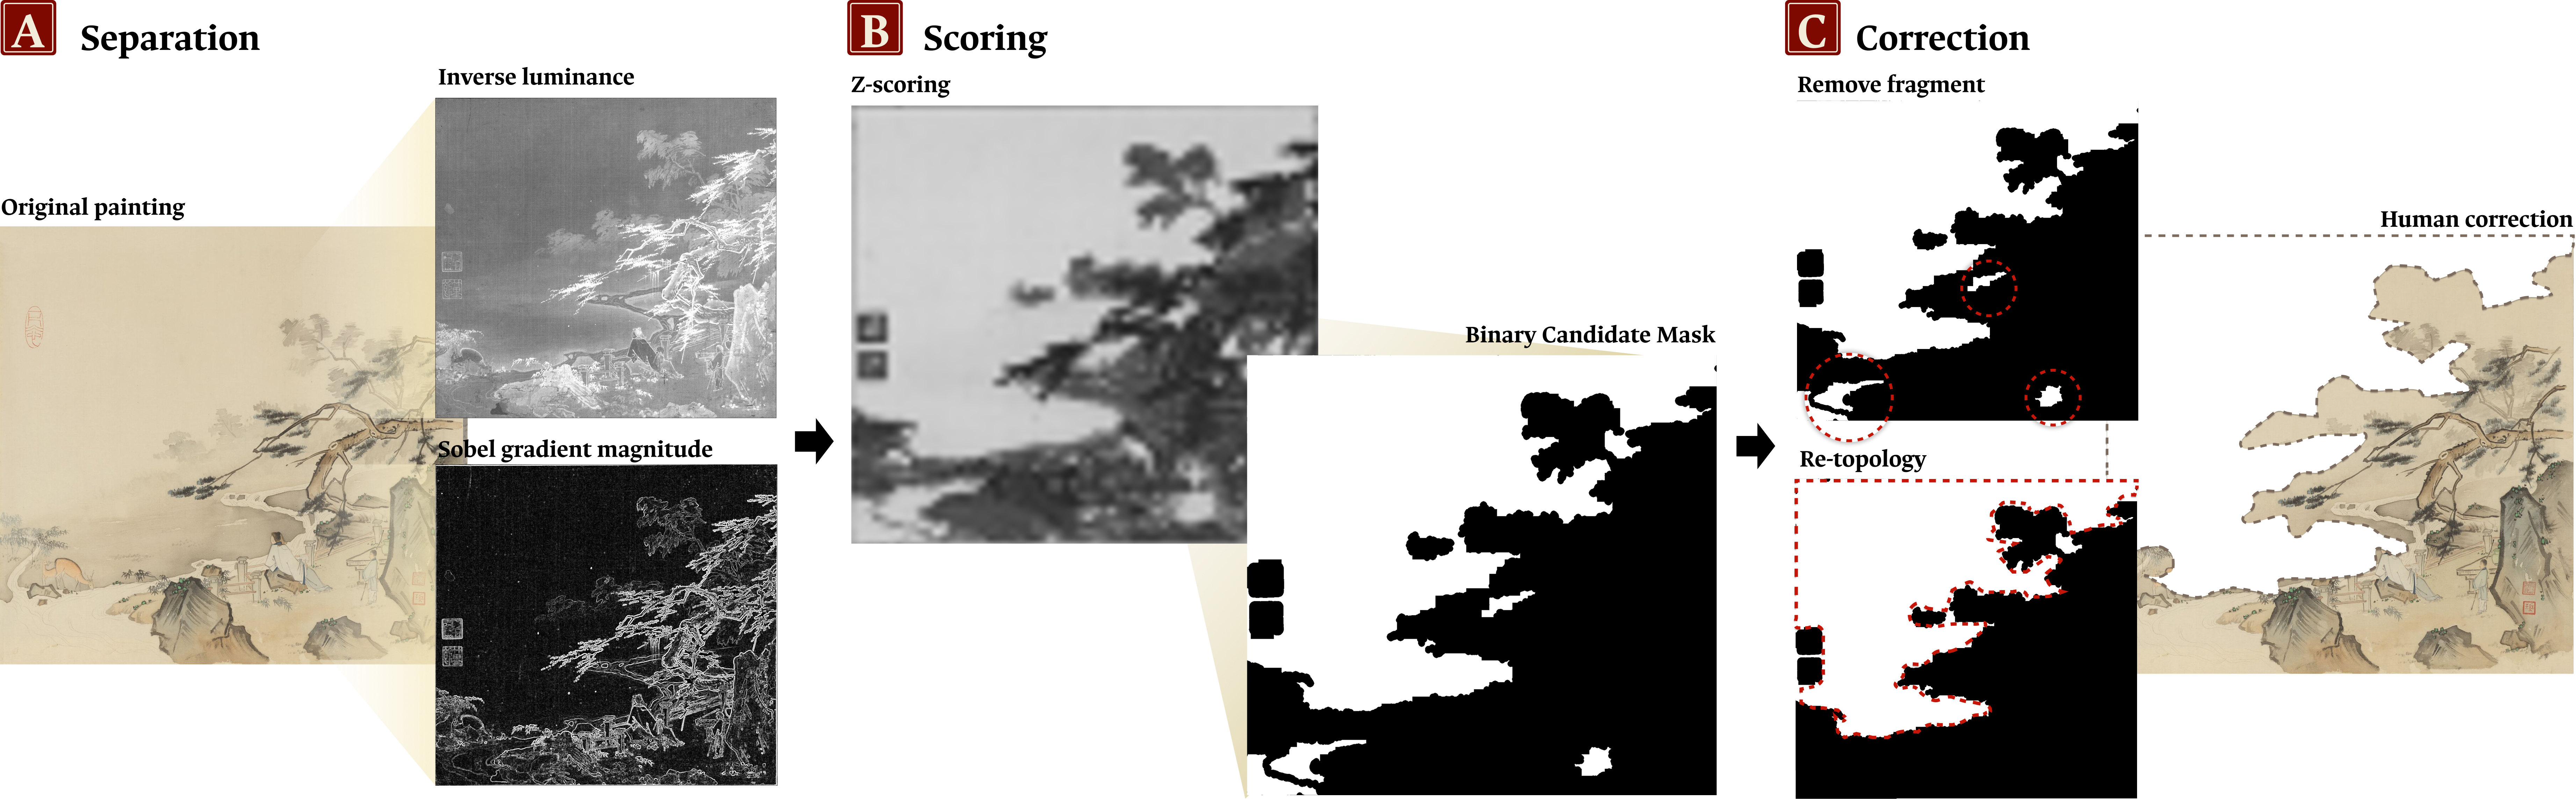
Figure 2: Construction process for void-space annotation, combining ink and texture density to identify and verify compositional voids.
System Design and Visual Analytics Workflow
CompoVista’s system architecture is realized through a canvas-based workspace supporting iterative, composition-oriented exploration. The workflow encapsulates:
- Scene Graph Annotation: Expert-guided annotation of paintings with entity, relation, void, and context data.
- Query and Matching: Visual-composition queries expressed via interactive Query Nodes, retrieving paintings through structure-aware, weighted matching of compositional elements and context filters.
- Cohort Construction and Summarization: Matched results form Cohort Nodes, supporting cohort-level analysis of spatial distributions, relation strengths, and void organization.
- Comparison and Evidence Inspection: Direct comparison of compositional tendencies across cohorts, supported by spatial and relational summaries, with drill-down to individual painting-level evidence for verification.
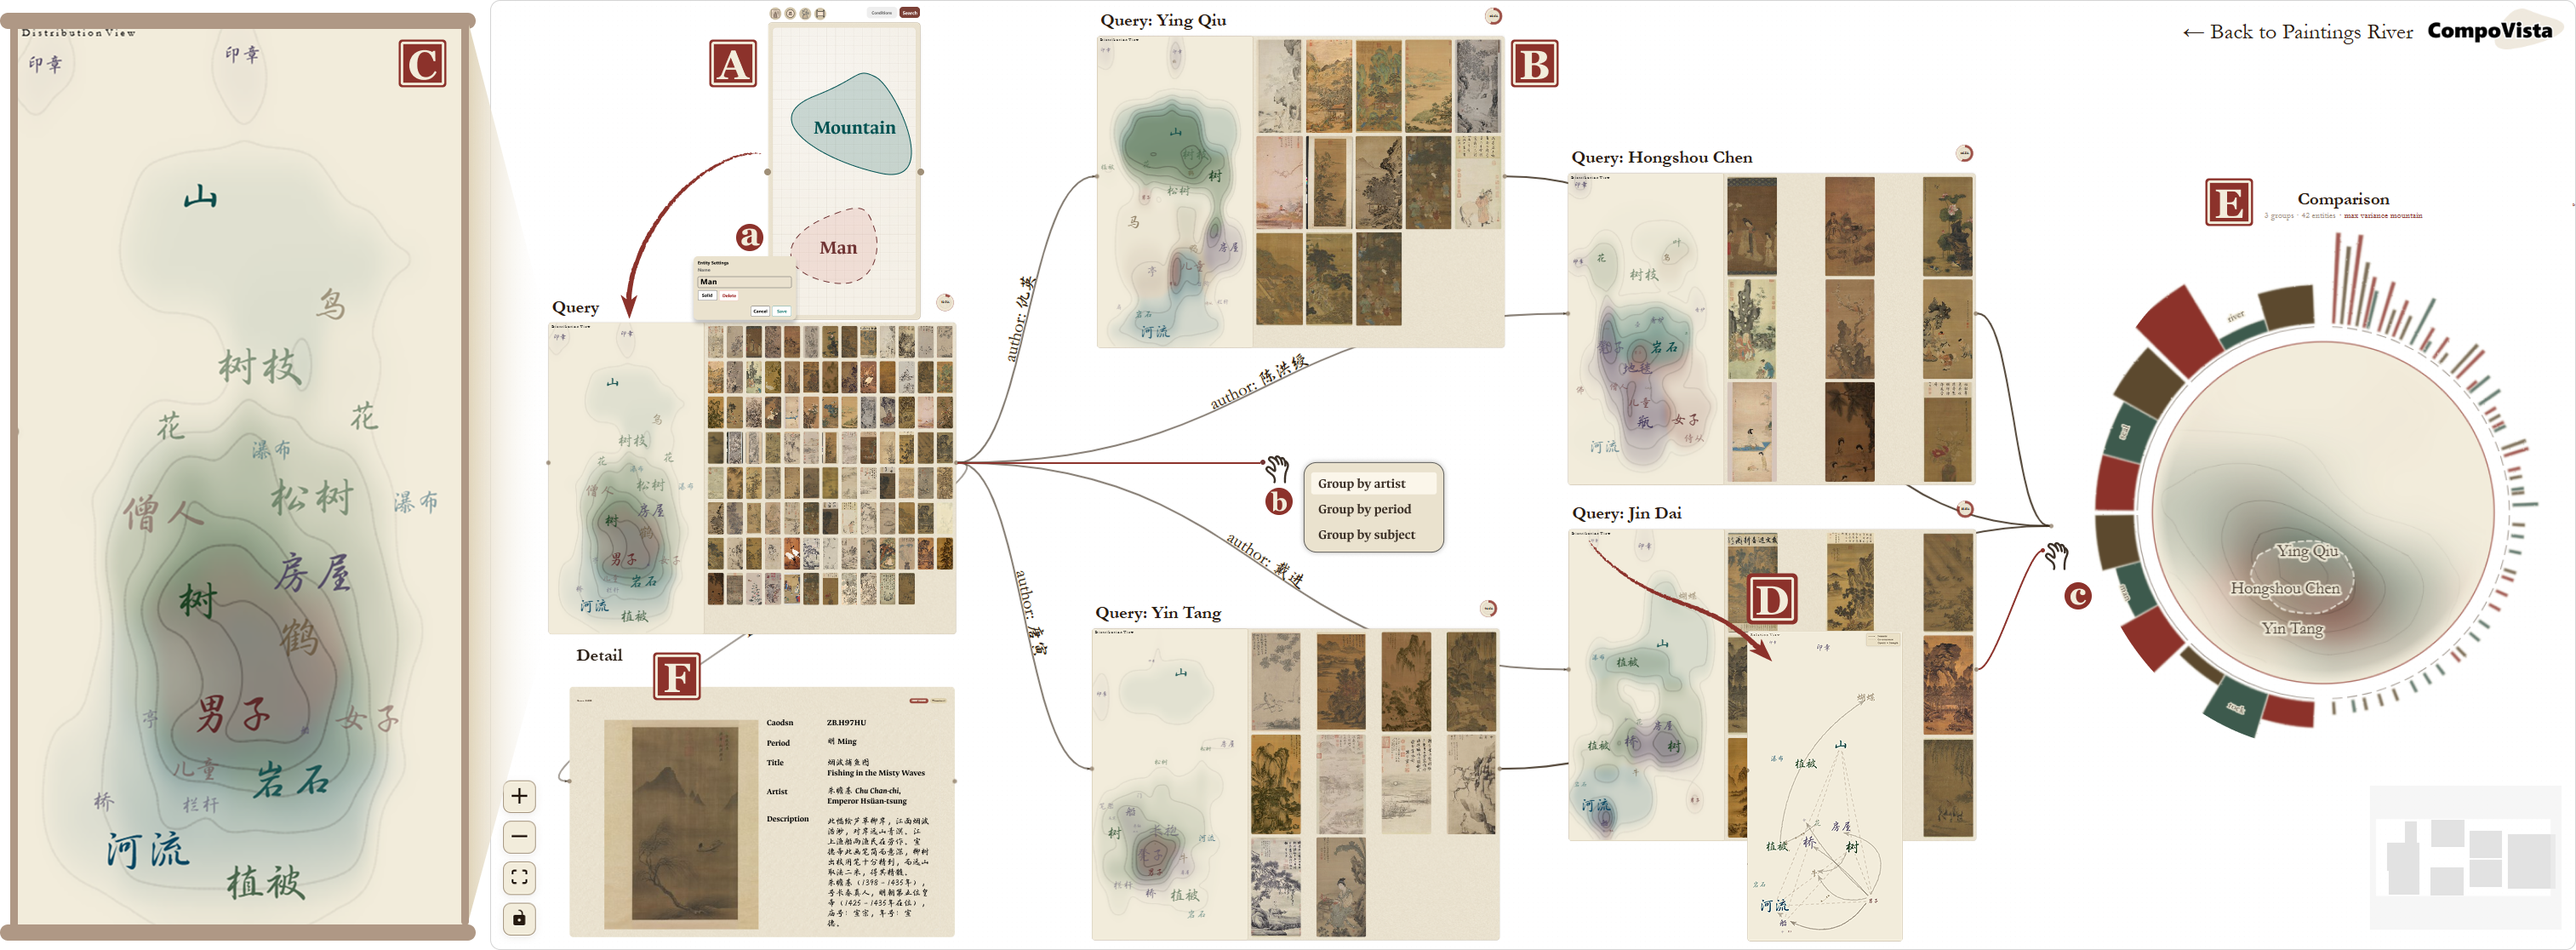
Figure 3: System overview: compositional querying, cohort construction, distribution and relations views, comparison workflows, and painting-evidence inspection.
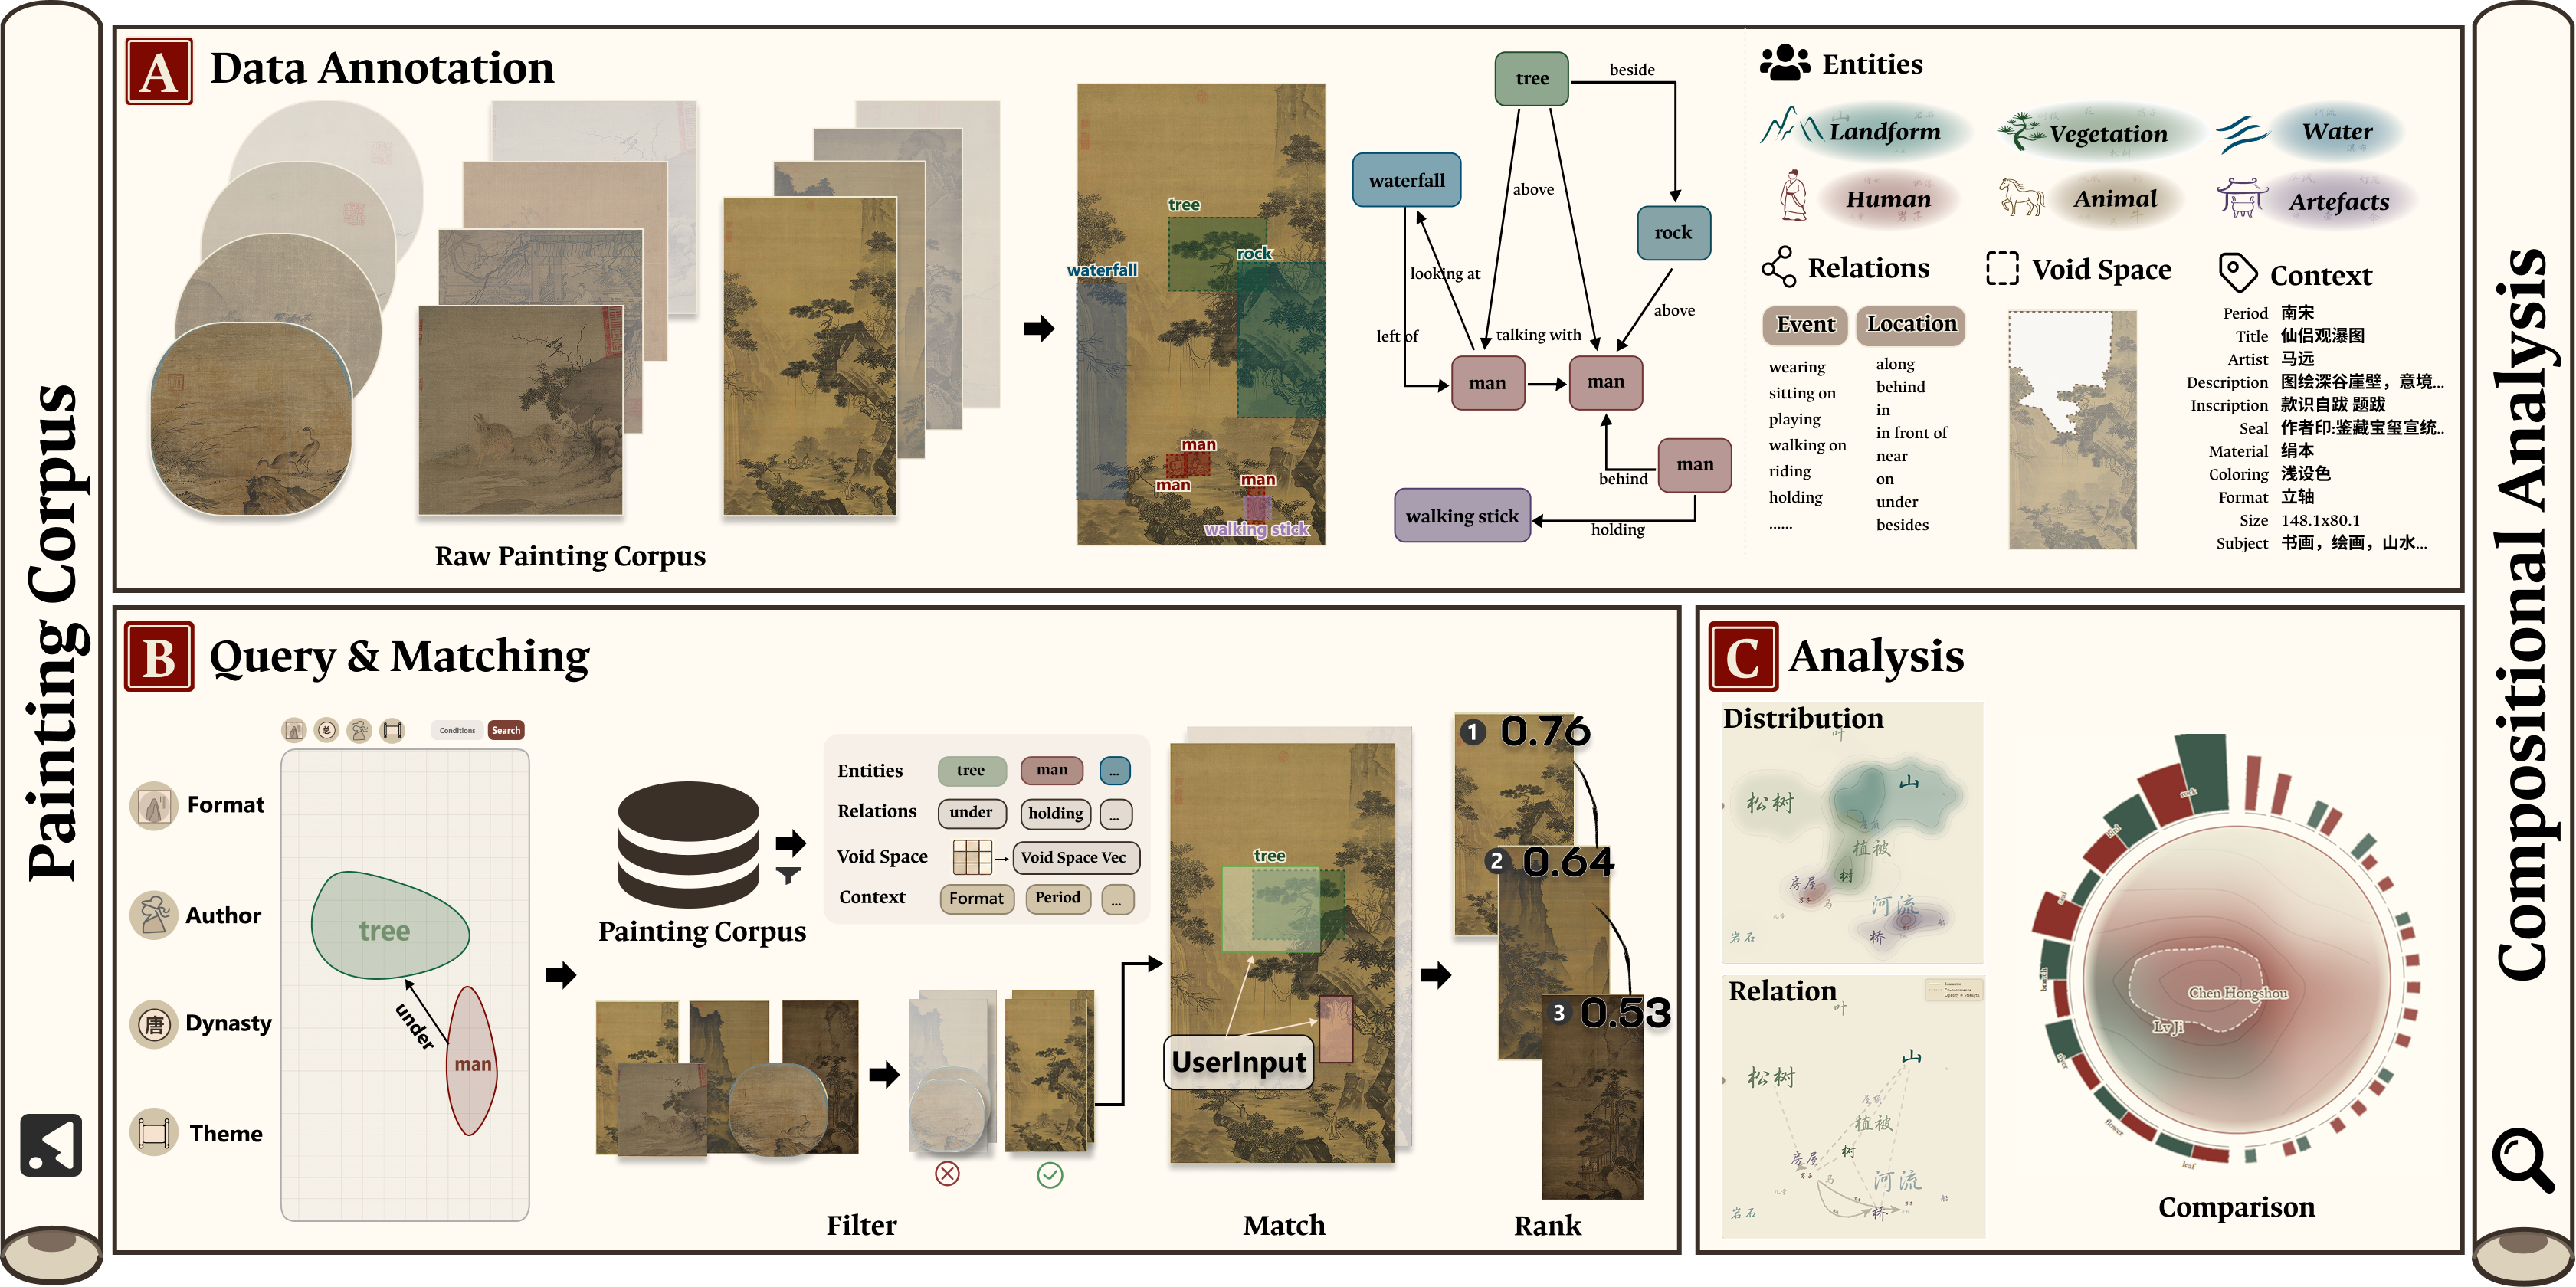
Figure 4: Workflow overview: annotation pipeline, visual query/matching, coordinated cohort analysis.
The visual summaries include:
- Distribution View: Spatial density of entities by normalized coordinates; font size encodes spatial area, opacity encodes frequency.
- Relations View: Visualization of entity associations and semantic relations within the cohort.
- Comparison View: Radial layout for multi-cohort entity prevalence, spatial density overlays, and relation difference chords.
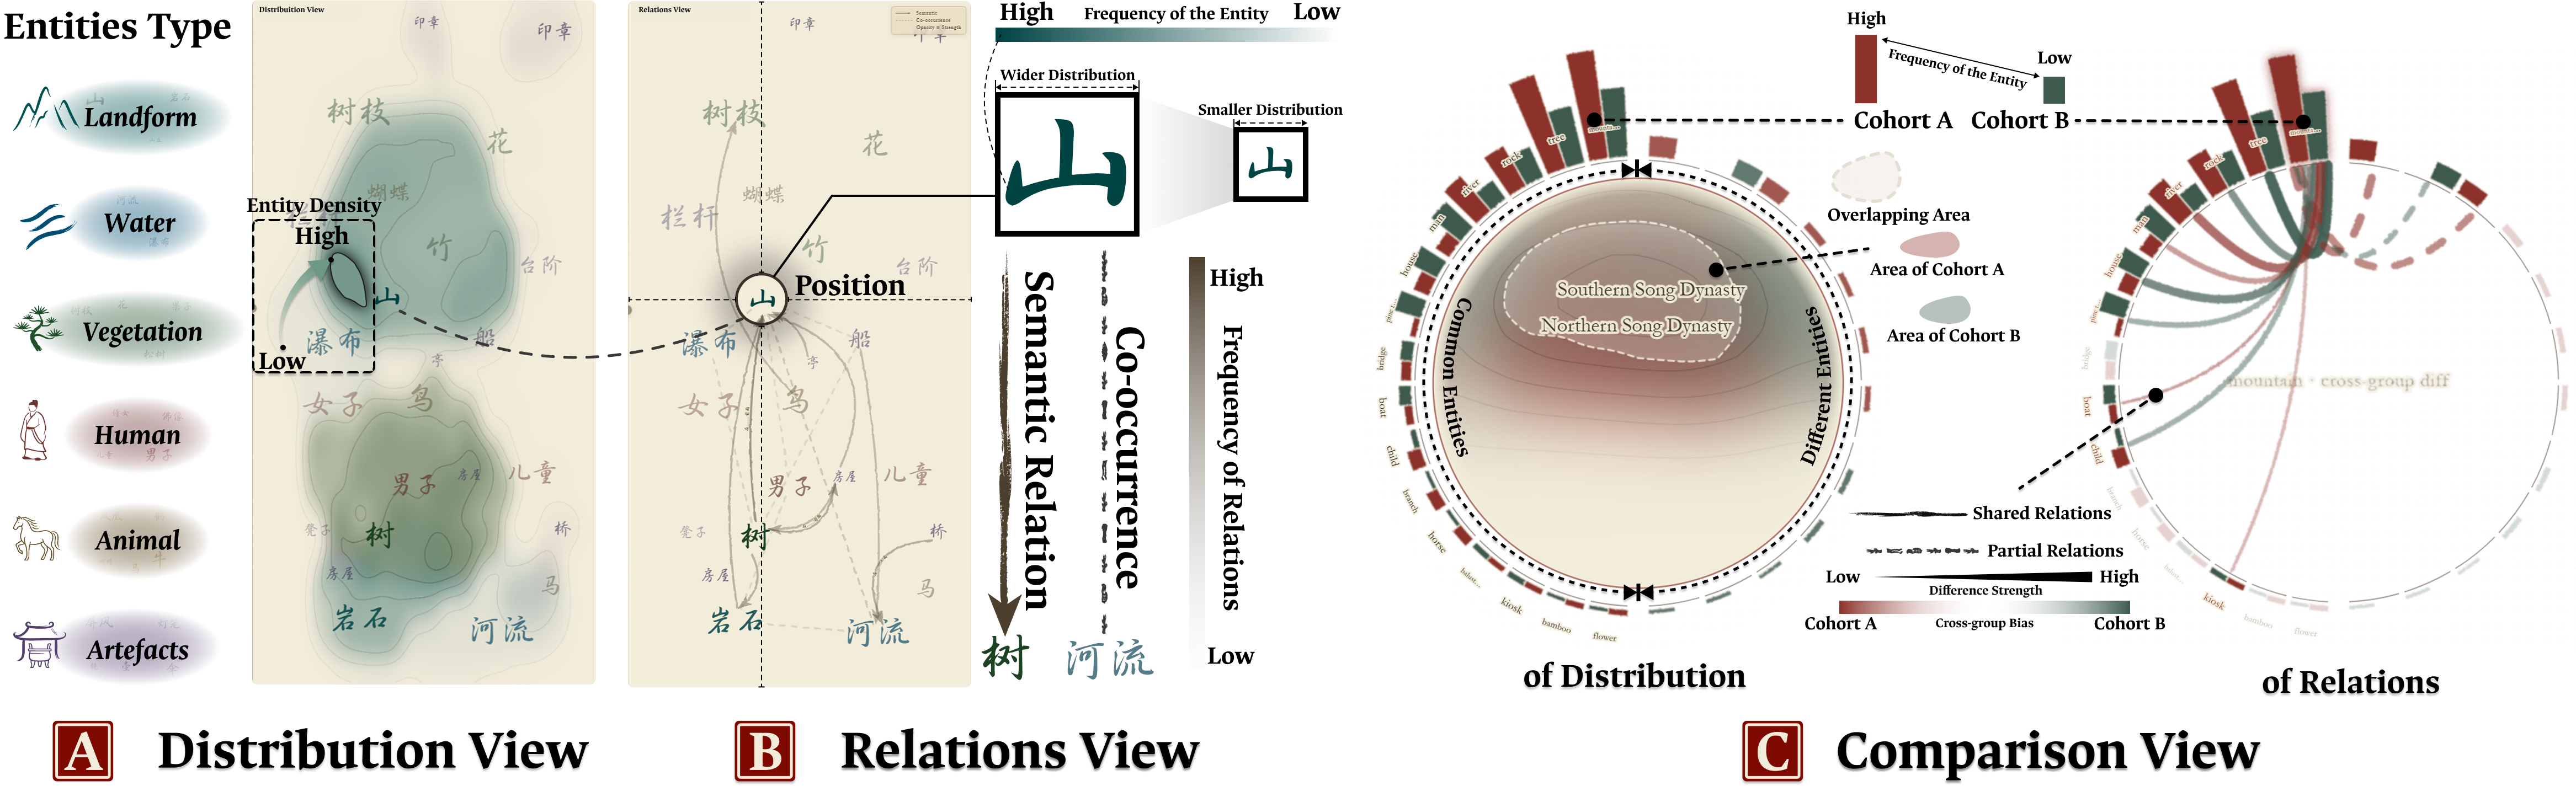
Figure 5: Visual designs for cohort-level compositional analysis, showing distribution, relations, and comparison encodings.
Evaluation: User Study and Case Analyses
A task-based user study with 12 domain-aware art historians, as well as expert interviews and two detailed case analyses, demonstrate the analytical usability and perceived value of CompoVista:
- Participants consistently enacted composition-oriented workflows: formation and refinement of cohorts, use of distribution/relations views, comparison, and return to painting-level evidence.
- The system supported both landscape-style and motif-based compositional analyses, e.g., dynastic shifts from central to corner layouts in Song landscapes, and semantic differences in fisherman postures and river composition schemes.
- Strong numerical results: All 12 participants constructed/refined cohorts; 10–12 performed evidence inspection; >80% agreed system fit research workflow and supported iterative exploration.
- Experts flagged explanatory needs (why paintings are matched/ranked), desiderata for fuzzy/approximate queries, and workflow enhancements for longer, provenance-rich explorations.
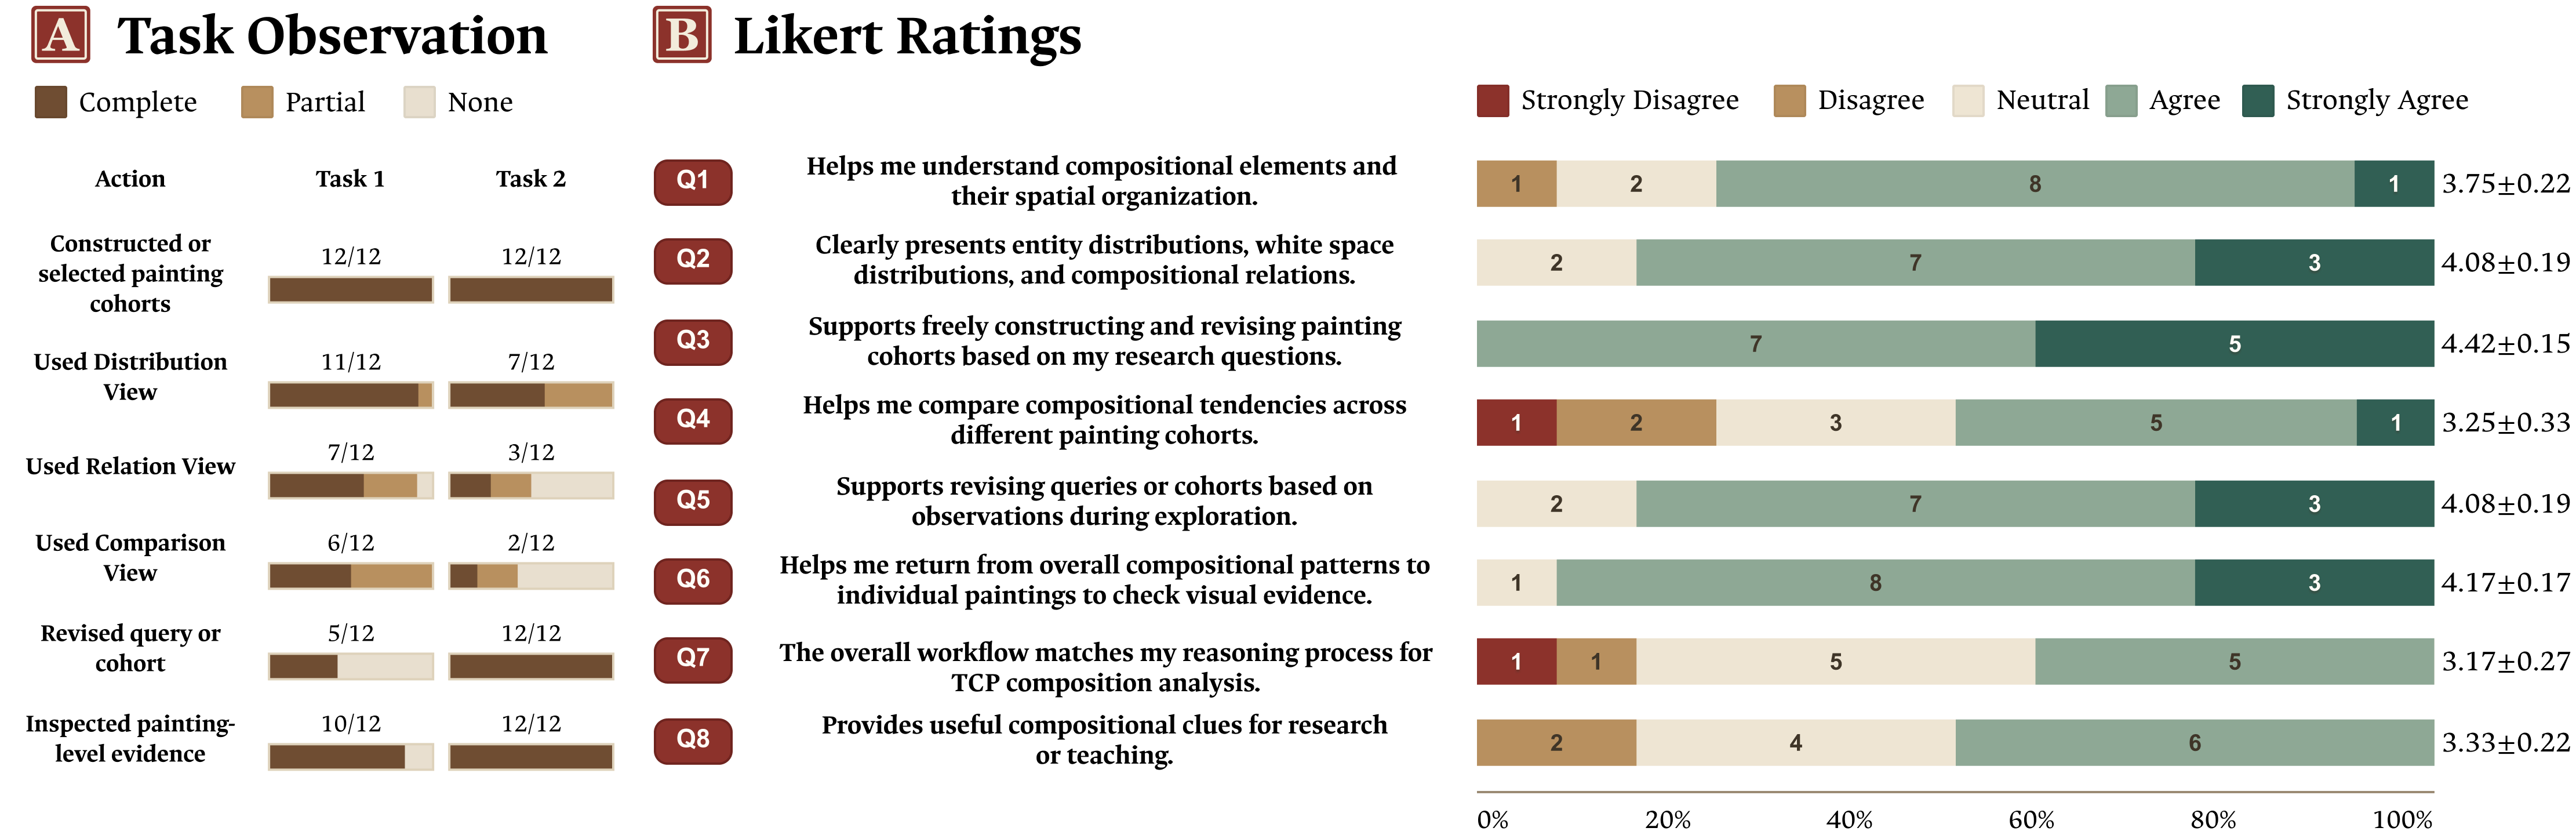
Figure 6: Task-based user study results—observed workflow actions and Likert-scale ratings for structure understanding, cohort analysis, evidence checking, and workflow fit.
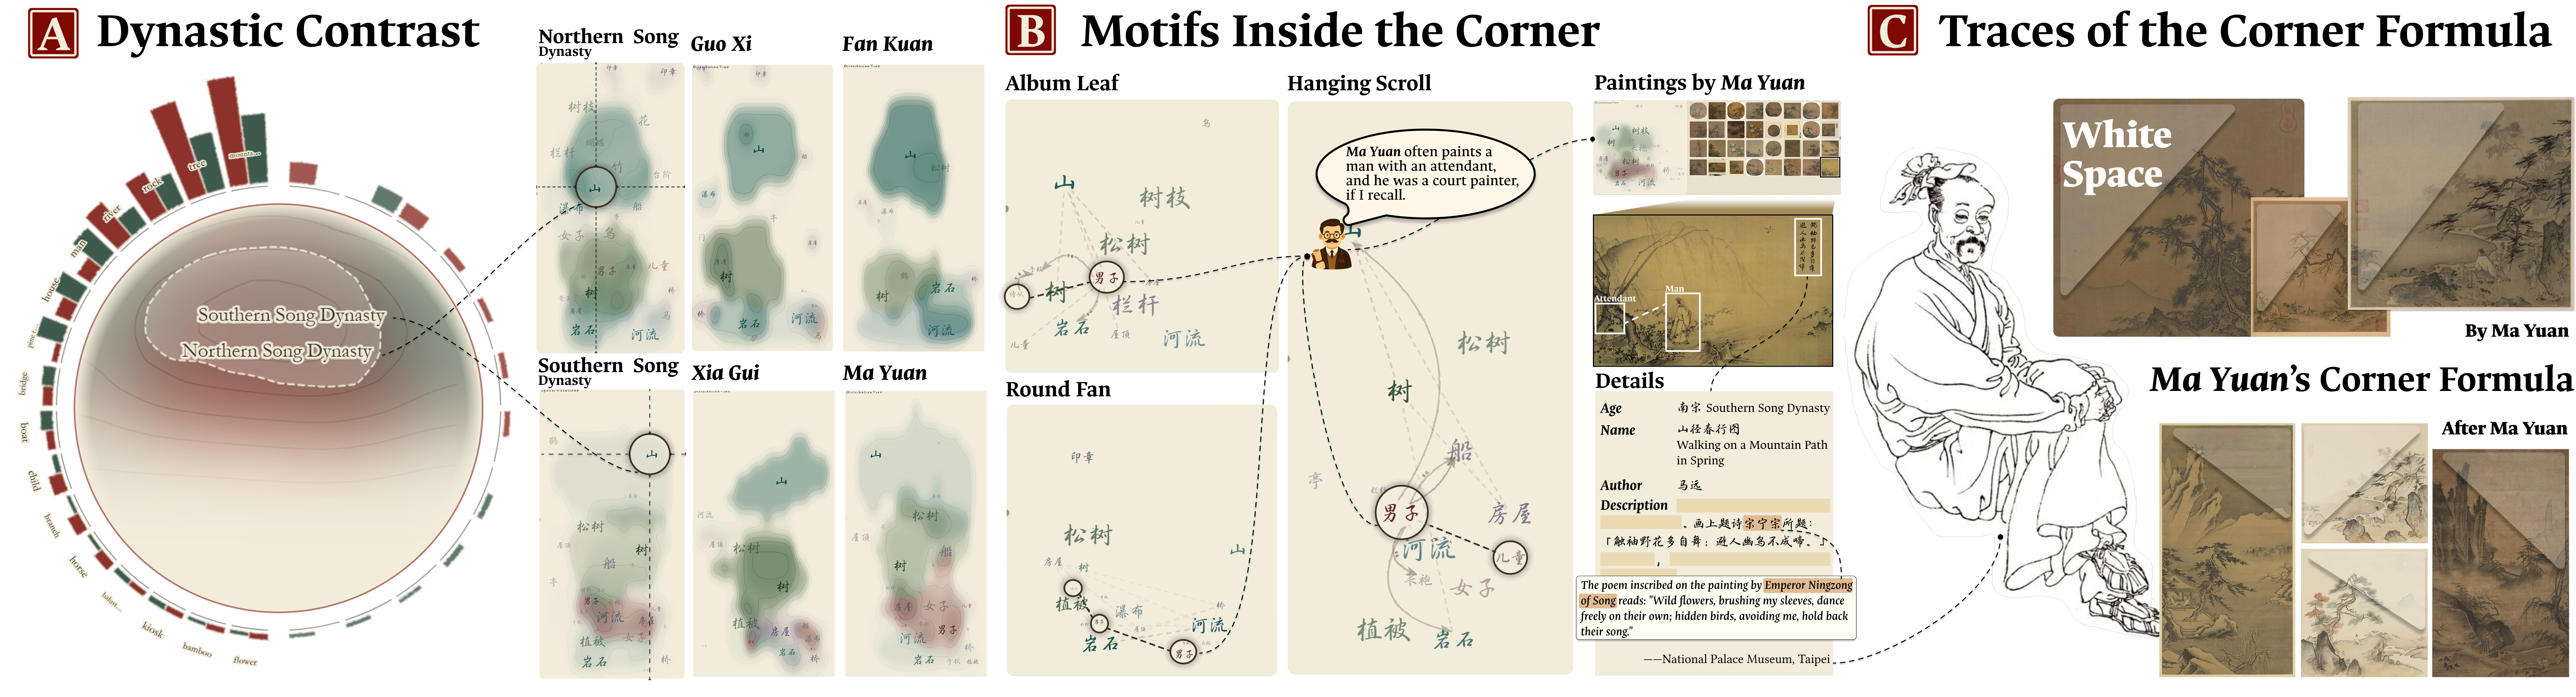
Figure 7: Case 1: Analysis of dynastic landscape compositional shifts, cohort branching, and reuse of Ma Yuan's corner formula.
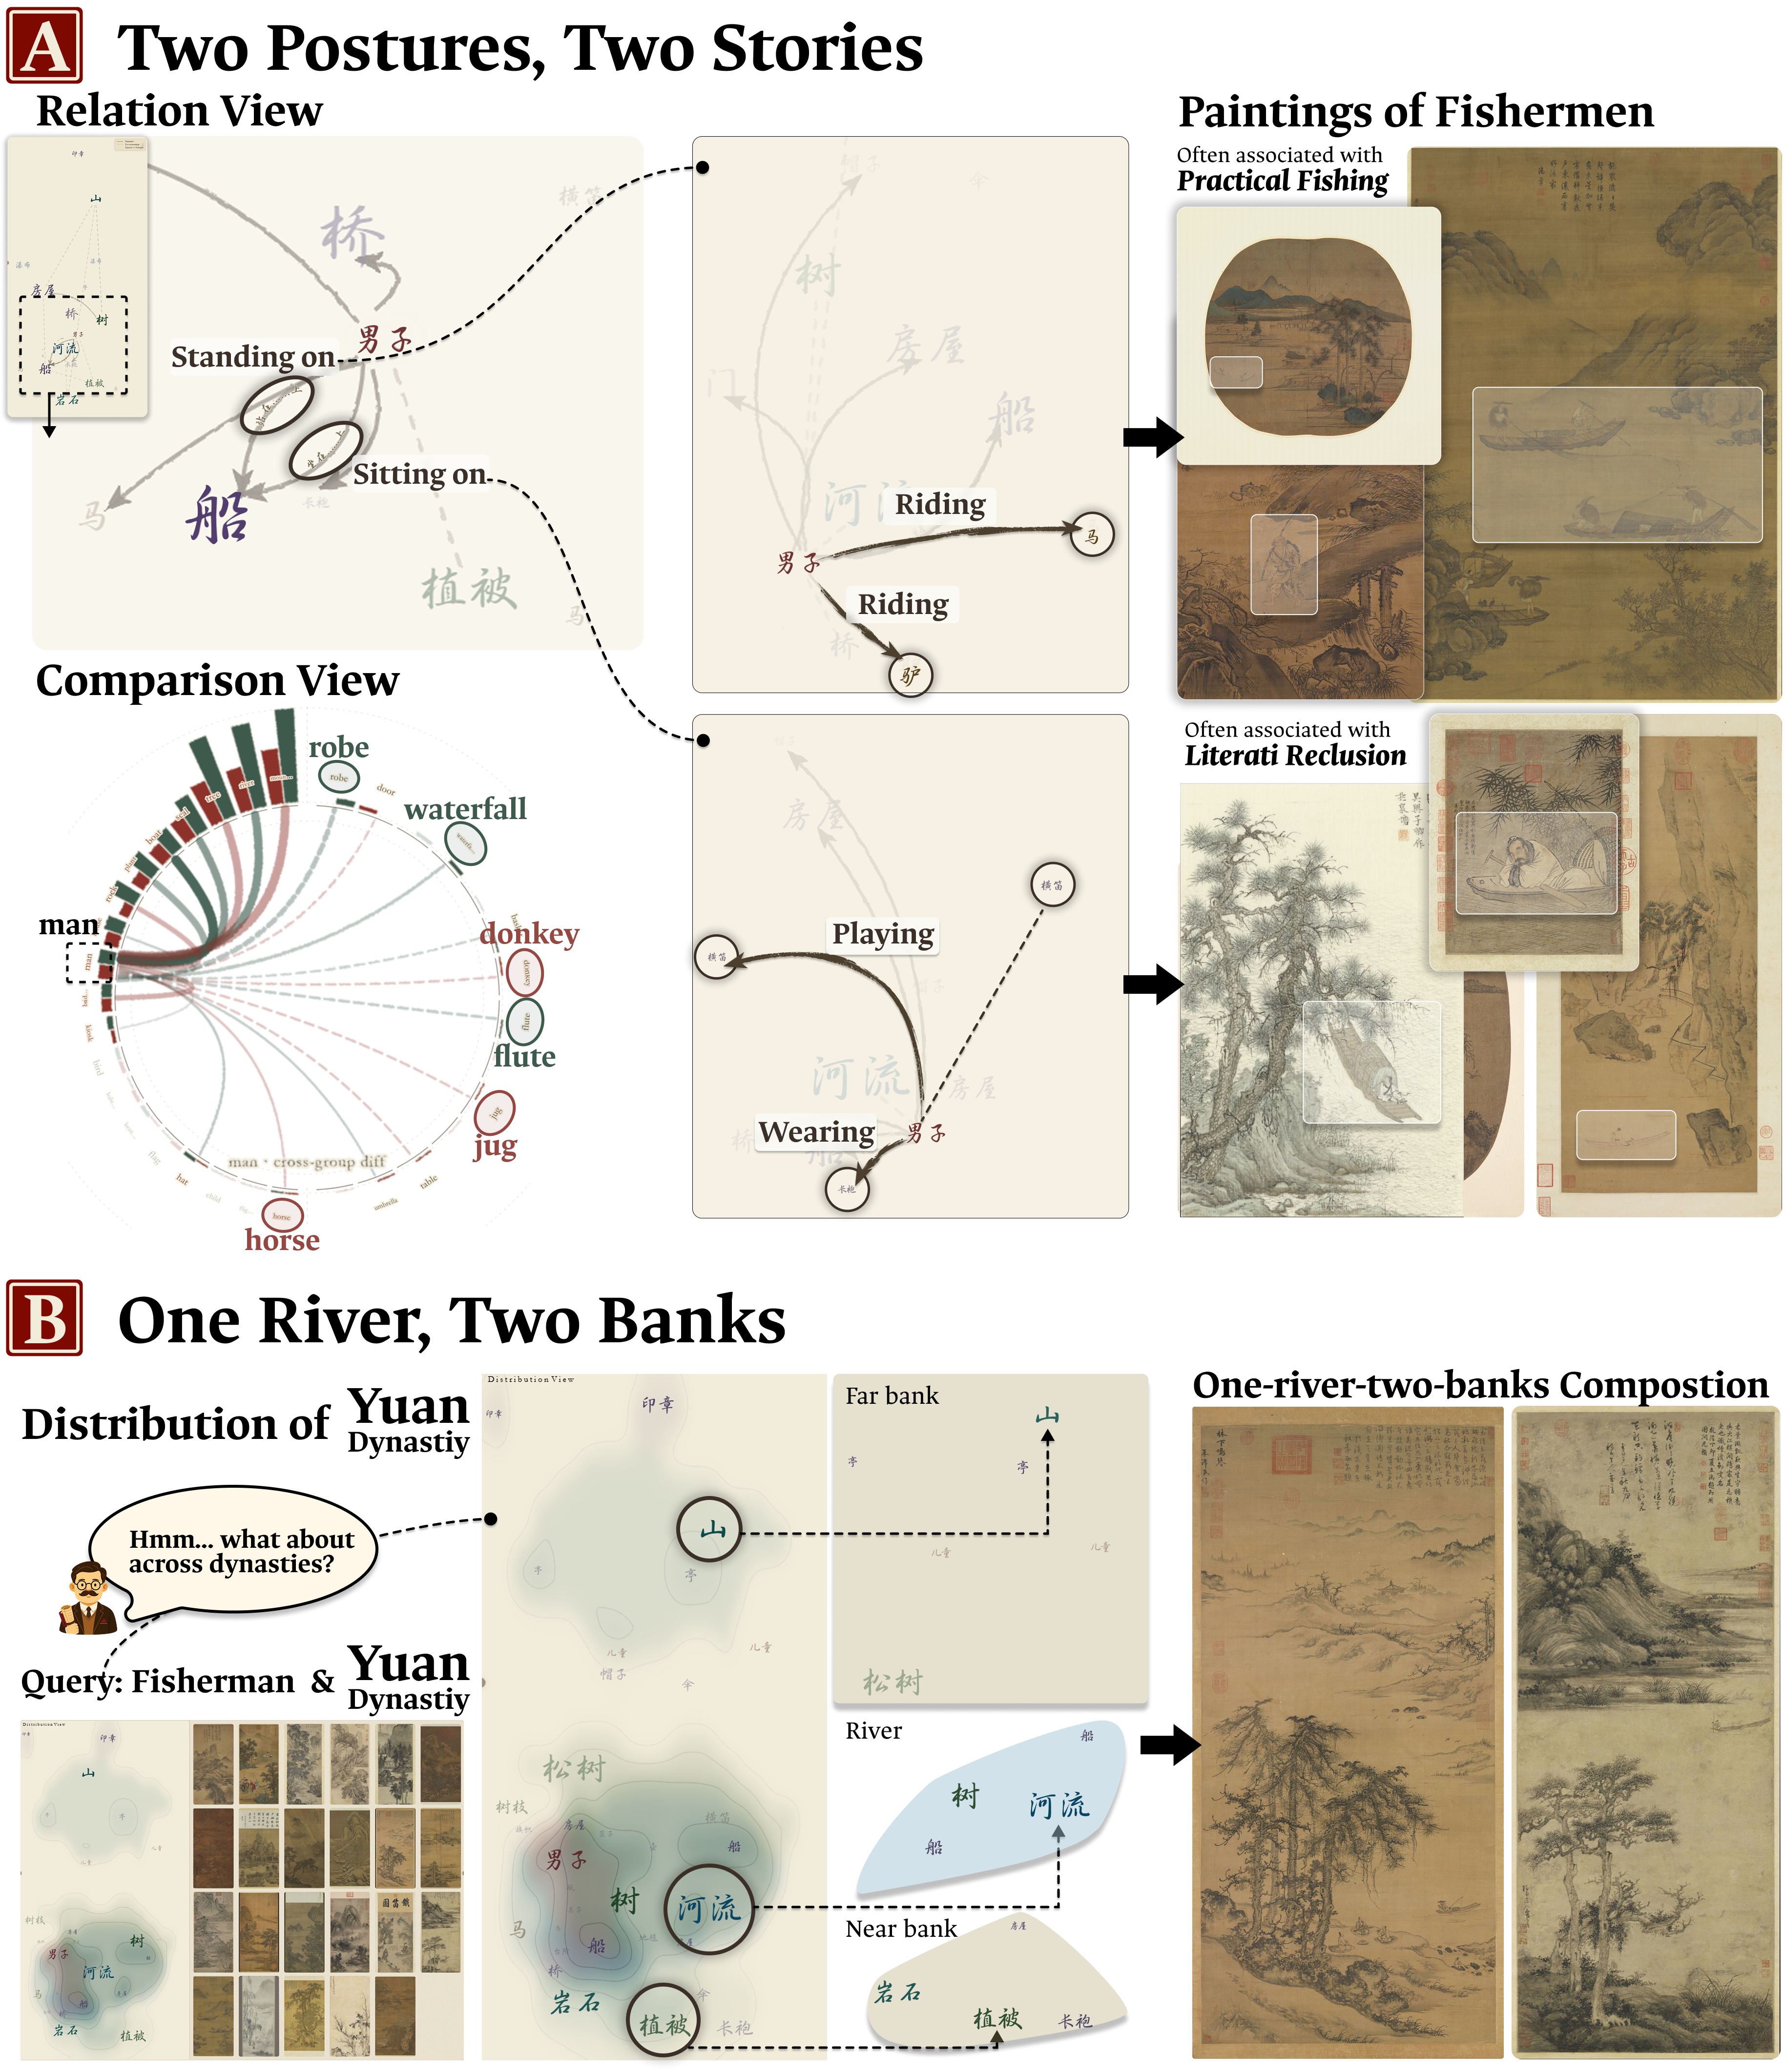
Figure 8: Case 2: Relational comparison of fisherman postures, semantic differences, and river-centric composition across dynasties.
Implications and Future Directions
CompoVista demonstrates that composition-graph-based visual analytics can systematically encode, query, summarize, and compare TCP compositional evidence, enabling scalable aggregation and precise verification. The structured cohort model supports recursive, provisional evidence spaces for hypothesis-driven analysis and cross-cohort comparison, while preserving direct links to painting-level context for interpretive validation.
Design implications include:
- The necessity for explainable retrieval/ranking, emphasizing transparency for human-in-the-loop research.
- Support for fuzzy, abstract compositional queries beyond explicit object locations—incorporating spatial density, balance, and openness.
- Provenance management and uncertainty cues for extended, reproducible scholarly workflows.
- Extension to handscroll formats, generalized spatial normalization, and corpus growth for annotation reliability.
Theoretically, the approach bridges manual, qualitative scholarship with scalable, evidence-driven computational analysis. It is extensible to other visually-organized cultural corpora, aligning structured representation of spatial relations and void space with domain-specific interpretive frameworks.
Conclusion
CompoVista defines a technical and methodological scaffold for compositional analysis in TCPs, leveraging scene-graph modeling and visual analytics to operationalize art-historical concepts at collection scale. The system facilitates iterative, hypothesis-driven workflows grounded in explicit compositional evidence, supported by visual summaries and painting-level verification. By making compositional structure queryable and inspectable, CompoVista enables rigorous pattern discovery and comparative analysis, advancing computational art history and digital humanities methodologies.