- The paper introduces a machine-assisted semi-simulation approach using MSSM to create a mock galaxy catalog that reproduces key one- and two-point statistics for A-SPEC.
- It details a hierarchical zoom-in simulation strategy integrating TNG100-1 and TNG300-1 data to map dark matter subhalo features to baryonic properties.
- Environmental metrics and feature importance analyses enhance predictive performance, though challenges remain in fully capturing gas-phase properties.
Constructing Mock Galaxy Catalogs for A-SPEC Using Machine-Assisted Semi-Simulation
Introduction
This work presents a detailed methodological framework and validation for the construction of a mock galaxy catalog for the All-sky SPECtroscopic Survey of Nearby Galaxies (A-SPEC), utilizing a Machine-assisted Semi-Simulation Model (MSSM) trained on state-of-the-art hydrodynamical simulations. The methodology directly targets the needs of A-SPEC, which aims to produce a near-complete spectroscopic census of galaxies brighter than KS=13.75 across the sky. The resulting mock catalog is designed to reproduce both one-point statistics (luminosity functions) and two-point statistics (clustering) of the survey, with explicit treatment of environmental dependence and careful calibration of mapping between dark matter (DM) subhalo features and galaxy baryonic properties.
Observational Context and Survey Targeting
A-SPEC bridges a critical gap in local universe mapping, where spectroscopic completeness at low redshift remains a limiting factor. The paper leverages the 2MASS extended source catalog as a baseline and critically analyzes its spectroscopic completeness, emphasizing latitude-dependent systematics (Figure 1).
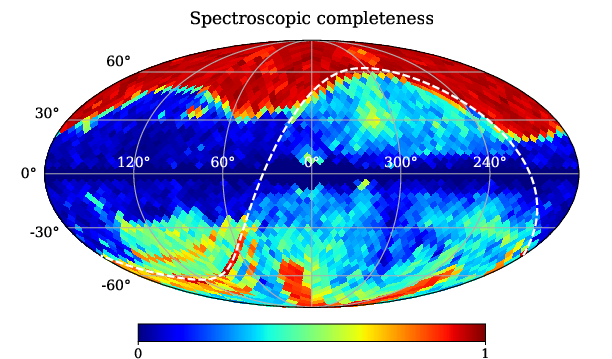
Figure 1: Spectroscopic completeness map for KS⩽13.75 galaxies, revealing notable hemispheric disparities due to historical survey footprints.
To ensure a statistically robust mock catalog, the observed KS-magnitude–redshift distribution and the corresponding absolute magnitude limits are mapped in detail (Figure 2), and the empirical redshift distribution is compared with predictions from established luminosity functions (Figure 3).
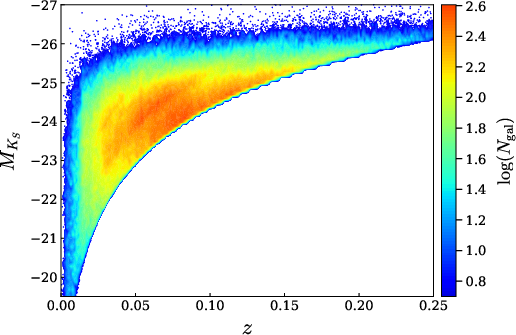
Figure 2: The locus in MKS vs. redshift for the spectroscopic sample, with survey selection boundaries visible as sharp features.
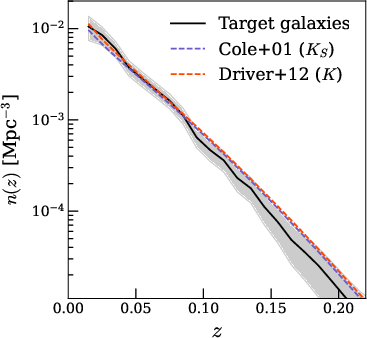
Figure 3: The observed redshift distribution, showing both Poisson uncertainties and comparison with Schechter function-based analytic predictions.
Model Training: Linking Dark Matter to Baryons
The cornerstone of the approach is the MSSM, an extremely randomized tree regressor trained on the TNG100-1 hydrodynamical simulation, with supplementary high-mass subhalos from TNG300-1 after property scaling. The model regresses an extensive set of DM subhalo features (mass, vcirc, σv, spin, anisotropy, detailed environment metrics, and a pseudo-mass accretion rate) to key baryonic outputs: multiband stellar luminosities, stellar/gas mass, integrated SFR, and gas-phase metallicity.
Multiple environmental characterization schemes are implemented, including kNN-based local densities, fixed-scale density/anisotropy metrics, and proximity to massive subhalos. The feature design is responsive to the limitations imposed by the simulation targeted for application, and the lack of complete merger tree information is compensated by inclusion of properties sensitive to recent dynamical events (e.g., subhalo-centroid offsets, spin proxies).
The predictive performance of the MSSM is systematically quantified on test data, achieving R2 of 0.96 (stellar mass), 0.90 (gas mass), 0.70 (SFR), and 0.79 (gas metallicity). One-to-one comparisons and distribution function analyses demonstrate robust recovery of stellar properties and a tendency for the model to under-predict the dynamic range of star formation and enrichment tracers (Figures 6 & 7).
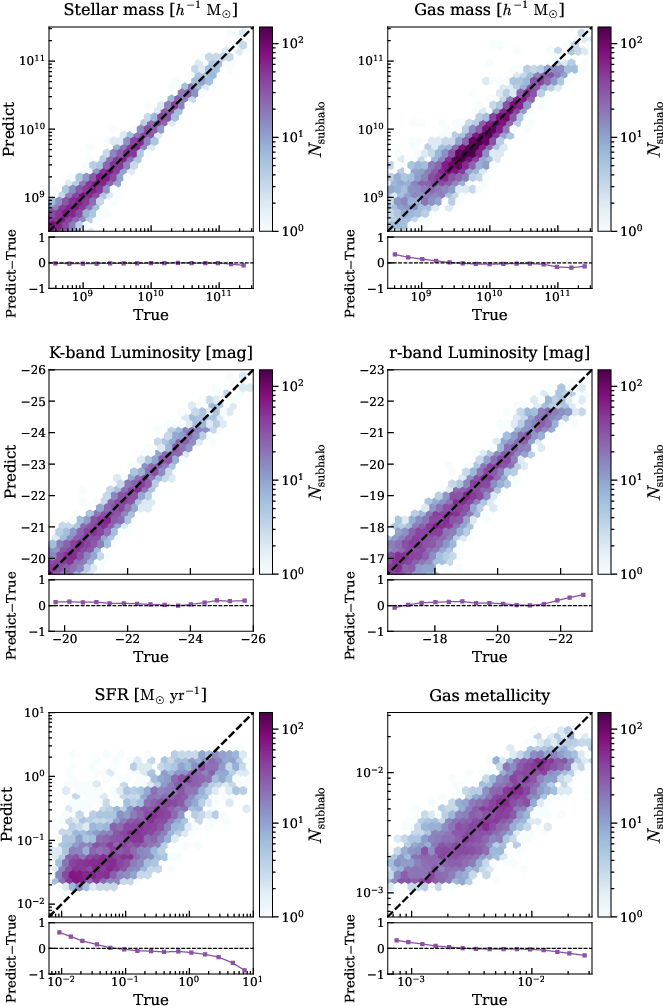
Figure 4: Scatter plots of true vs. MSSM-predicted baryonic properties, illustrating overall high fidelity and limitations in SFR/extreme metallicity regimes.
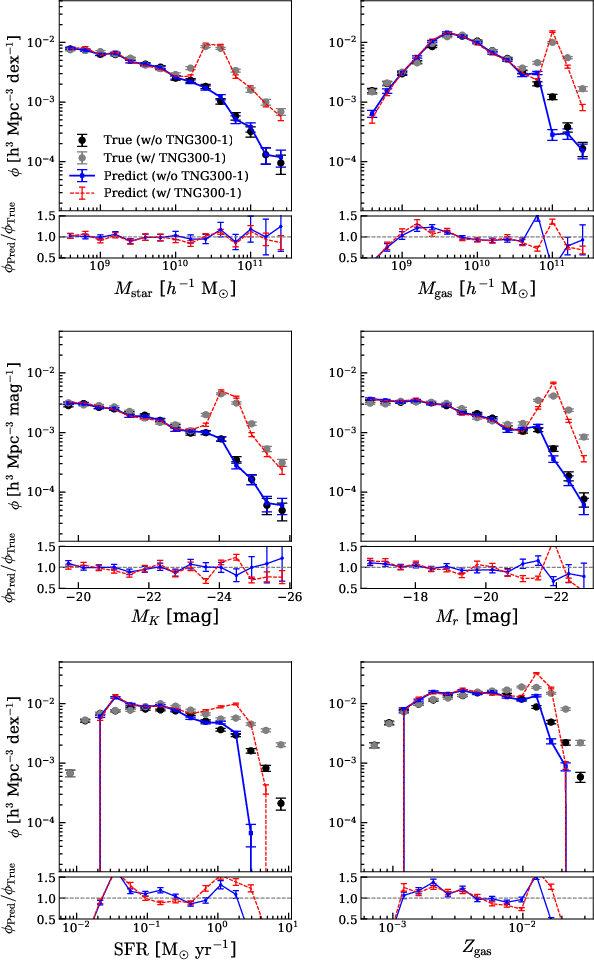
Figure 5: Comparison of predicted and actual baryonic property distribution functions; incompleteness at extreme ends persists even with extended training sets.
Feature importance analysis using SHAP values confirms that most of the model's predictive power for stellar properties is attributable to mass, vcirc, and velocity dispersion, while environmental features and anisotropy become substantially more relevant for gas-phase properties (Figure 6, Figure 7). This segmentation quantifies where additional model or feature engineering would most benefit physical predictiveness.
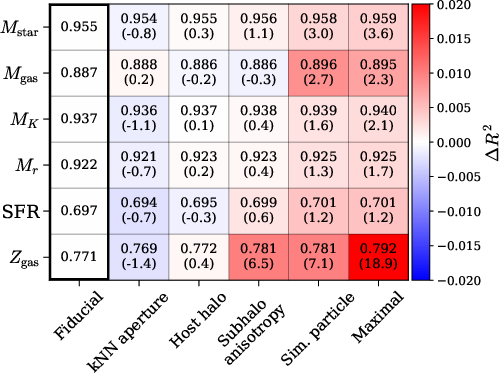
Figure 6: R2 performance enhancement attributable to various feature groups, highlighting the gains for environmental metrics in predicting gas metallicity.
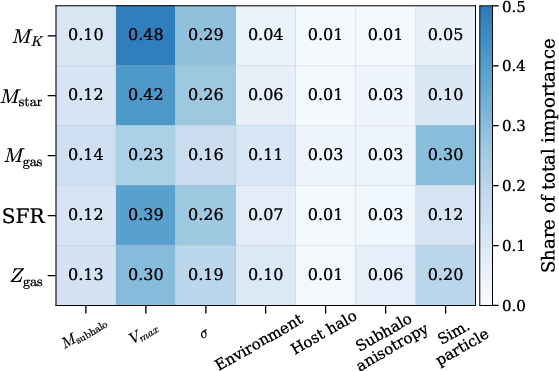
Figure 7: Relative SHAP importance for input feature groups, emphasizing the dominance of traditional subhalo properties for stars and the growing role of environmental metrics for gas.
Simulation Strategy and Application Pipeline
To overcome the computational infeasibility of a uniform, high-resolution full-volume N-body simulation, a nested zoom-in strategy is implemented. Four concentric regions are generated with MUSiC to achieve progressively higher mass resolution toward lower redshift (Figure 8).
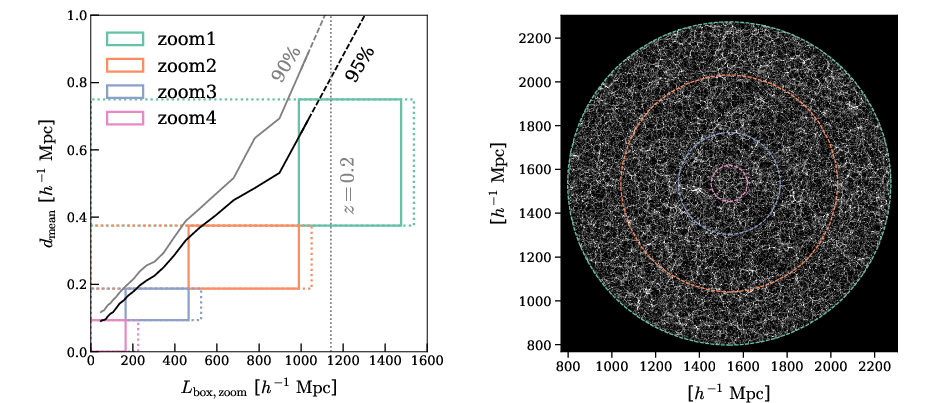
Figure 8: Schematic of the zoom-in simulation hierarchy, matching box sizes, redshift shells, and the intended survey’s flux-limited selection.
The halo and subhalo catalogs from these simulations (NASIM) are validated against the TNG100-1 mass function and subhalo clustering statistics, with agreement typically within 10–30% (Figure 9, Figure 10).
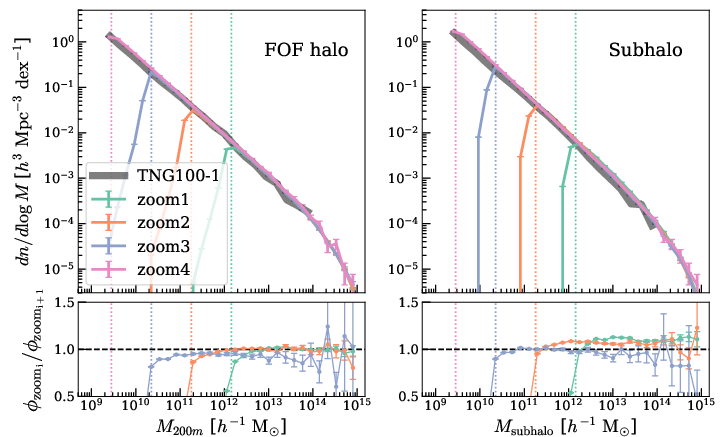
Figure 9: Subhalo and halo mass functions for NASIM compared to TNG100-1, showing consistency down to the formal resolution limit.
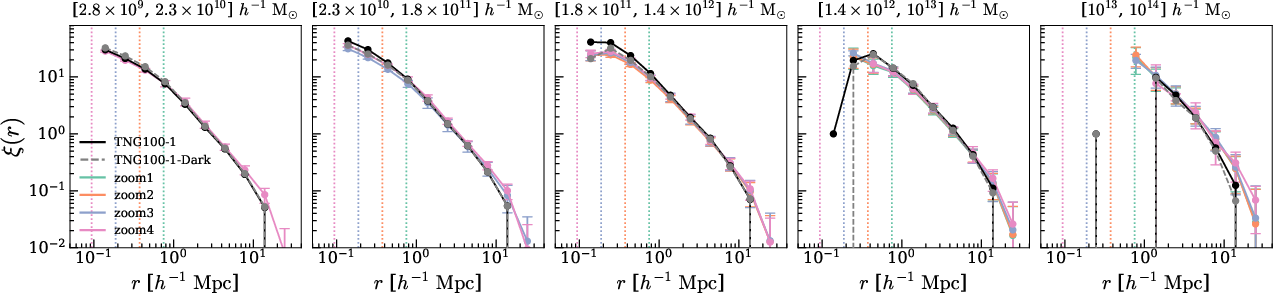
Figure 10: Mass-dependent two-point clustering for subhalos, matching theoretical and empirical calibrations.
Mock Catalog Construction and Observational Validation
The MSSM, with mass-dependent recalibration for structural inputs (KS⩽13.750, KS⩽13.751), is applied to NASIM subhalos. This pipeline closely reproduces the observed KS⩽13.752-band luminosity function after a modest zeropoint shift and bandpass offset (Figure 11), and matches the redshift and surface density distributions of the real sample (Figure 12).
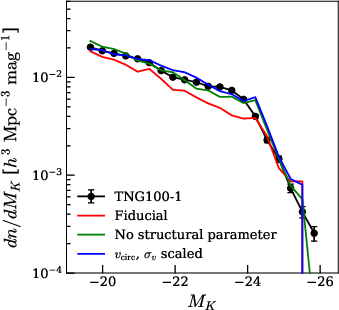
Figure 11: Comparison of predicted KS⩽13.753-band luminosity functions for different MSSM variants, showing best agreement with mass-dependent recalibration of structure metrics.
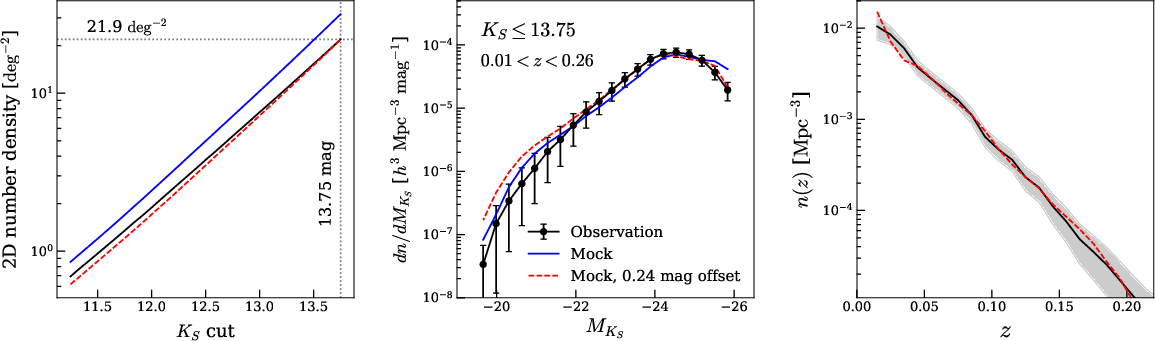
Figure 12: Aggregate comparisons between the observed and mock galaxy catalog—surface density, luminosity function, and redshift distribution—showing strong overall consistency.
Luminosity-dependent clustering is accurately reproduced except at the faintest and lowest-redshift extremes, where cosmic variance and local structure (e.g., proximity to a void) dominate (Figure 13).
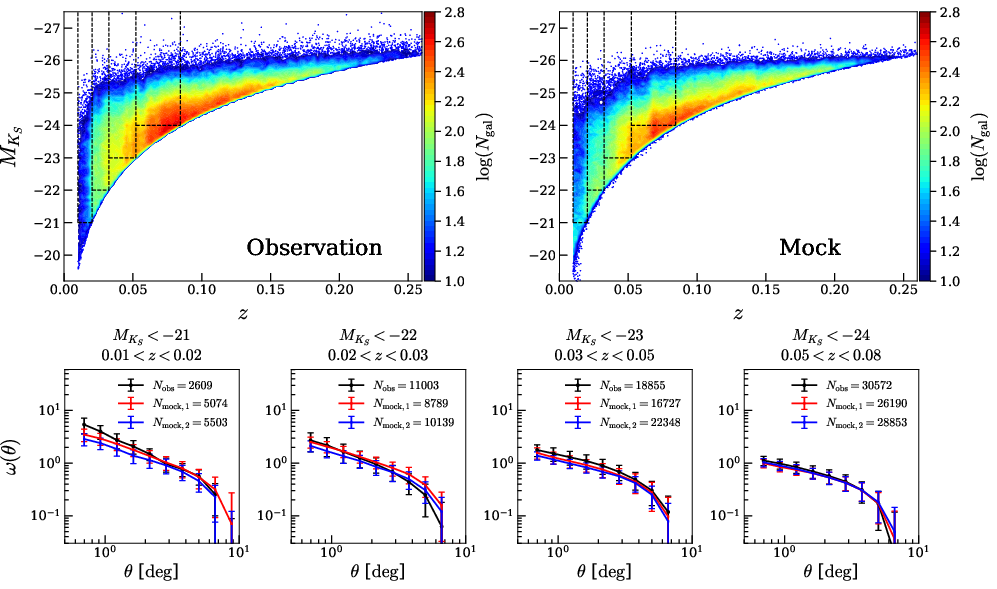
Figure 13: Clustering analysis for four volume-limited bins, confirming that the mock reproduces the observed angular two-point correlation function across the main magnitude ranges of interest.
Environmental Effects and Model Limitations
A diagnostic analysis of feature importance (Figure 14), environmental scaling relations, and recovery of gas fraction–density trends (Figure 15) demonstrates that the inclusion of appropriately scaled environmental metrics is not only essential for physically plausible predictions but directly improves the machine learning model's capacity to encode environment-driven baryonic diversity. The approach identified density measures tailored to subhalo size and high-kNN local potentials as consistently the most predictive.
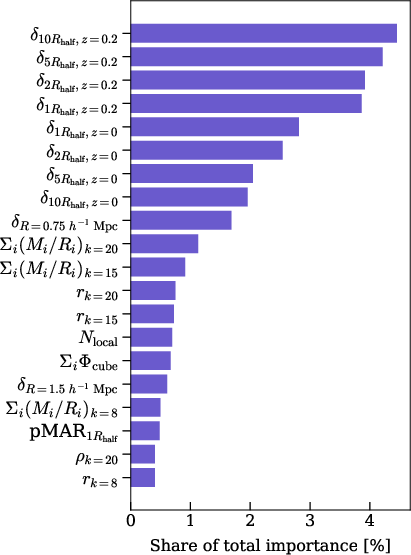
Figure 14: Decomposition of gas mass prediction importance by environmental metrics, with strong preference for physically motivated, aperture-scaled overdensities.
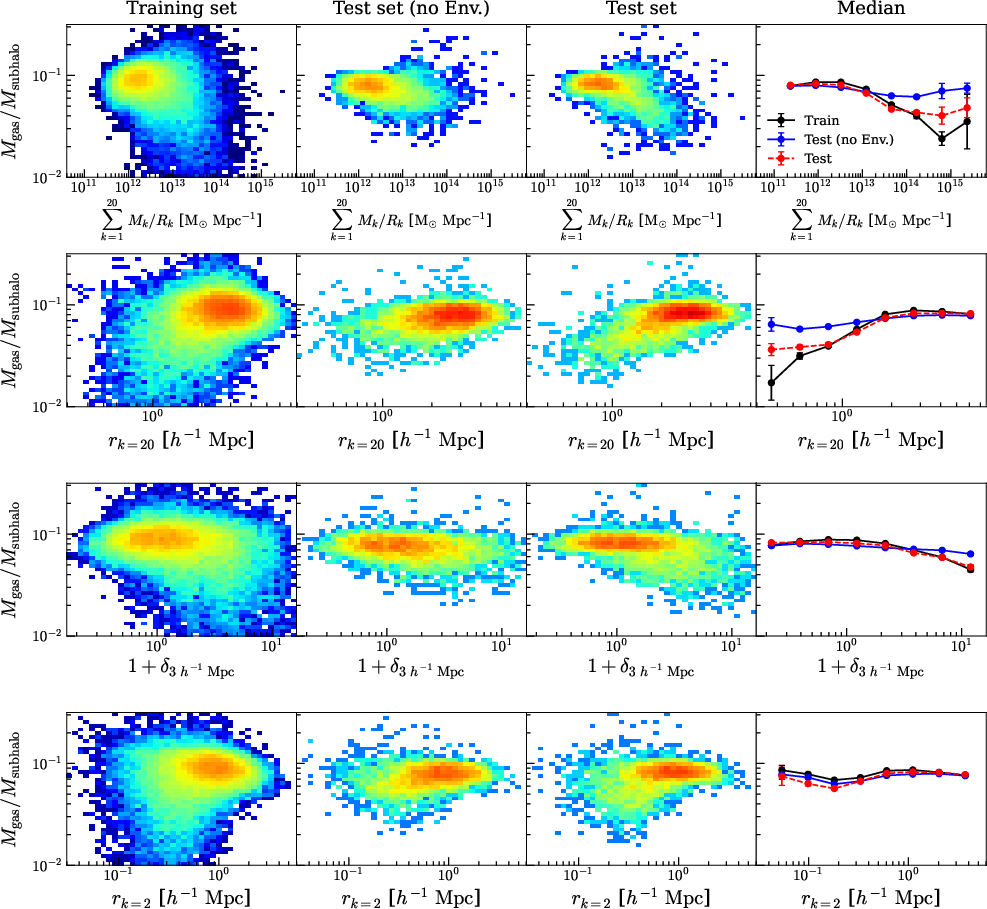
Figure 15: Gas mass fraction as a function of environmental metrics, showing close recovery of physical relations only when such features are provided to the model.
Nevertheless, gas-related properties, especially SFR and metallicity, remain challenging to predict for the high and low extremes of the intrinsic distributions—a direct consequence of DM-only feature incompleteness and of hydrodynamical simulation limitations in the regime of low SFRs and low mass. Assignment of unresolved baryonic properties using observationally motivated stochastic painting can partially ameliorate these deficiencies but does not substitute for full-physics modeling at higher resolution.
Conclusions
The mock galaxy catalog constructed here sets a new standard for DM-based halo painting in next-generation, wide-area spectroscopic surveys. The technical accomplishments—a hierarchical, resource-efficient simulation design, high-fidelity DM-to-baryon regression, and environment-sensitive validation—culminate in a catalog that accurately matches both the one- and two-point statistics of the A-SPEC selection function. This work directly enables statistical control of systematics in galaxy group/cluster identification, cosmological parameter estimation, and environmental dependence studies for A-SPEC and similar surveys.
Key limitations are identified: gas-phase properties (SFR, metallicity) are only recovered in an average sense, and further progress will necessitate novel feature engineering, incorporation of assembly history/merger data, and possible advances in neural architectures to capture the required diversity. The current approach, however, represents a robust reference baseline for empirical survey calibration.
The catalog is publicly released, and its methodological innovations provide a foundation for future large cosmological mocks, both for A-SPEC and for other low-redshift, wide-area spectroscopic mapping programs.
For figures referenced above, see the identifiers and captions provided. The labeled figures illustrate critical aspects of the analysis, from survey completeness to feature importance and clustering validation.