- The paper demonstrates how summarizing next-generation matrices to a scalar R0 omits critical eigenvector and non-normality details.
- It introduces a matrix factorization (K = QCD) that reveals the misalignment between groups driving transmission and those bearing its burden.
- Empirical analyses using COVID-19 data from 177 countries illustrate that relying solely on R0 can lead to inequitable and suboptimal intervention policies.
Eigenvectors, Non-Normality, and the Limits of R0: An Analytical Perspective
Overview and Motivation
The scalar basic reproduction number R0 remains central to mathematical epidemiology, widely interpreted as a threshold parameter for population invasibility by infectious diseases. Conventionally, in group-structured or heterogeneous models, R0 is defined as the spectral radius ρ(K) of a next-generation matrix K, which encodes expected transmissions across groups. However, this approach compresses the operator K to a single eigenvalue, potentially eliding important structural features. This paper interrogates the "deletions" implicit in K↦ρ(K): specifically, it examines the epidemiological meaning and policy ramifications of the dominant eigenvectors and the non-normality of K, both of which are erased in scalar R0 summaries.
Mathematical Structure: Decomposition and Non-Normality
The paper presents a matrix factorization of the next-generation operator,
K=QCD,
where R00 is the contact (mixing) matrix, R01 encodes group-specific biological susceptibility, and R02 captures group-specific infectious durations. Consistent with canonical epidemiological frameworks, the dominant right eigenvector R03 of R04 represents the asymptotic incidence distribution, while the left eigenvector R05 captures per capita reproductive contribution. A critical finding is that almost all real-world R06 operators are non-normal, even when inputs like R07 are symmetric, due to heterogeneity in R08 and R09. This non-normality is the mathematical signature of heterogeneity itself and provokes divergence between source (transmission-driving) and burden (receiving) groups.
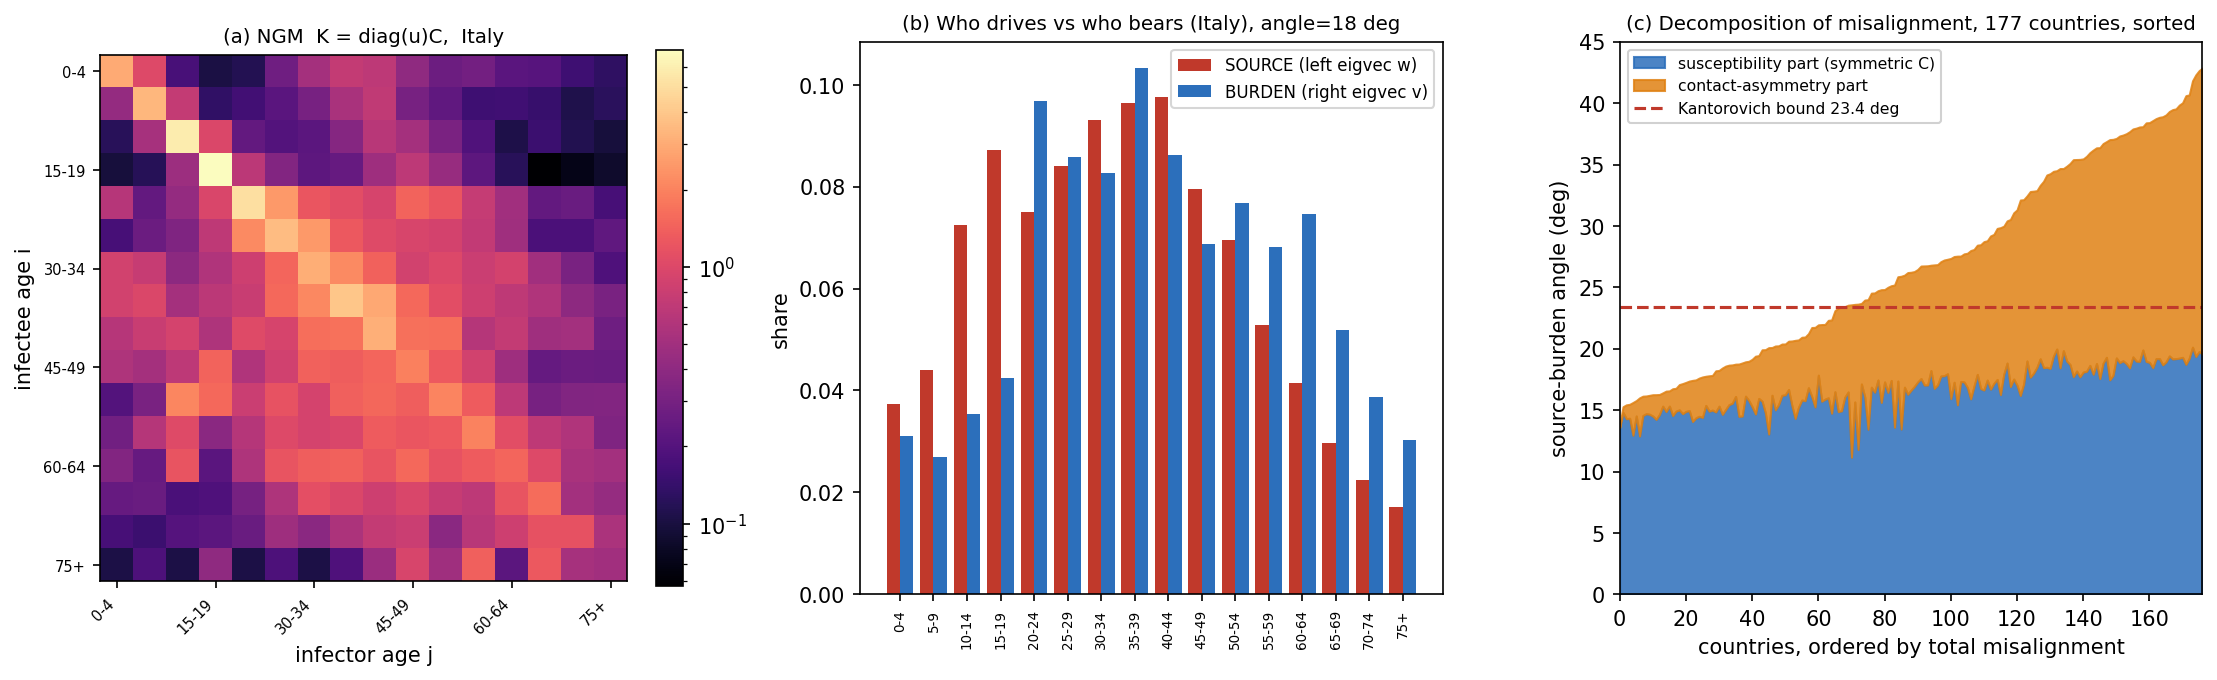
Figure 1: Non-normality and eigenvector misalignment in real transmission operators—visualizing R00 for Italy, distributions of R01 and R02 by age, and decomposition of misalignments across 177 countries.
Eigenvector Misalignment: Quantifying Social Content
The divergence between R03 (burden) and R04 (source) eigenvectors is formalized by a condition number
R05
and its geometric interpretation, the source–burden angle R06. When R07 is normal and homogeneous, R08 and R09; in heterogeneous, non-normal contexts, ρ(K)0. Empirically, the paper demonstrates—using 177 national contact matrices and COVID-19 age-susceptibility profiles—that eigenvector misalignment is substantial: the median angle in real data is ρ(K)1 (with maxima exceeding ρ(K)2). Crucially, the groups that drive transmission are systematically distinct from those bearing its burden, a phenomenon invisible to ρ(K)3 alone.
As shown in Figure 1b, the misalignment produces scenarios where, for example, older age groups incur disproportionately high infection burden relative to their reproductive contribution, evidencing a fundamental equity issue in scalar summaries.
Theoretical Bounds: The Kantorovich Inequality
A principal theoretical result is the derivation of a Kantorovich-type upper bound on the source–burden angle in terms of susceptibility contrast ρ(K)4. For symmetrized (reciprocal) contact matrices,
ρ(K)5
with equality when heterogeneity is maximized as a two-point contrast. Empirical misalignments from real data all respect this bound under symmetrized contacts; the additional observed misalignment is attributed to asymmetry in ρ(K)6. This decomposition allows for an attribution of misalignment to susceptibility heterogeneity versus contact asymmetry.
Non-Normality and Transient Dynamics
Non-normality also predicates the possibility of transient amplification—the scenario where subcritical ρ(K)7 yields short-lived outbreaks that briefly exceed expected growth rates. While theoretically possible (as demonstrated by artificial matrix constructions in the text), empirical results show that typical human contact structures exhibit limited reactivity (reactivity ratios ρ(K)8 across all countries), indicating that transient amplification is not the dominant empirical consequence of non-normality. Rather, it is the eigenvector misalignment that expresses the operative non-normal effect in actual populations.
Policy Implications: Intervention Targeting and Tradeoffs
A striking practical implication is that optimal intervention targeting diverges depending on the criterion—transmission minimization (ρ(K)9-optimal) versus mortality minimization. Analytically, the sensitivity of K0 to interventions decreasing susceptibility in group K1 is proportional to K2, reflecting both the reproductive value and incidence in that group. By contrast, mortality minimization is governed by K3 weighted by infection fatality rate, often maximized in entirely different demographic groups. Across all tested countries, the age group to shield is always younger when minimizing K4 (typically K5–K6) and older when minimizing mortality risk (consistently K7). The K8-optimal intervention frequently results in a 1.5–2.0× increase in average per-infection fatality, sharply illustrating the real social cost of interventions based solely on the spectral radius.
Reporting Recommendations and Theoretical Implications
The core theoretical recommendation is that reporting K9 in isolation conceals significant structural and social content. The paper recommends the routine joint reporting of:
- K0 (invasion threshold),
- K1 and K2, or K3 (burden/source distributions and their misalignment),
- K4 (maximum transient amplification risk).
Since these quantities are straightforward to extract in the computation of K5, such reporting incurs essentially zero additional computational cost. Practically, this would support more informed policy decisions in heterogeneously structured populations, where homogeneity-based K6 loses vital information.
Conclusions and Future Directions
K7 is a meaningful but coarse summary statistic that preserves only threshold information while deleting the core details about the social allocation of harm and the heterogeneity of transmission structure. The observed empirical misalignments and documented policy pitfalls demonstrate that detailed spectral analysis is essential for structured populations or pathogens with age- or group-specific differential susceptibility. The analytical framework of this paper, coupled with large-scale empirical validation, opens further lines of research: extending to non-age group structure, integrating more dimensions of heterogeneity (occupation, geography, socioeconomics), and generalizing the Kantorovich control for broader operator classes. The unambiguous implication is that future models and public health reports should pair K8 with its eigenstructure for both theoretical clarity and practical equity.

