- The paper presents an extensive multi-decade optical monitoring campaign that quantifies PKS 2155-304’s flux variability using rigorous differential photometry.
- It employs robust statistical methods, including FΓ tests and PDM analyses, to identify microvariability and assess the spectral index evolution.
- The study highlights significant optical flare events and a long-term secular hardening of the spectral index, suggesting turbulent jet dynamics.
Long-Term Optical Variability and Photometric Analysis of PKS 2155-304
Introduction
This paper presents an extensive optical variability analysis of the BL Lac object PKS 2155-304, leveraging a multi-decade photometric dataset in the B, V, R, and I bands. PKS 2155-304 remains a prototypical target for blazar variability studies due to its pronounced multiwavelength activity and status as one of the brightest southern blazars. The authors consolidate archival data from the CONGA group and new observations obtained at Argentinian facilities, constructing a dataset of over 6500 images spanning 1997–2024. Through application of robust variability metrics and correlation analyses, the study systematically investigates flux and spectral variability across temporal baselines from years to hours, explores optical–X-ray correlations, and rigorously tests for optical quasi-periodic oscillations (QPOs).
Observations, Reduction Procedures, and Photometric Calibration
The observational campaign exploits several telescopes (primarily the 2.1m Jorge Sahade and the 1.5m Bosque Alegre facilities) to achieve deep temporal coverage. Differential photometry is performed using stable comparison and control stars, primarily Hamuy objects 4 and 5 Figure 1.
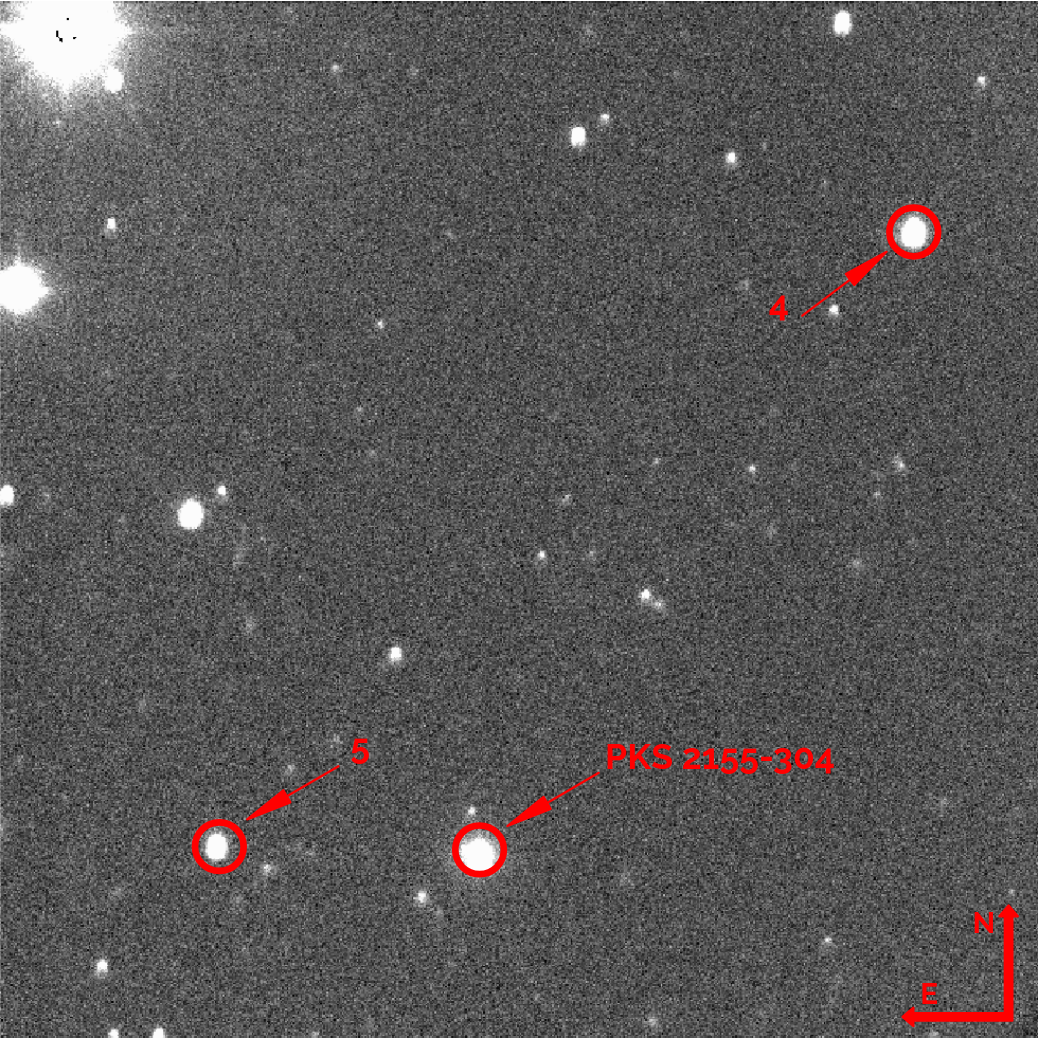
Figure 1: Field of PKS 2155-304 with comparison objects 4 and 5 (Hamuy), providing the photometric baseline.
The rigorous reduction with custom IRAF scripts ensures consistency across decades of instrument changes. The dataset is calibrated to the Johnson-Cousins system, facilitating comparison with other monitoring campaigns and surveys.
Characterization of Optical Variability
The flux evolution throughout the total campaign Figure 2 is strongly non-monotonic, with the largest optical amplitude in the V band observed on July 27, 1997 (V = 12.95 mag). The 2015–2024 interval, with the densest coverage Figure 3, witnesses both pronounced maxima (e.g., August 19, 2016) and generational minima (July 2023), the latter preceding a predicted flare.
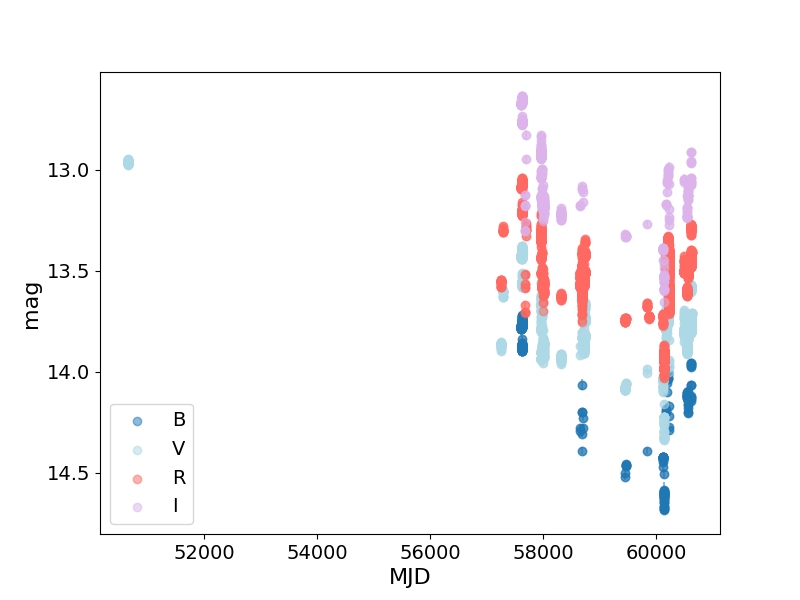
Figure 2: Standard magnitude light curves of PKS 2155-304 in B, V, R, and I over the full campaign.
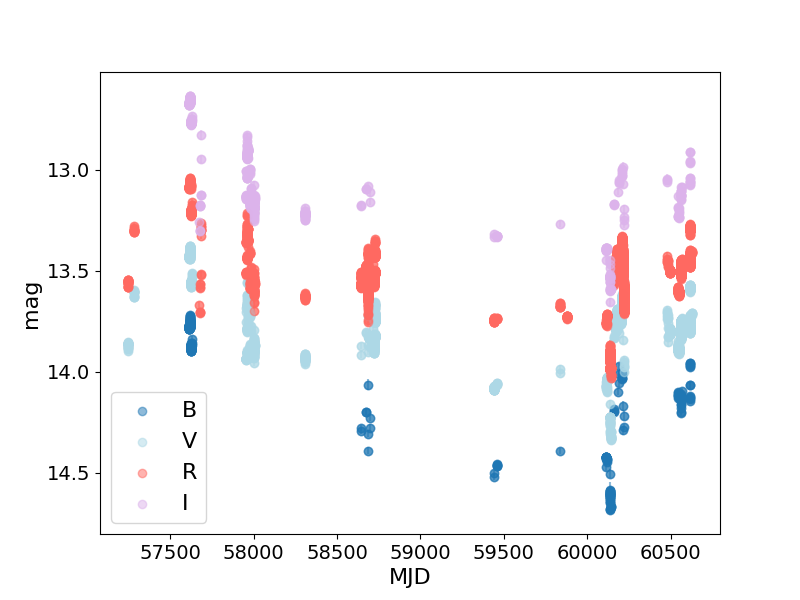
Figure 3: Light curves (B, V, R, I) for 2015–2024 capturing enhanced temporal sampling.
Shorter time segments demonstrate substantial flux variability across annual, monthly, and interday scales. Both CΓ and V0 statistical tests confirm the high-optical activity with a vanishingly low probability of arising from observational or instrumental noise. Notably, microvariability—significant changes on V15 hr scales—was registered in several densely sampled nights, primarily in V2 and V3 bands during 2023–2024.
On intra- and inter-night timescales, the blazar exhibits non-trivial structure, e.g. in September 2023 Figure 4 fluxes show smooth, periodic-like modulations over several days, although formal periodicity is not robustly established.
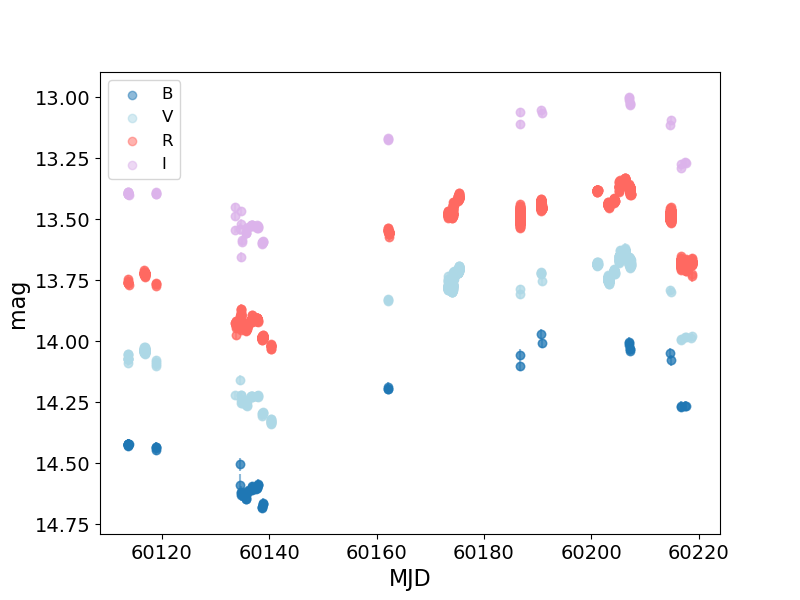
Figure 5: 2023 light curves; amplitude and temporal density highlight substantial short-term variability.
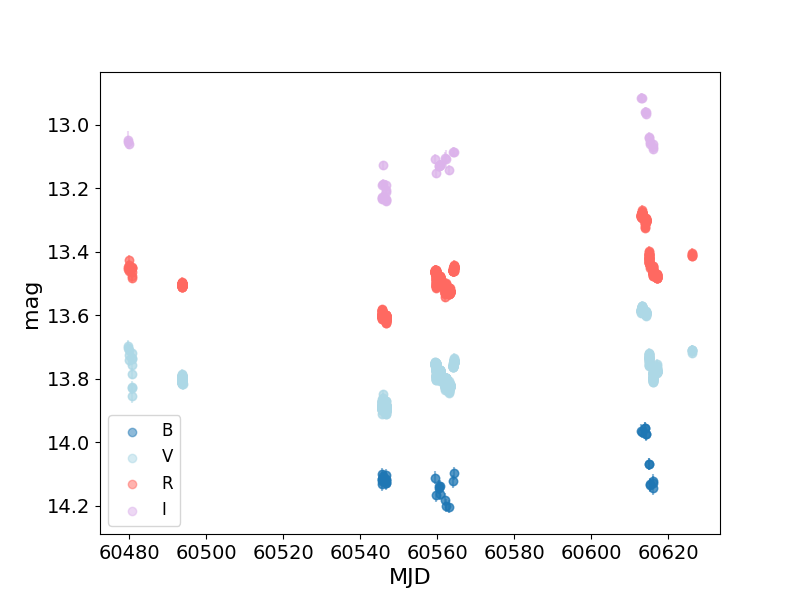
Figure 6: 2024 light curves; variabilities are less pronounced, indicating year-to-year oscillations in optical activity.
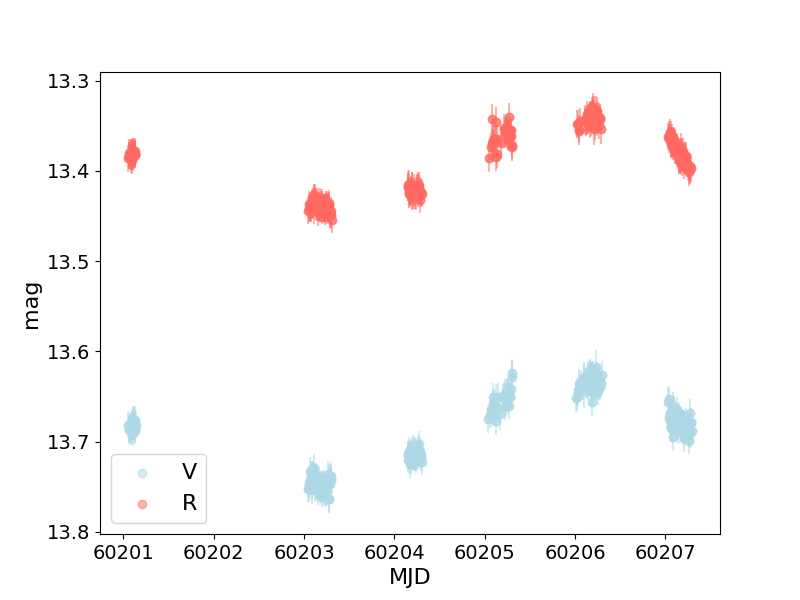
Figure 4: Sub-week structure in V/R bands (Sep 13–19, 2023) reveals characteristic modulations.
Flare Detection and Microvariability
A particularly notable finding is the observed flare throughout July–August 2023, in concordance with predictions based on contemporaneous Swift-XRT X-ray activity. During this interval, both V4 and V5 bands exhibit magnitude rises V6 mag corresponding to V770% flux enhancements Figure 7, with strong positive results in both V8 and V9 tests.
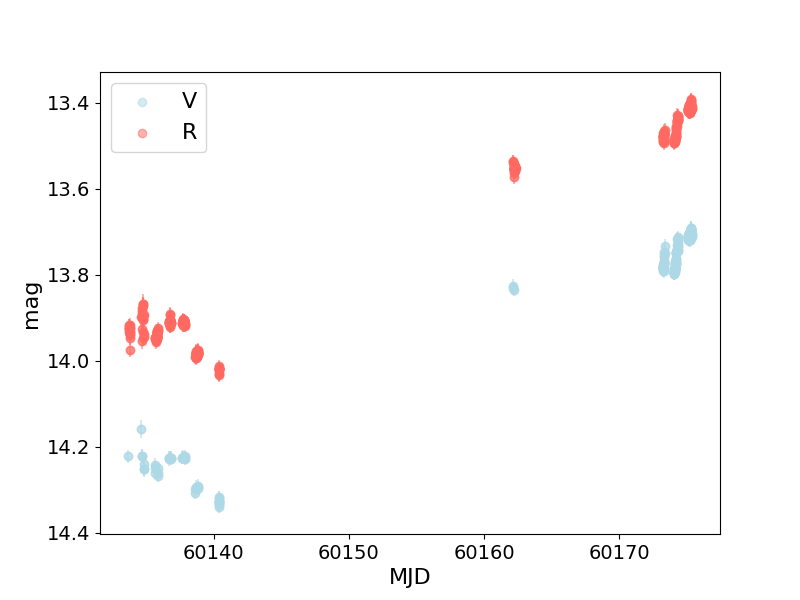
Figure 7: R0 and R1 light curves show a pronounced and sustained flux escalation—evidence of the 2023 flare.
Instances of optical microvariability (<4 hours) are documented during the highest-activity periods, with significant detections on nights such as August 17, 2023 Figure 8 and September 6, 2024 Figure 9. These short-term variabilities underscore the presence of rapid, intrinsic emitting region fluctuations, indicative of compact emission zones and reinforcing models of turbulent, stochastic jet processes.
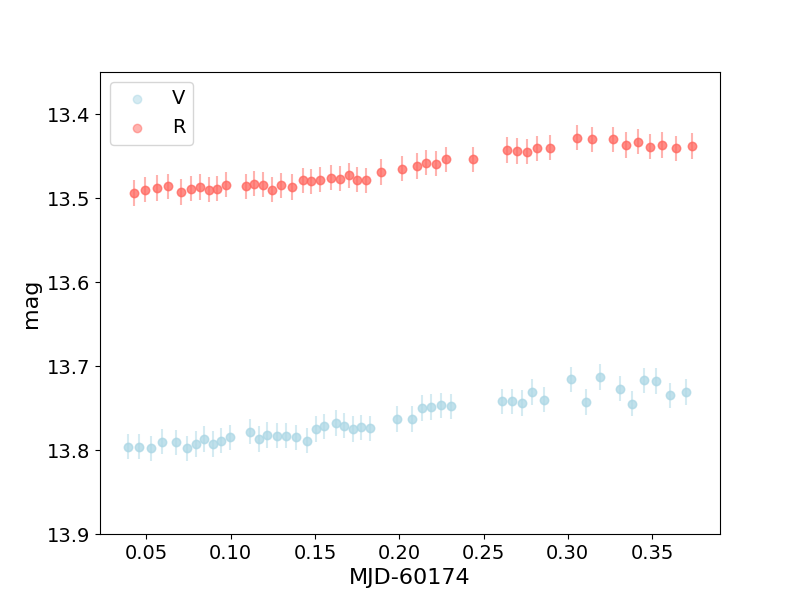
Figure 8: Intra-night variability (Aug 17, 2023) in R2/R3; flux changes up to 0.09 mag in five hours.
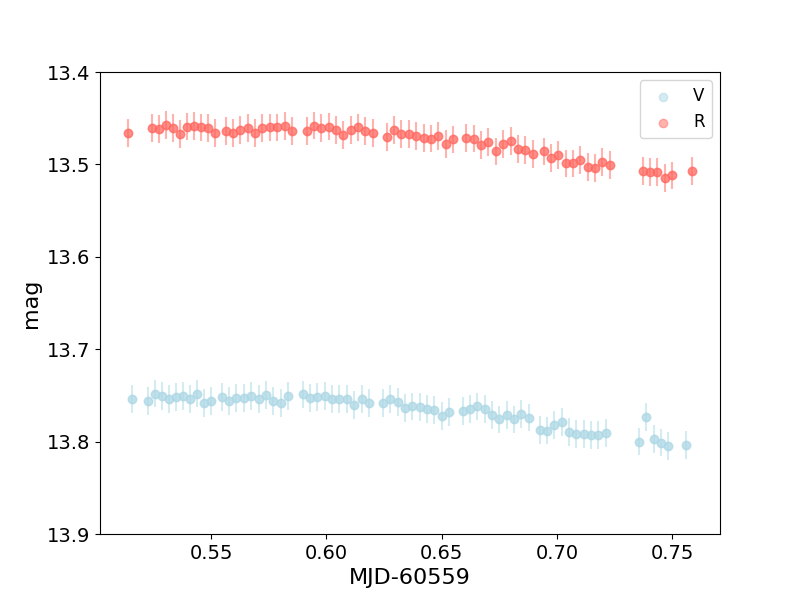
Figure 9: Microvariability on Sep 6, 2024 (R4/R5); amplitude of 0.05 mag in R63 hours.
Optical-to-X-ray Correlation Analysis
The search for optical–X-ray band correlations, employing the Z-transformed Discrete Correlation Function (ZDCF), yields weak and statistically insignificant (R7) correlations on timescales R8 days Figure 10. This is consistent with earlier findings of chromatic variability and suggests minimal co-spatiality between the dominant optical and X-ray emitting populations during quiescent and moderate activity states.
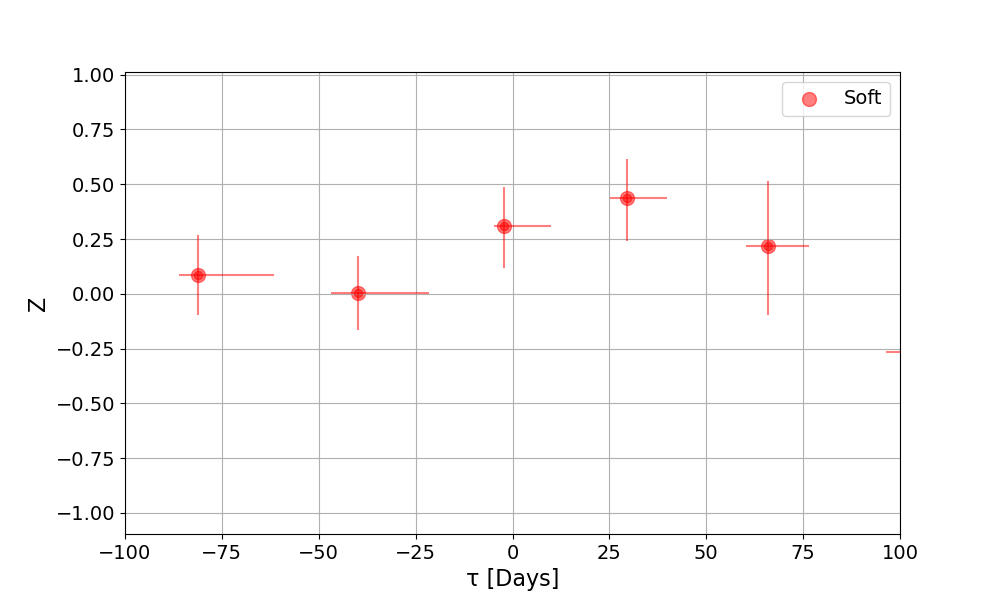
Figure 10: ZDCF: correlation between R9 and soft X-ray; significance remains weak, with no robust lags detected.
The absence of strong optical–X-ray correlation argues against long-term geometric effects (e.g., jet precession) as the primary driver, instead indicating independent emitting regions or decoupled variability drivers in the jet and disk.
Spectral Index Evolution
The optical spectral index I0 (computed via power-law fits I1 using I2 and I3) is persistently negative, confirming dominance of non-thermal synchrotron emission. Examination of the spectral index as a function of flux Figure 11 points to only weak evidence for a bluer-when-brighter trend, with wide dispersion precluding strong statements regarding chromatic trends. However, long-term analysis Figure 12 identifies a statistically significant secular hardening (flattening) of the optical spectrum (I4\ yrI5), especially over the last decade.
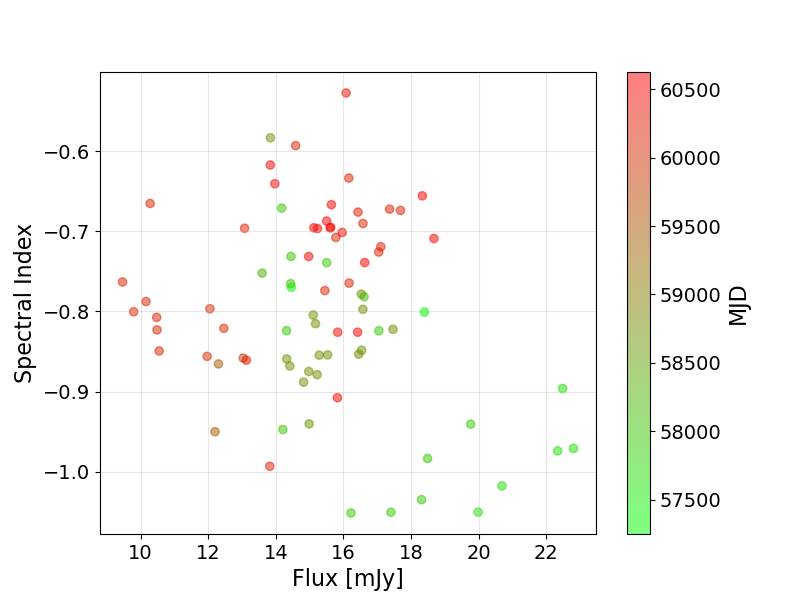
Figure 11: Scatter of spectral index I6 vs. flux; color encodes observation time (MJD).
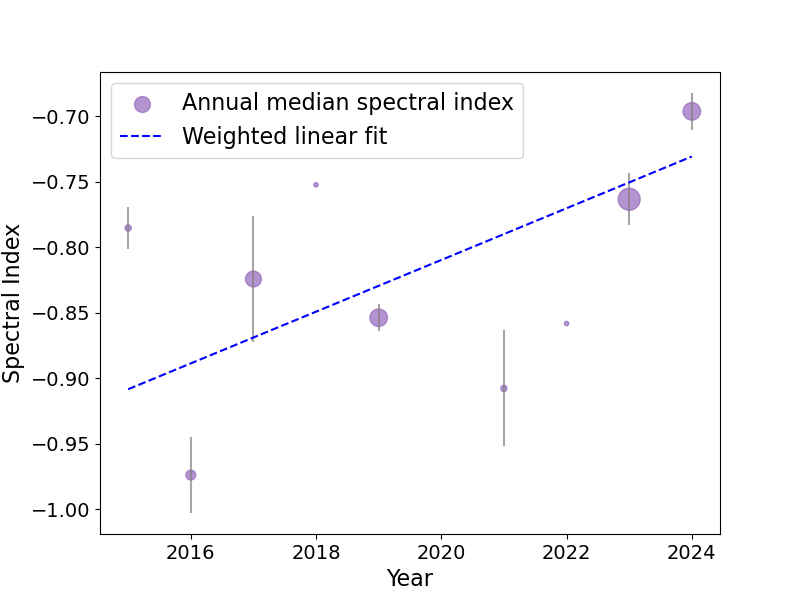
Figure 12: Annual median spectral index; linear fit reveals secular flattening over 2015–2024.
Such behavior is compatible with shifts in the dominant electron acceleration or cooling mechanisms and may reflect evolving Doppler boosting or source conditions within the relativistic jet.
Quasi-Periodic Oscillations and Stochastic Variability
Despite the literature’s report of possible long-term QPOs, the present analysis is restricted to intra-month regimes due to unavoidable annual sampling gaps. Segment-based Phase Dispersion Minimization (PDM) analysis identifies apparent candidate periods (I713.6, 19.6, 29.7 days) within three of nine high-cadence segments. However, applying surrogate red noise hypothesis testing using synthetic light curves with matched power spectral indices demonstrates all putative signals have I8 (Figures 14–16), precluding a significant periodic interpretation. The periodicity structure is consistent with red noise stochasticity (i.e., turbulent jet emission) rather than underlying deterministic or geometric drivers.
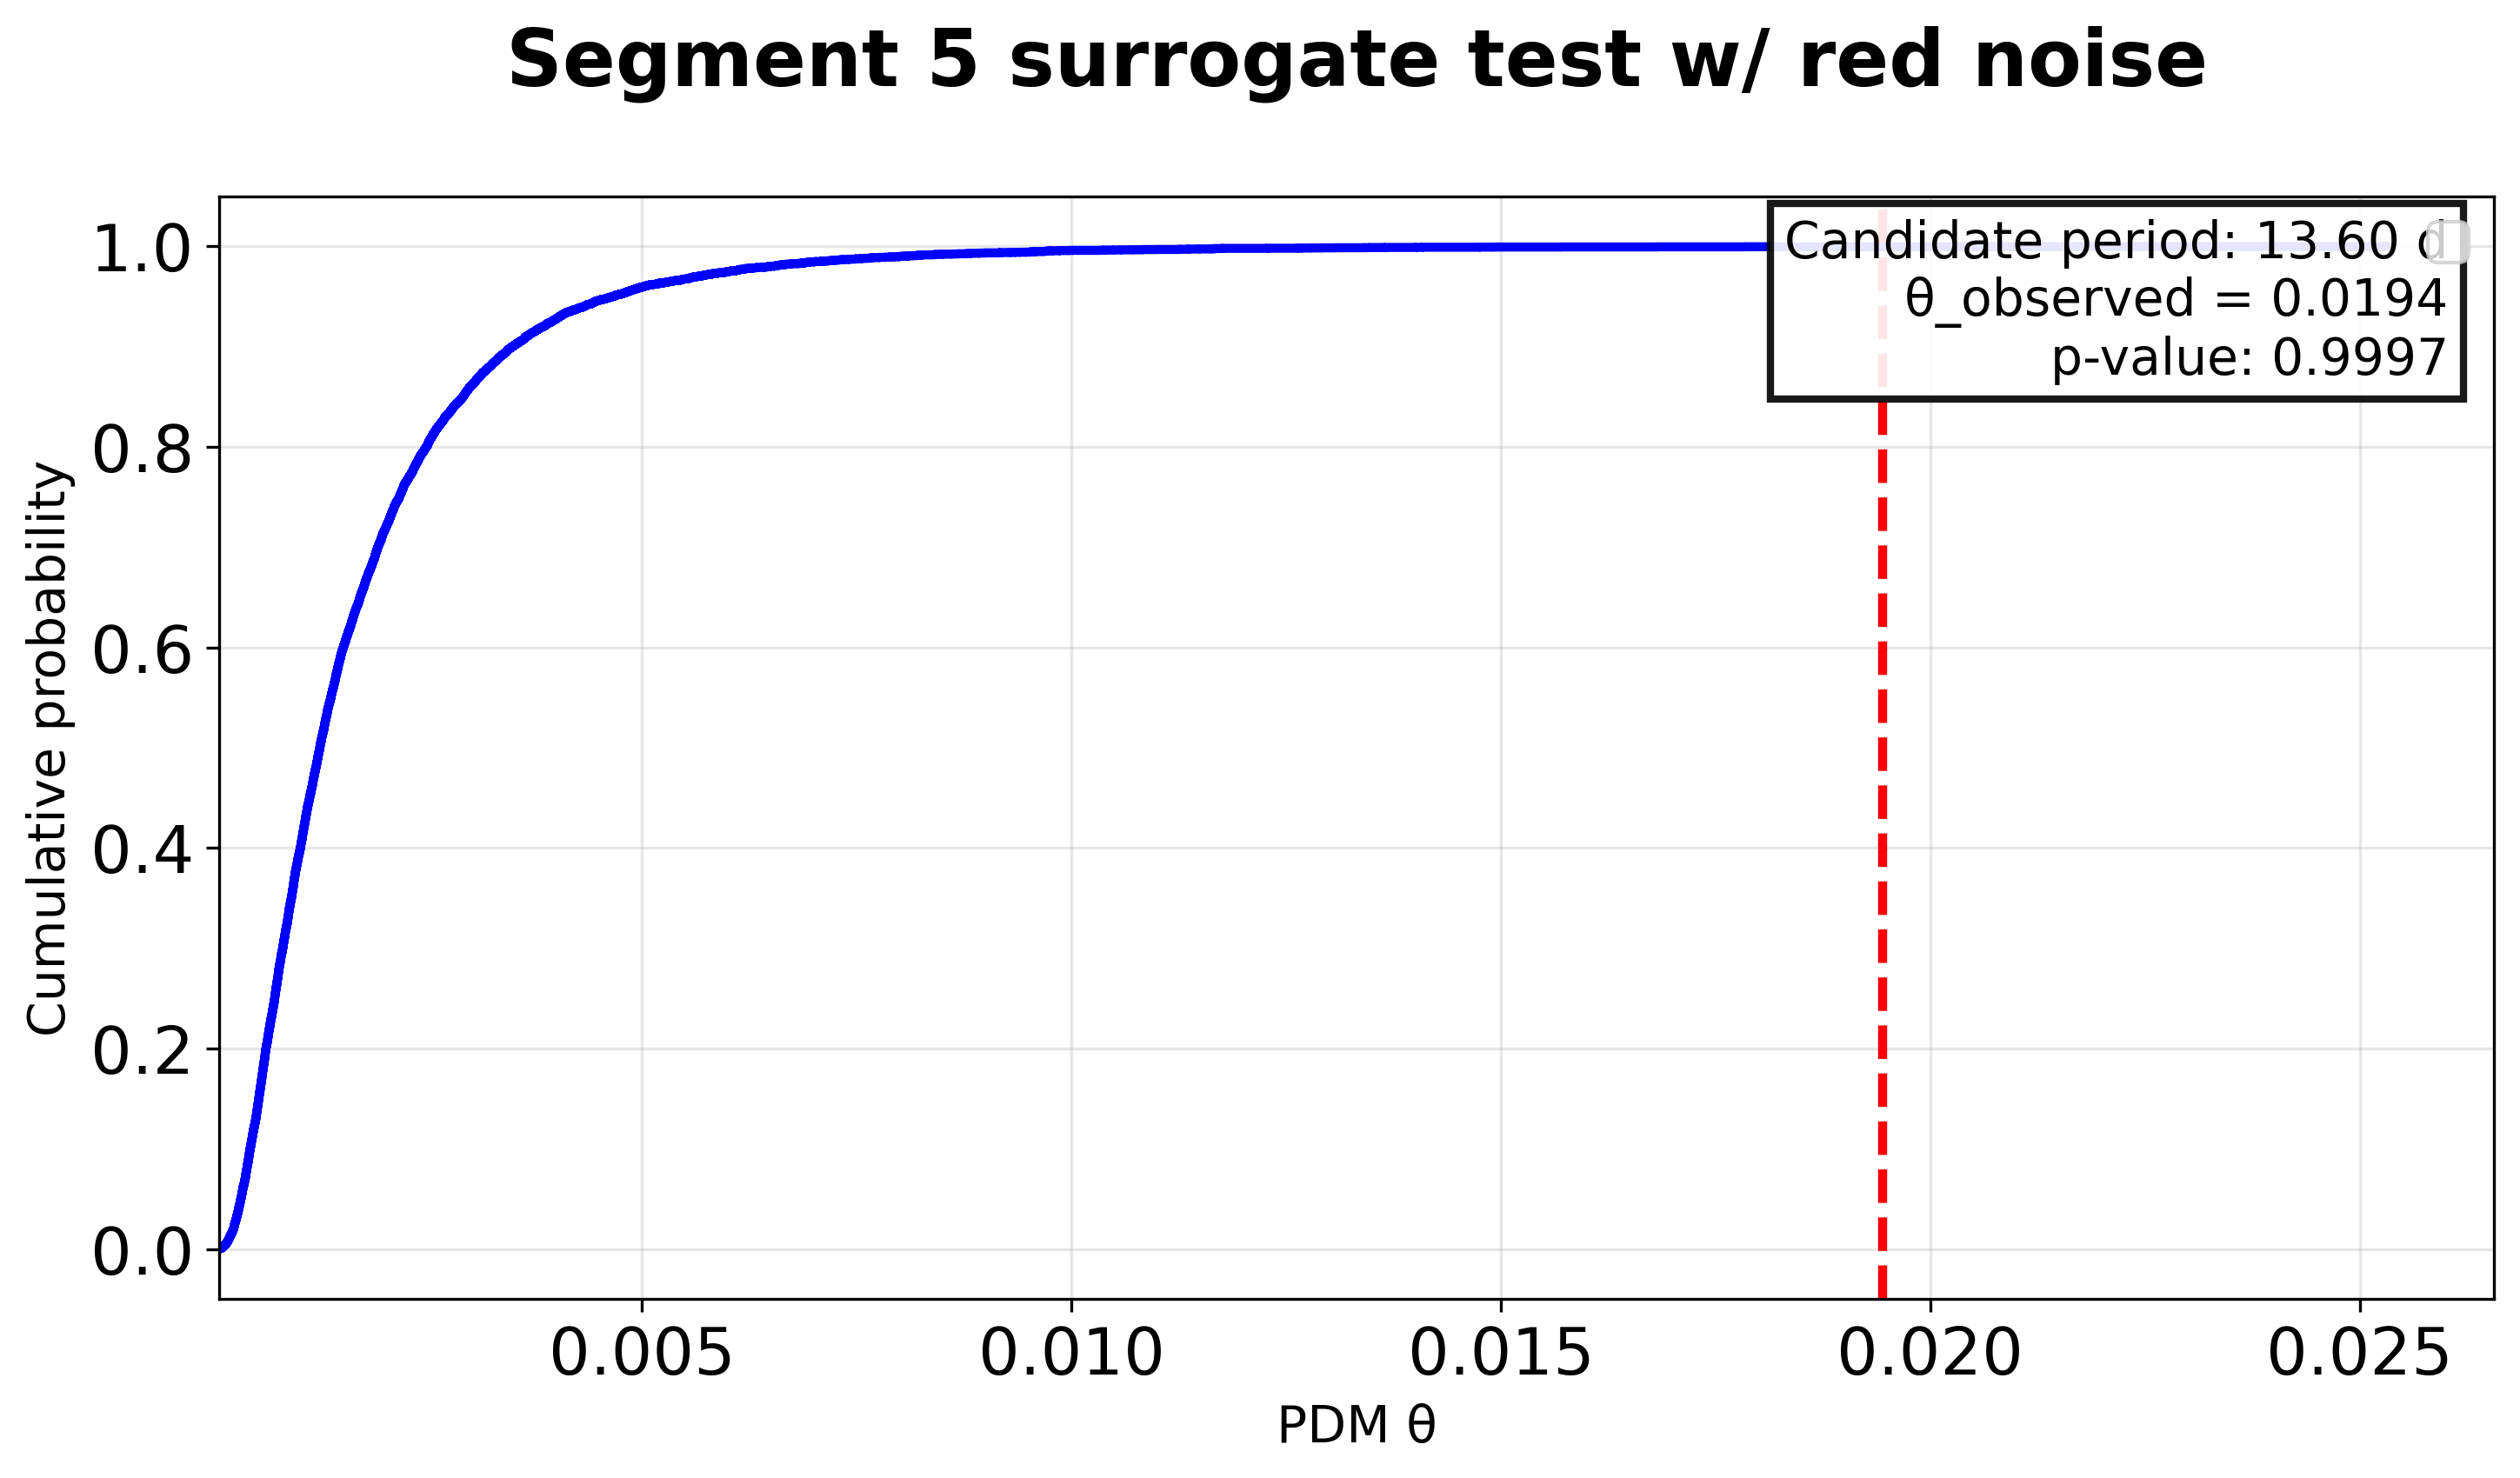
Figure 13: PDM cumulative distribution for segment 5; the real I9 falls within the red noise expectation (V0), indicating non-significance.
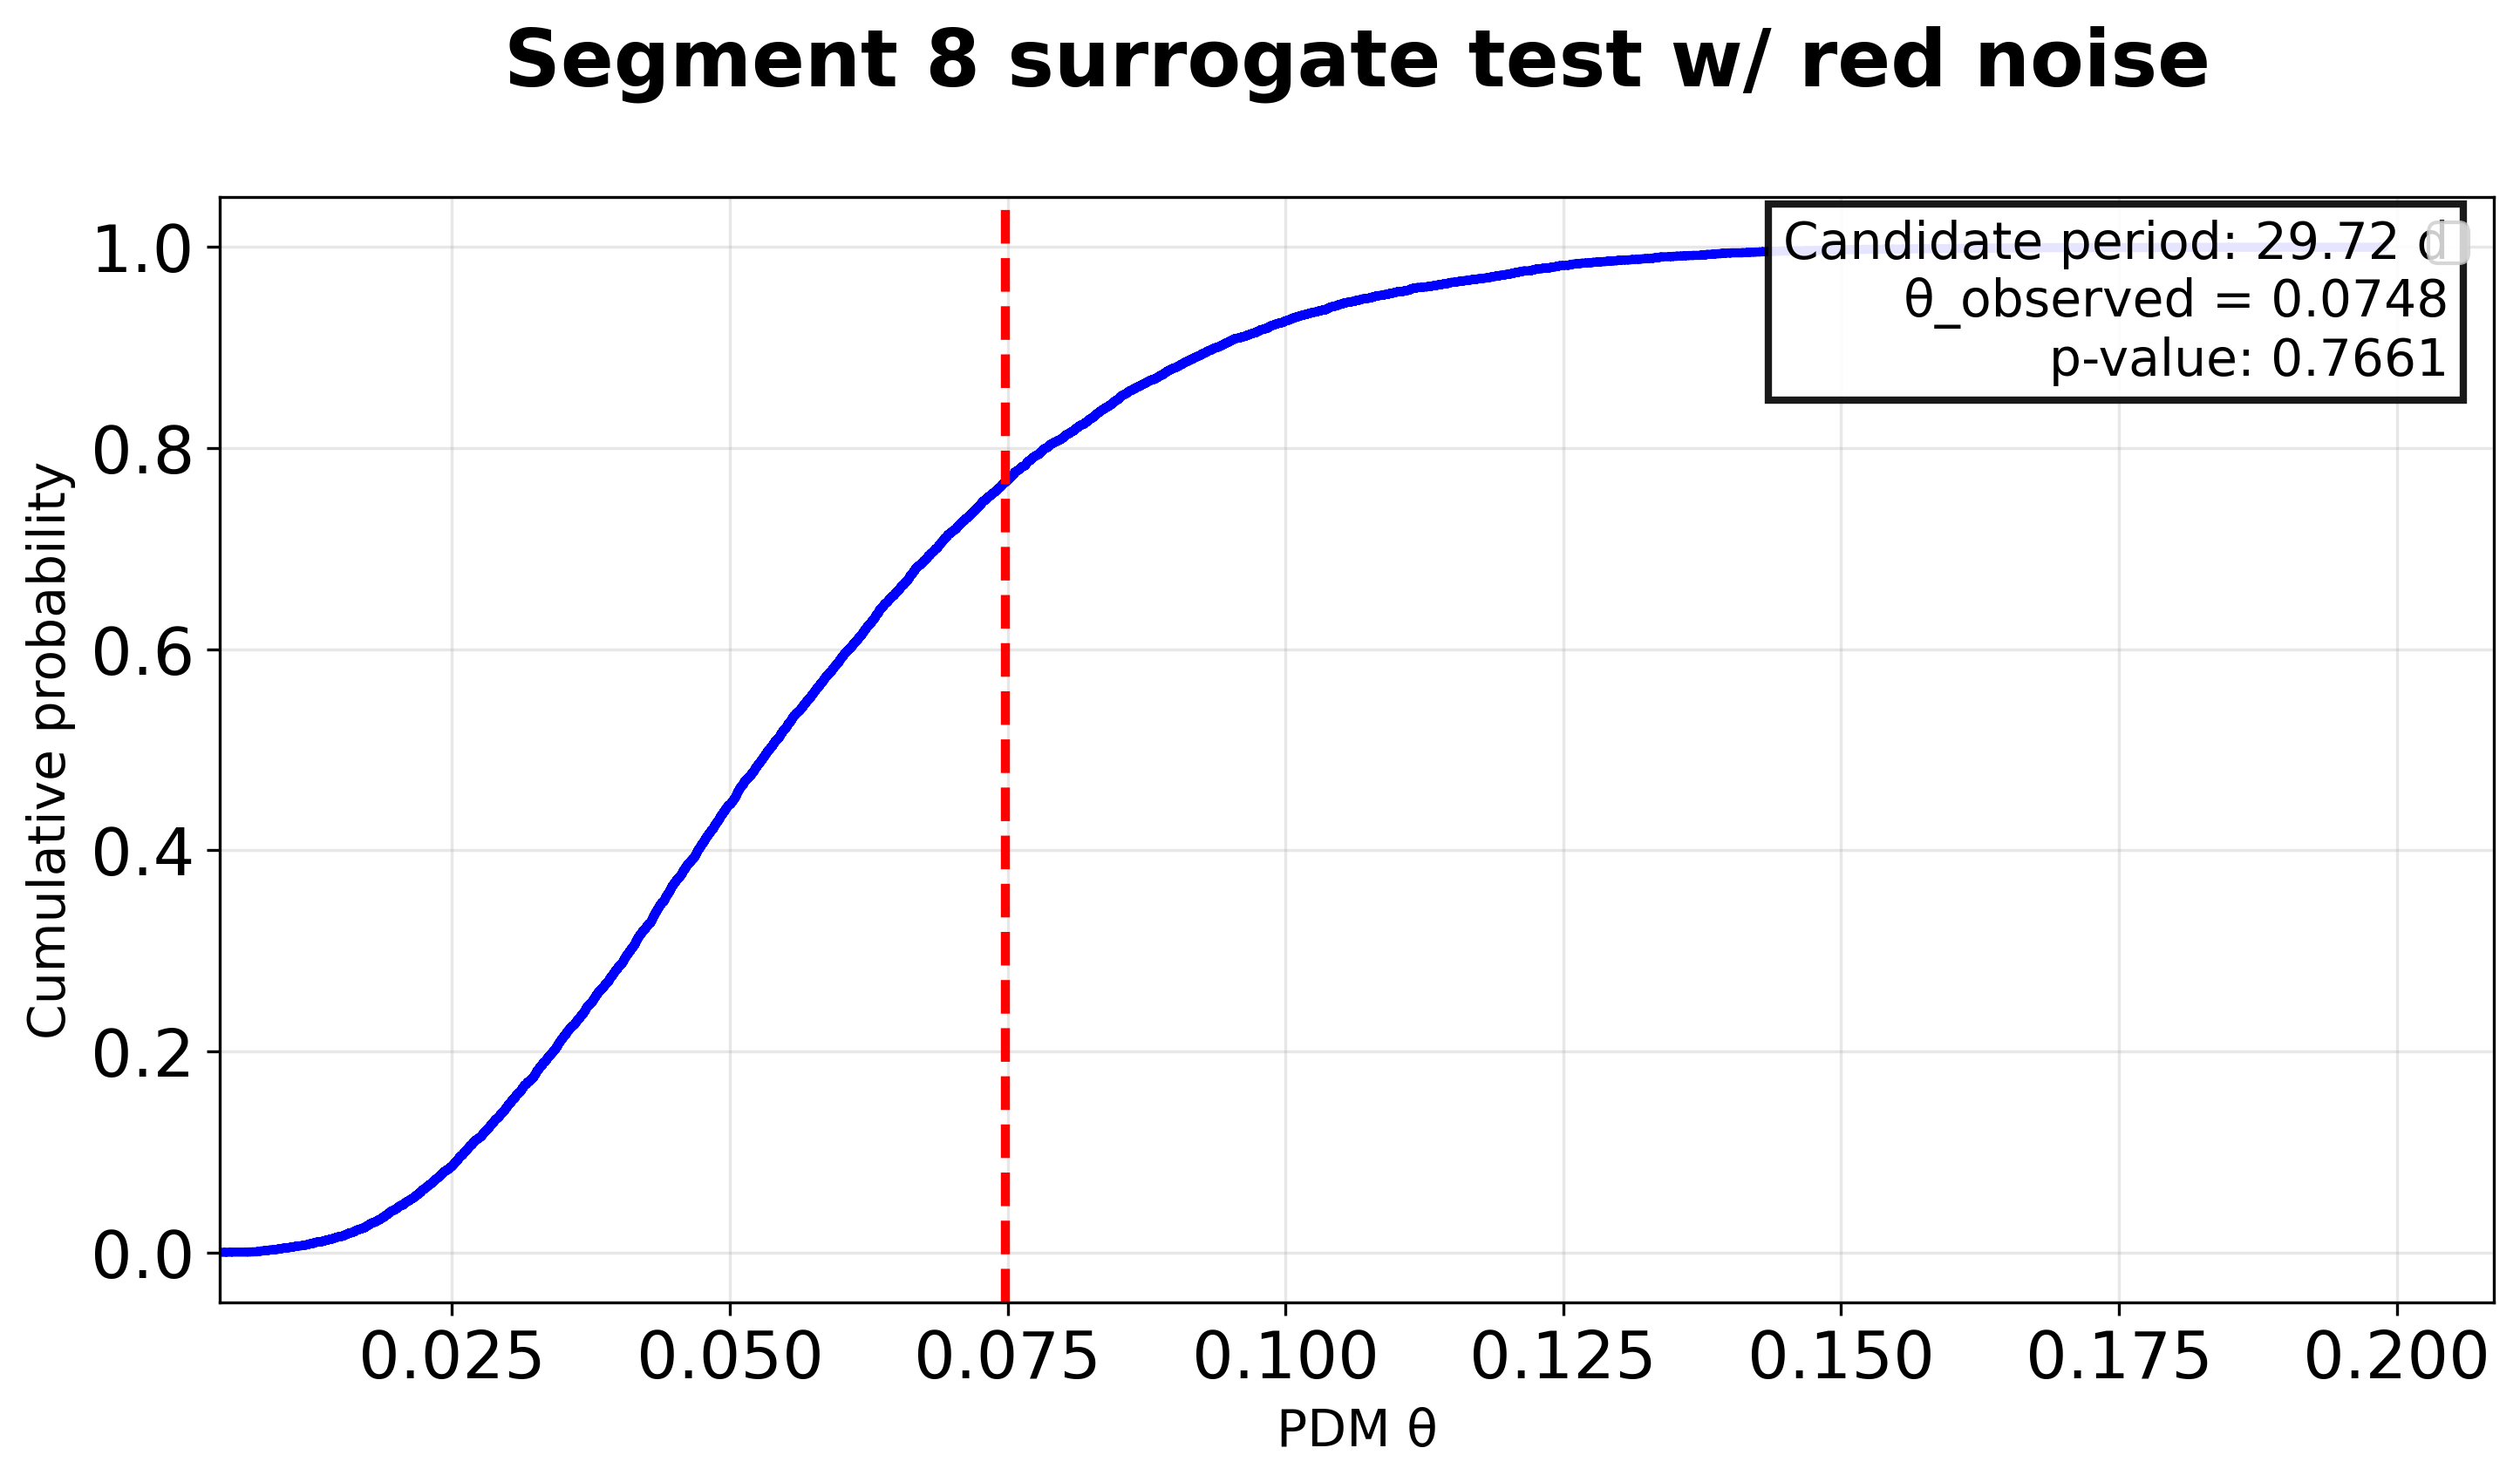
Figure 14: PDM cumulative distribution for segment 8 (V1); likewise consistent with red noise.
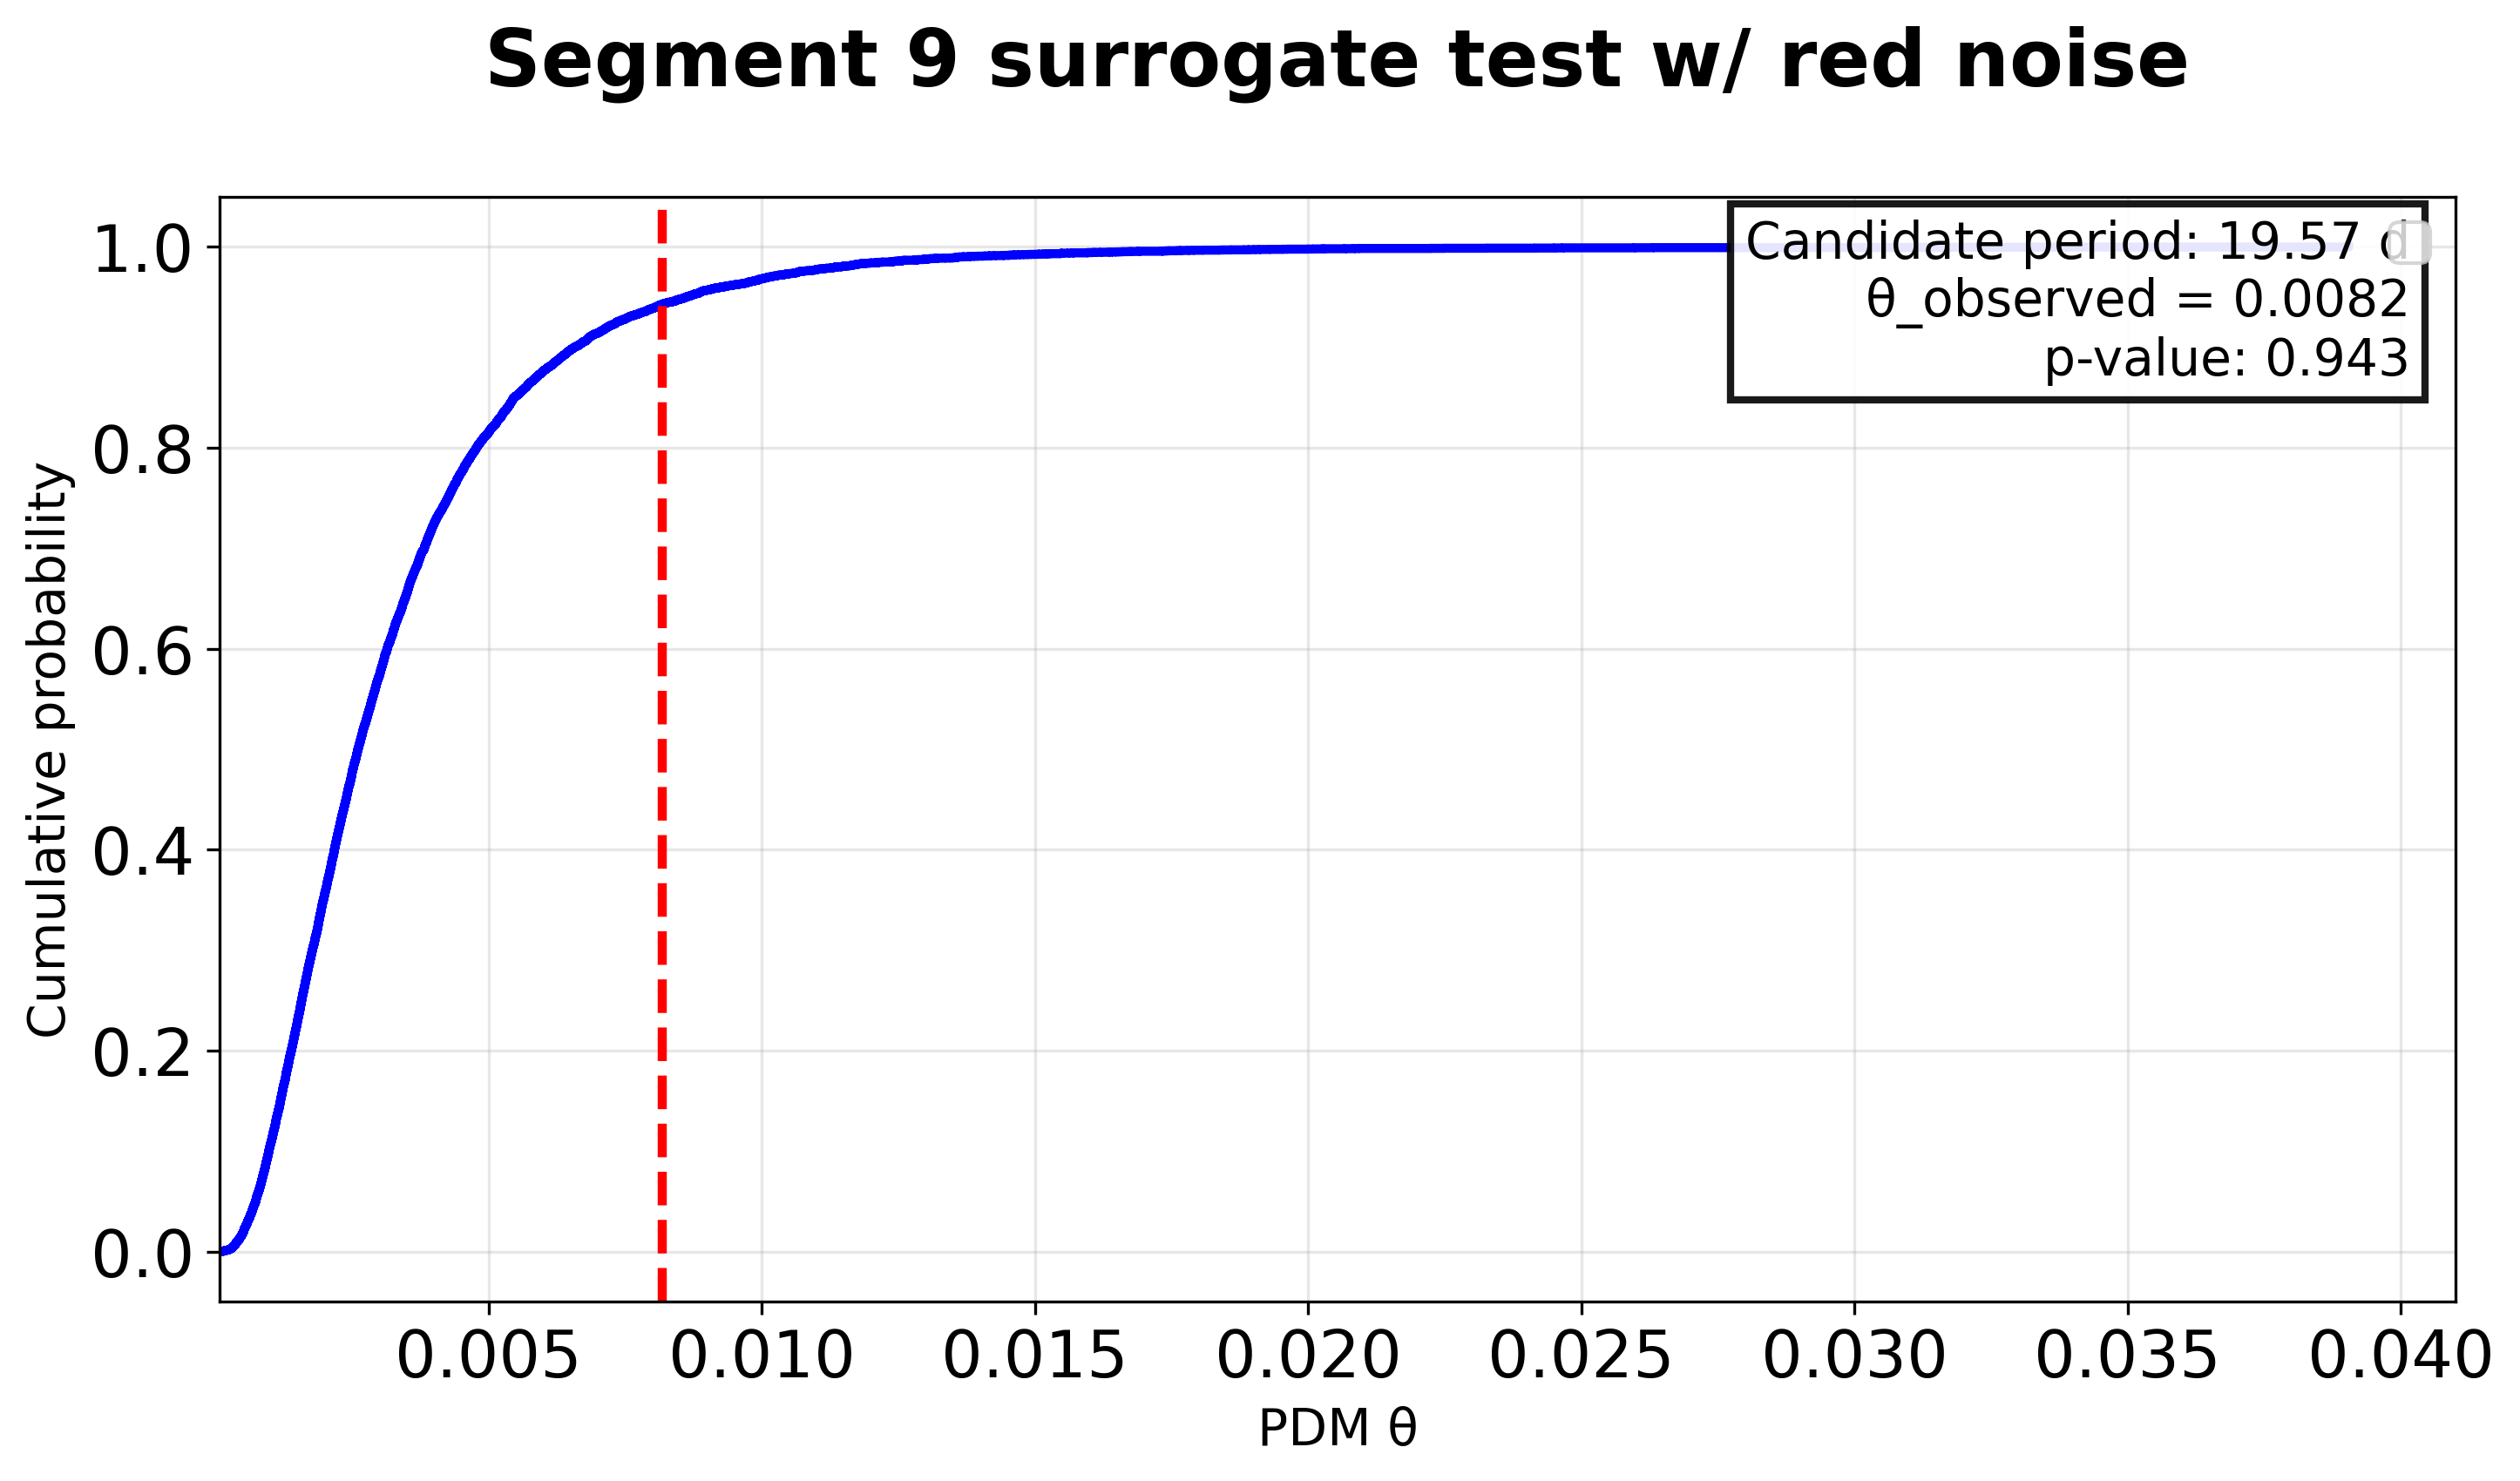
Figure 15: PDM cumulative distribution for segment 9 and candidate period near 20 days (V2).
Contextualization with Historic Variability and Broader Surveys
Comparison of the PKS 2155-304 V3 band light curve with ASAS-SN and prior literature Figure 16 demonstrates the source operated in a relative low-activity state during the studied period, with lower mean optical fluxes and amplitudes compared to prior epochs.
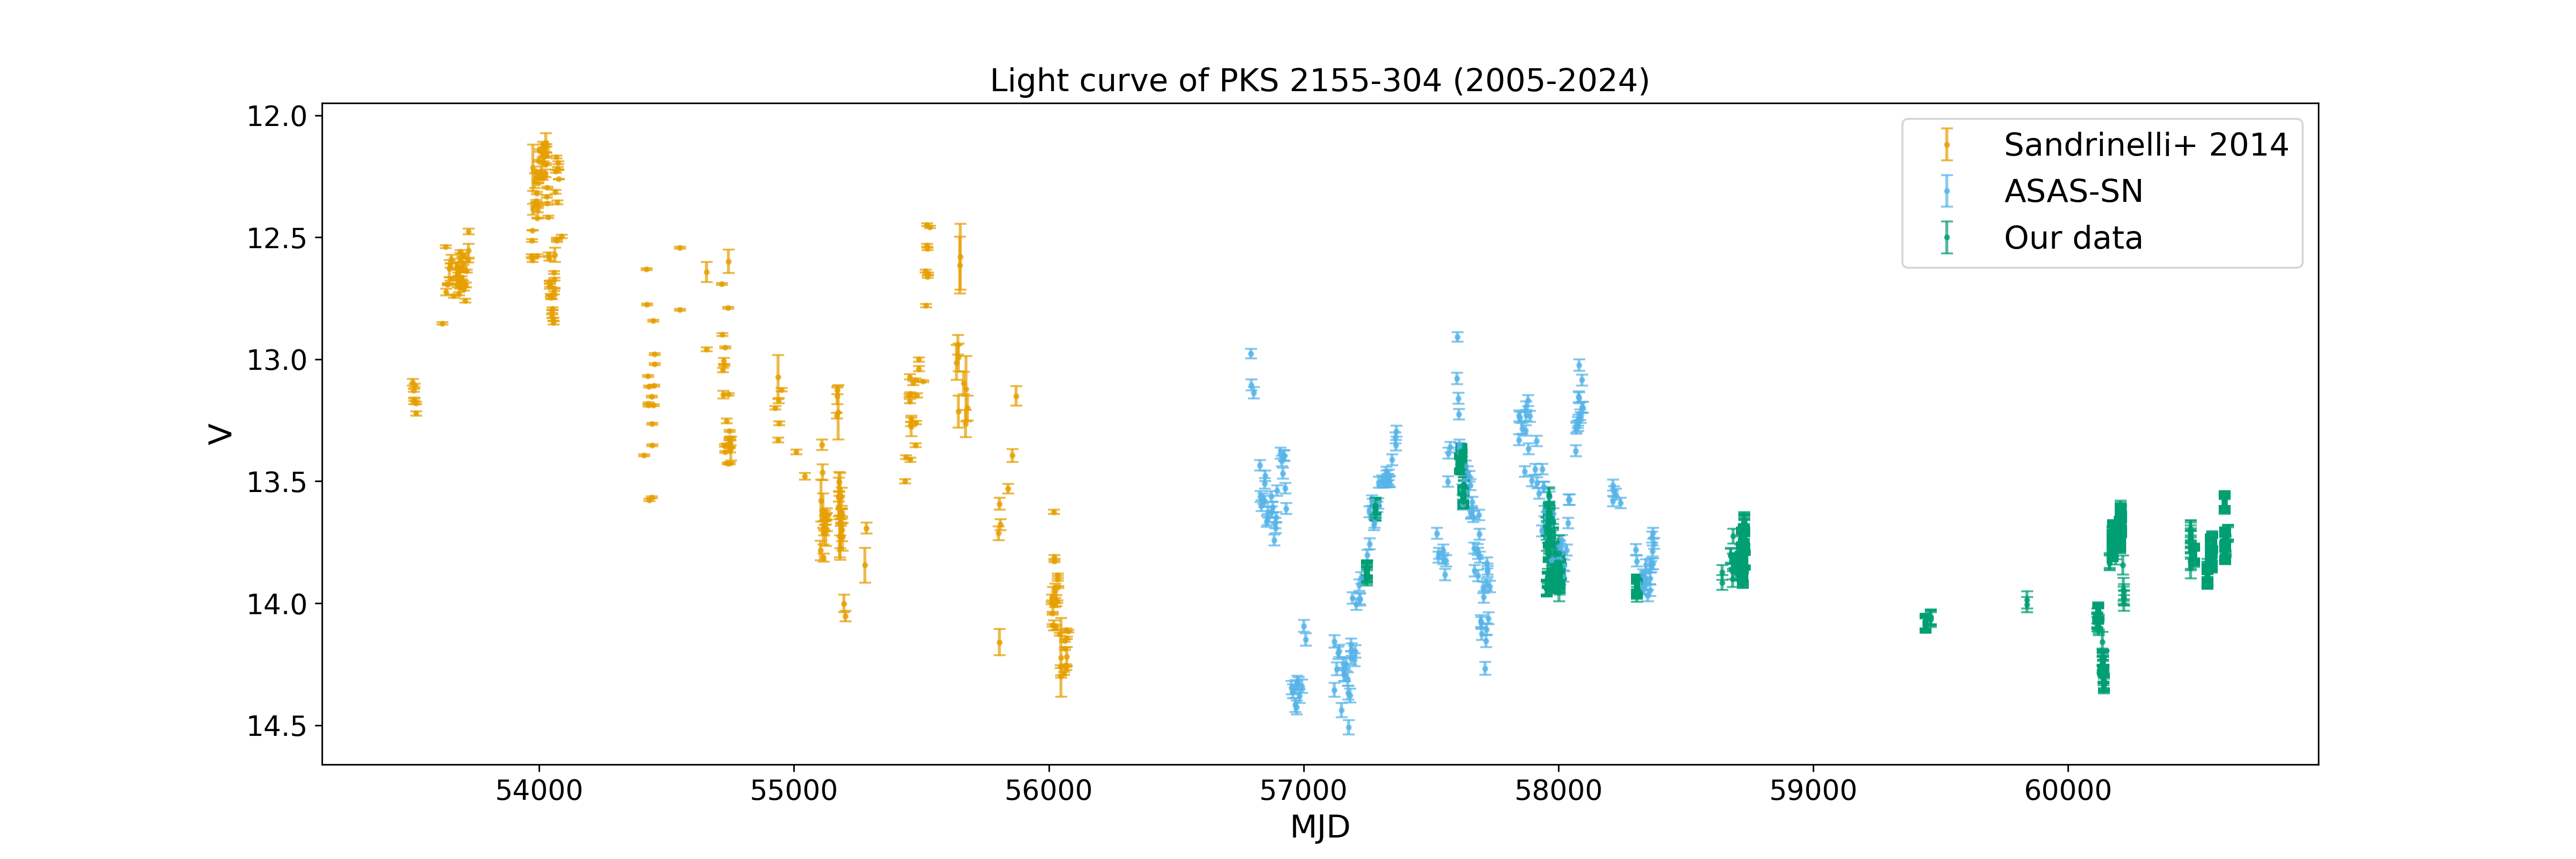
Figure 16: Historic V4-band light curves showing lower flux states in recent years as compared to periods covered by Sandrinelli et al. and ASAS-SN.
Conclusions
The present study establishes several key findings supported by high-cadence, multi-year optical monitoring:
- PKS 2155-304 displays robust, multi-scale optical variability. Variability is confirmed in all major temporal bins, with systematic microvariability detected below four-hour timescales only during high-activity intervals.
- A statistically significant secular hardening of the optical spectral index is observed over the past decade, with persistent non-thermal emission characteristics.
- There is no statistically significant optical QPO within 2–30 day periods detectable above red noise; observed structure in periodograms is compatible with stochastic (red noise) processes rather than periodic mechanisms.
- Optical–X-ray cross-band correlations are weak, supporting models where optical and X-ray emission region variability are largely decoupled on observed timescales for this source.
- An optically identified flare temporally coincident with enhanced X-ray activity is quantitatively described, providing a basis for future multifrequency follow-up and validation of emission models.
Implications and Future Directions
The data advocate for jet-dominated, turbulence-driven stochastic variability in the optical regime of PKS 2155-304, with little compelling periodic structure apparent even on carefully isolated time segments. The secular flattening of the spectrum points to long-term evolution in jet physical conditions or kinematics, warranting continued multifrequency (radio-optical-X-ray-TeV) monitoring to disentangle underlying physical drivers. Future coordinated campaigns should strive for enhanced simultaneous optical/X-ray sampling to unambiguously clarify prompt multiwavelength correlations. Additionally, very high cadence optical photometry during outburst episodes may offer the best prospect for identifying deterministic variability architecture, should it exist in this archetype blazar.