- The paper introduces a room-temperature dielectric haloscope that converts dark photons into visible signals using spatial pattern matching for robust background discrimination.
- It employs a multilayer dielectric stack of 47 mirror-backed pairs, calibrated via TEM and laser mapping to optimize photon conversion efficiency.
- The study establishes a 90% CL upper limit on the dark-photon kinetic mixing (κ < 4.0×10⁻¹³ at ~2 eV) and discusses scalability for improved sensitivity.
Search for Dark Photons with a Room-Temperature Dielectric Haloscope
Motivation and Theoretical Framework
The search for dark-photon dark matter (DPDM) is motivated by compelling theoretical scenarios in which dark photons, as vector boson mediators of a hidden Uχ(1) sector, can account for some or all of the cosmological dark matter density. Through kinetic mixing with the Standard Model (SM) photon, DPDM may be detected via oscillatory couplings that induce weak electromagnetic signatures in suitably designed laboratory apparatus. This work focuses on the eV mass regime (mA′∼2 eV), a range in which the converted photon energy enables direct detection in the visible spectrum, but where traditional haloscope approaches face reduced resonant enhancement and readout difficulties due to increased noise and diminished conversion factors.
The detection principle leverages a periodic dielectric multilayer stack engineered to maximize the photon conversion rate by enforcing the half-wave resonance condition. Integral to the approach is the coherent addition of conversion amplitudes across interfaces, which allows for a resonant boost in the signal amplitude under well-controlled stack geometry and readout conditions. Emission from the stack occurs into a narrow angular cone, enabling high-efficiency collection via compact optics, and the spatial distribution across the focal plane forms a robust, pattern-matched template for discriminating true conversions from instrumental background.
Experimental Design: The SPECTRA Prototype
The SPECTRA (Spatially-resolved Photon Emission Conversion with Transmission Reflector Arrays) prototype realizes this detection philosophy through a highly integrated and calibrated platform. The core detection module comprises a 1-inch-diameter, sapphire-substrate-based TiO2/SiO2 dielectric stack (47 pairs, mirror-backed), a focusing lens (75 mm focal length), and a thermoelectrically cooled CMOS detector array with 3000×3000 pixels, offering both sensitivity and high spatial granularity. The system operates at room temperature, enclosed for radiative and mechanical isolation. A secondary, tunable He-Ne laser-based optical chain supports in situ calibration across the full detection plane by delivering a controlled, attenuated 633 nm beam at low flux to anchor the detection efficiency and spatial mapping.
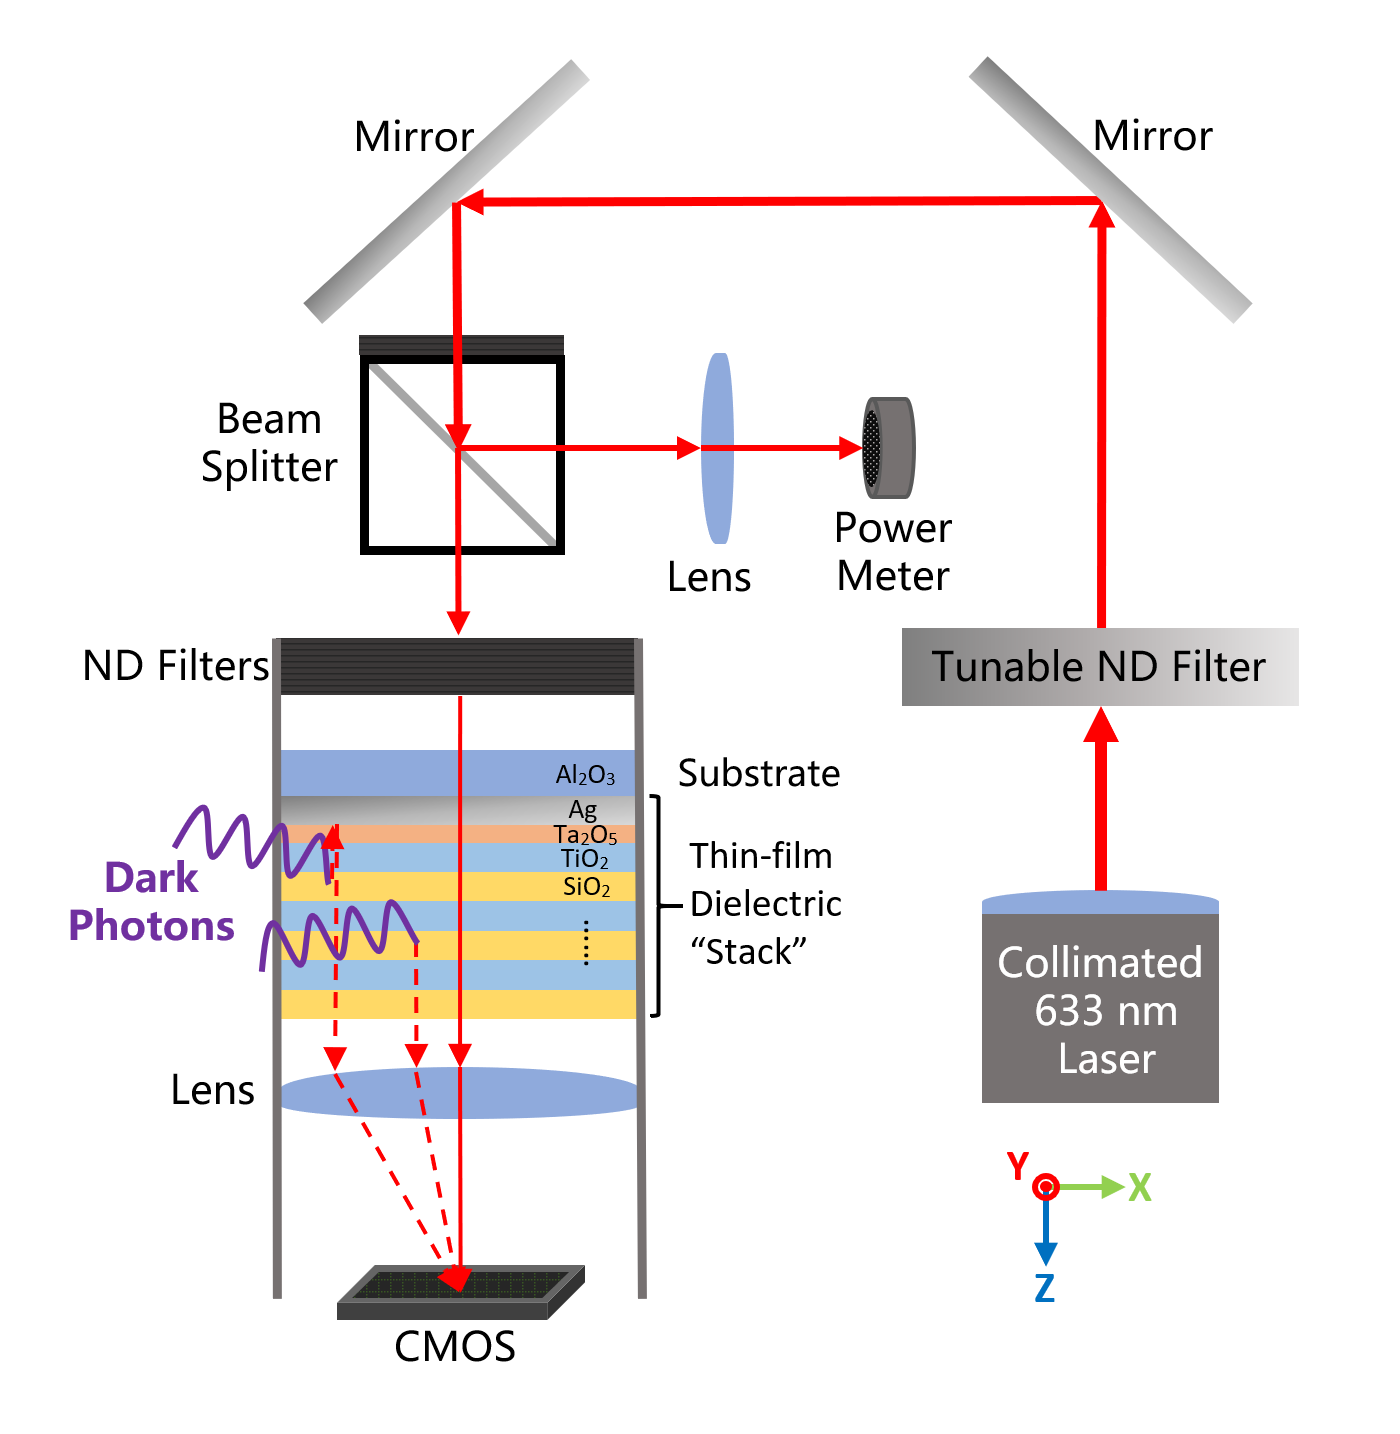
Figure 1: Schematic of the SPECTRA prototype showing the stack, focusing lens, and photodetector in a lens tube with a dedicated calibration system.
A substantial part of the experimental campaign is devoted to detailed stack characterization. Transmission electron microscopy (TEM) allows post-fabrication extraction of as-built layer thicknesses, central to computing the boost factor β and its associated uncertainty.
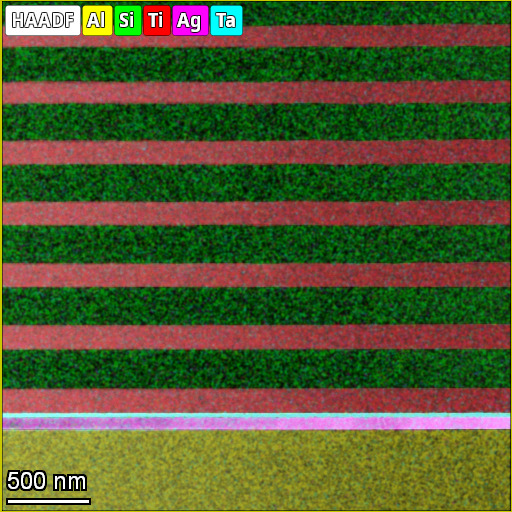
Figure 3: Transmission electron microscopy cross-section of the multilayer stack, resolving the sequence of substrate, Ag mirror, Ta2O5 layer, and alternating TiO2/SiO2 dielectrics.
DPDM Signal, Backgrounds, and Calibration
The DPDM conversion rate is proportional to mA′∼2 eV0 (kinetic mixing), local DM density, and features an mA′∼2 eV1-dependent boost factor determined by stack geometry and refractive indices. The efficiency of the system, mA′∼2 eV2, encapsulates optical throughput, focusing, and detector quantum efficiency (measured in situ and cross-checked against manufacturer calibration curves).
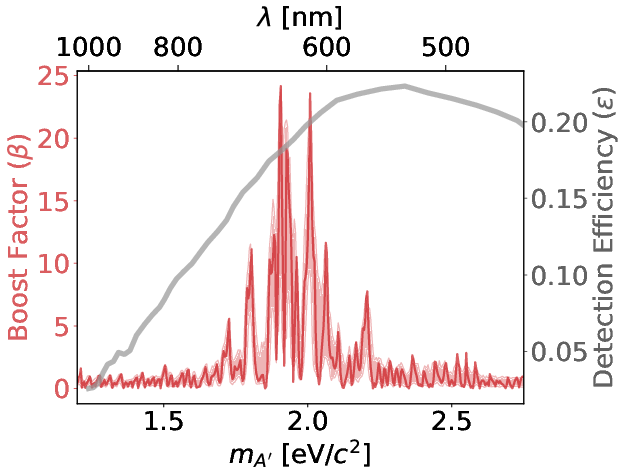
Figure 4: Stack-induced boost factor mA′∼2 eV3 and total detection efficiency mA′∼2 eV4 as a function of mA′∼2 eV5, with uncertainty derived from measured thickness fluctuations.
The experiment employs a rigorous, three-stage calibration and control strategy:
- Electronic/pixel calibration: Per-pixel gain and offset characterization via bright and dark, short exposures.
- Spatial/optical calibration: Laser mapping of the focal plane to establish template morphology and define spatial ROIs.
- Weak-light calibration: Low-flux, attenuated laser exposures to anchor end-to-end optical efficiency, used for subsequent normalization in the signal likelihood model.
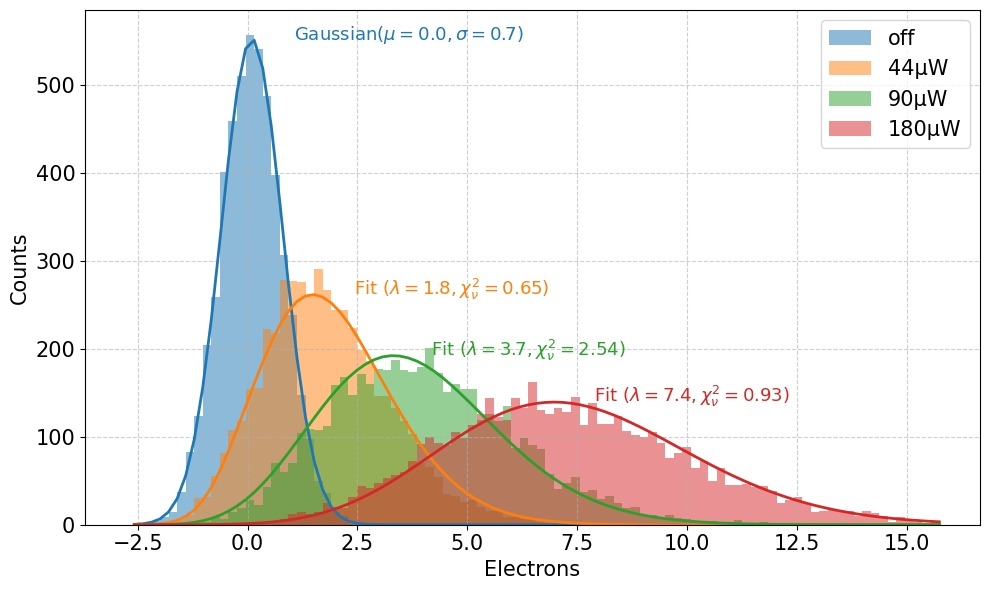
Figure 6: Model validation of the per-pixel single-photon response across four laser intensity settings in the defocused regime.
Pattern consistency of the DPDM-induced emission is established by comparing measured and simulated spatial distributions, with uncertainties in focusing and alignment incorporated as morphable nuisance parameters in later inference.
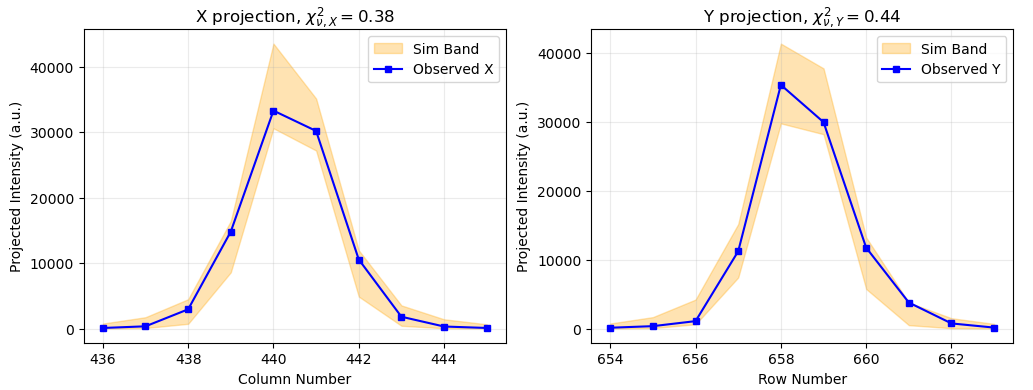
Figure 2: X and Y projections of the calibration pattern compared with Monte Carlo optical simulations across focus uncertainty intervals.
Statistical Analysis and Results
The primary dataset consists of 904 hours of stack-on exposure and 404 hours of background data (post stack removal) collected in hour-long exposures, all with tightly regulated sensor temperature. Analysis proceeds by comparing observed counts and focal-plane patterns to the combined signal-plus-background model, using a profile likelihood formalism that fully incorporates spatial information rather than reducing to a scalar rate comparison. Macro-pixel aggregation enhances inference tractability in the low-count Poisson regime, and the Feldman–Cousins approach ensures correct coverage under systematic and morphological uncertainties.
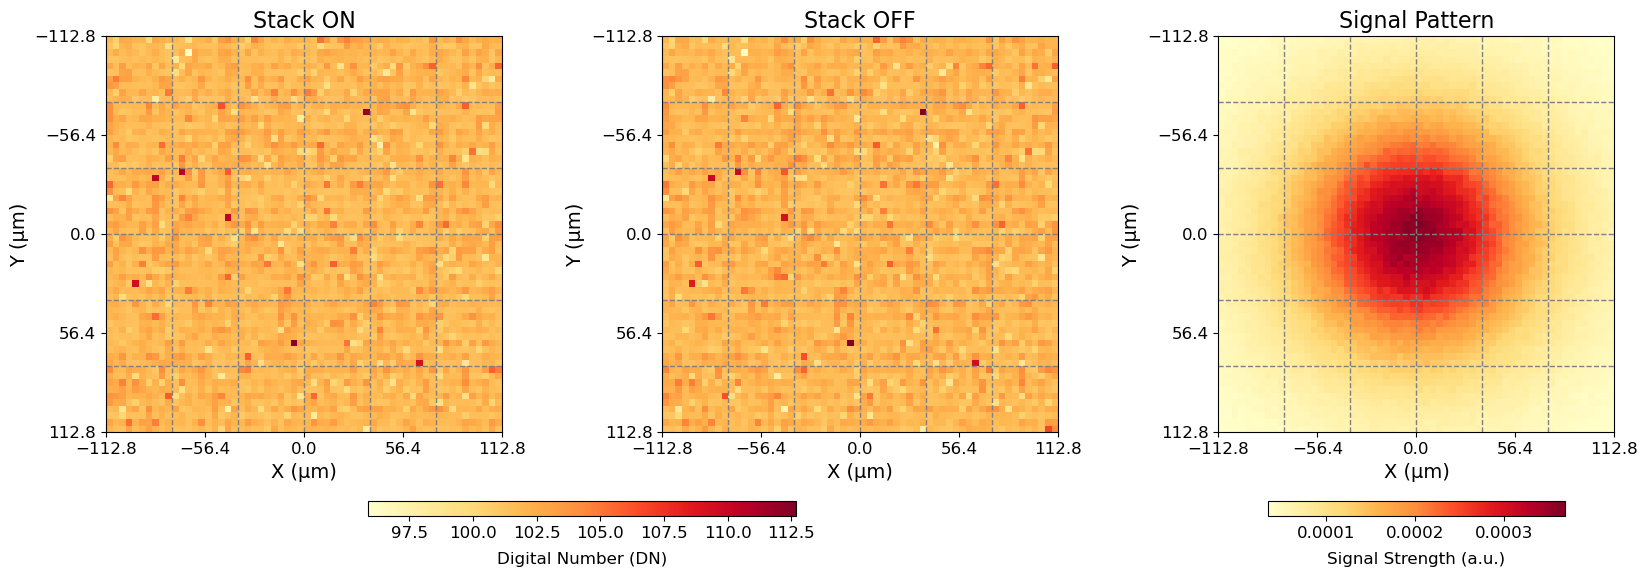
Figure 5: Pixel-by-pixel spatial distributions in Science Run (“stack-on”), Background Run (“stack-off”), and the simulated DPDM signal template across the principal ROI.
Across all exposure, no significant excess above the calibrated background is observed, either in total count or in any spatially consistent pattern. The analysis sets a 90% CL upper limit of mA′∼2 eV6 at mA′∼2 eV7, an improvement by about a factor of two over a counting-only analysis that neglects spatial pattern consistency.
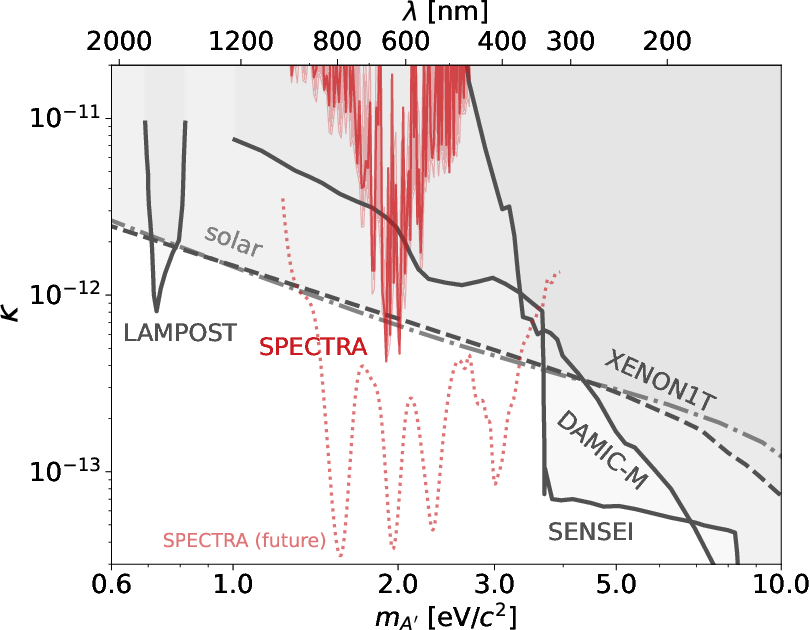
Figure 7: SPECTRA prototype’s exclusion limit on dark-photon kinetic mixing parameter mA′∼2 eV8 versus mA′∼2 eV9, compared with leading laboratory and astrophysical constraints. The dashed red line projects performance for a future four-stack configuration.
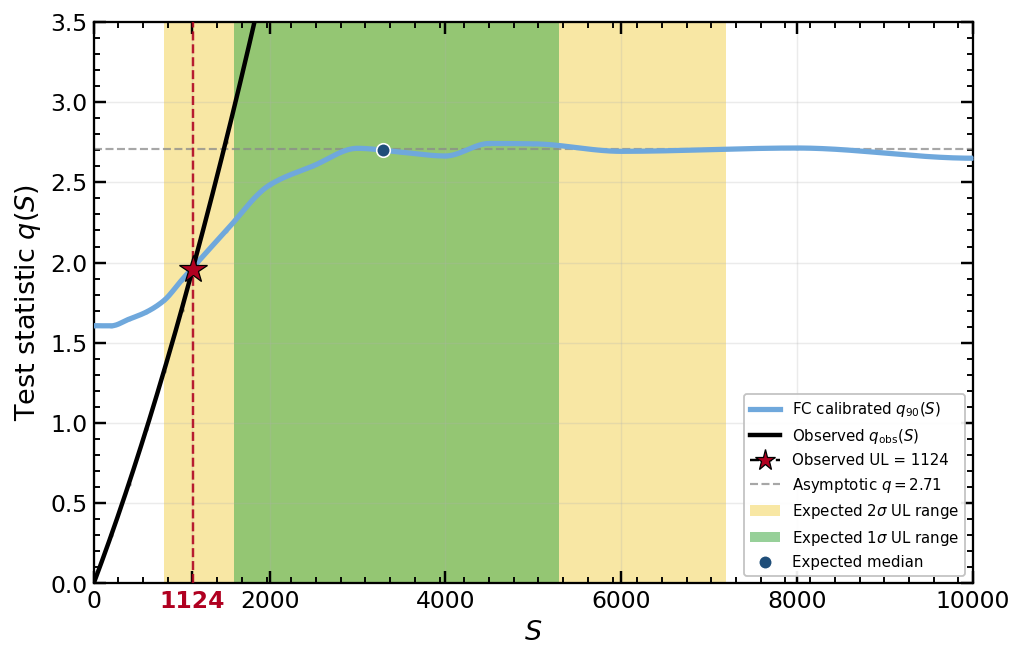
Figure 9: Feldman–Cousins construction for the upper limit on the signal strength, calibrated via toy Monte Carlo pseudo-experiments.
Systematic Uncertainties and Robustness
Experimental uncertainties are dominated by optical-efficiency calibration (2011%) and pixel/electronic response modeling (217%). The stack-response (boost factor) uncertainty is derived from TEM-measured thickness fluctuations. All contributions to the error on 22 are propagated explicitly via the statistical model.
Stability is verified both in the time domain (frame-by-frame ROI summation) and in repeated calibration runs, confirming mechanical/thermal control and absence of drift or unmodeled noise.
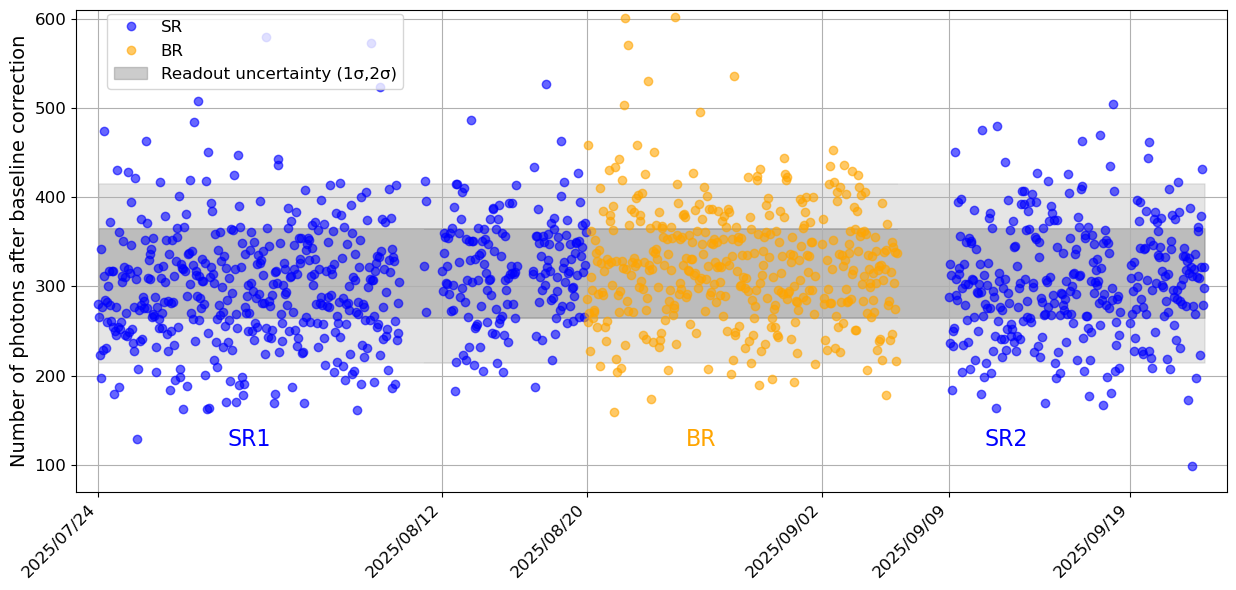
Figure 8: Temporal evolution of the total ROI signal, with Science Run, Background Run, and expected readout noise fluctuations indicated.
Implications, Future Outlook, and Theoretical Context
The results provide a new upper limit on 23 for DPDM in the near-2 eV mass window with a single, compact, non-cryogenic module. This regime is theoretically motivated, as positive evidence here would point to inflationary-scale physics not directly accessible in colliders. The SPECTRA platform’s principal innovation is the use of spatial template matching via high-granularity imaging, substantially enhancing background discrimination and reducing systematic uncertainty with respect to conventional counting or single-pixel approaches.
Importantly, the modular architecture, combined with laser-aligned stack tuning and multiplexed CMOS readout, offers a straightforward path to scalable, multi-stack deployments. As explicitly projected, a four-stack SPECTRA campaign with improved layer uniformity and reduced readout noise would enable order-of-magnitude gains in 24 sensitivity and facilitate cross-stack mass localization of any positive signature via amplitude-pattern matching.
Conclusion
This work demonstrates the feasibility and sensitivity benefits of template-based, spatially resolved optical haloscope searches for eV-mass DPDM using room-temperature dielectric stacks and high-performance CMOS detectors. No evidence is found for DPDM in the mass range probed; however, the methods and results establish a robust experimental platform with clear extensibility to larger, multiplexed arrays. The combination of in situ calibration, pattern-resolving readout, and well-understood stack response defines a new standard in direct detection techniques for ultralight bosonic dark matter in the optical regime (2607.03240).