- The paper demonstrates statistical bimodality in FRB 20240114A's energy and waiting time distributions, indicating two distinct emission epochs.
- Methodologically, it employs unbinned maximum-likelihood estimation over 35 daily epochs to identify a sharp transition in burst energies and rates.
- Findings reveal that post-21 March 2024, a steep energy index and longer waiting times challenge homogeneous Poissonian emission models.
Energy and Waiting Time Bimodality in FRB 20240114A: Evidence for Two Distinct Emission Epochs
Context and Motivation
FRB 20240114A is an extreme repeater discovered by CHIME and subsequently monitored extensively, yielding unparalleled burst statistics via FAST in 2024. The motivation for this study is to resolve whether the source exhibits stable emission characteristics or if its burst energy and temporal statistics reveal temporal variability indicative of distinct physical episodes. Statistical parallels with other hyperactive repeaters such as FRB 20121102A and FRB 20201124A provide a comparative baseline for understanding burst-type variability and the implications for FRB progenitor models.
Data Overview and Methodology
The analysis utilizes 11,553 bursts detected by FAST over a seven-month campaign (January–August 2024) with a mean burst rate of 249 hr⁻¹ and a fluence threshold of 0.026 Jy ms. The burst energy and waiting time (Δt) distributions are modeled using several competing analytic forms:
- Energy CDF: SPL (Simple Power Law), BPL (Bent Power Law), TPL (Thresholded Power Law), Band function.
- Waiting Time CDF: Poisson process, Weibull process.
For the full dataset, no single model adequately describes the observed distributions. This is evident below.
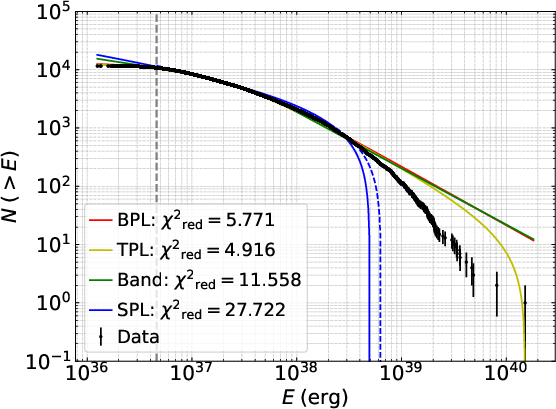
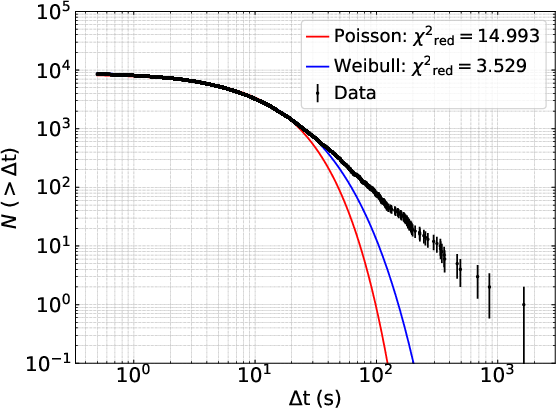
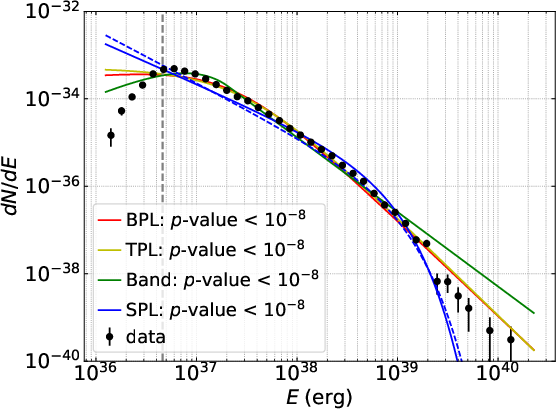
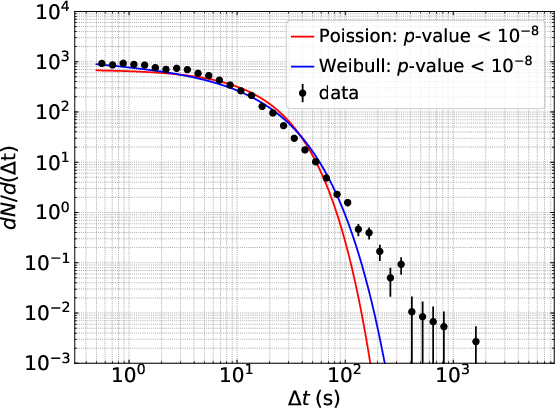
Figure 1: Cumulative and differential distributions of burst energy and waiting time for the entire FAST FRB 20240114A dataset, including best-fit SPL, BPL, TPL, Band (energy), and Poisson/Weibull (waiting time) models.
Independent unbinned maximum-likelihood estimation further confirms that the full population is not consistent with a unimodal statistical process, suggesting multiple regimes or superposition of emission types.
Temporal Segmentation and Characterization
To address the statistical complexity, the data are segmented into single-day subsamples with at least 50 detected bursts, yielding 35 daily epochs. Within these, the BPL and TPL models describe energy CDFs robustly, except on 2024-03-12, which exhibits pathological deviation. The BPL index β for each subsample clusters into two regimes:
- Before 21 March 2024: βˉb=1.006±0.074
- After 21 March 2024: βˉa=1.236±0.183
A concurrent shift is found in the Weibull waiting time parameter r (and Poissonian λ), both decreasing in the post-21 March window, indicating suppressed burst rates in that epoch.
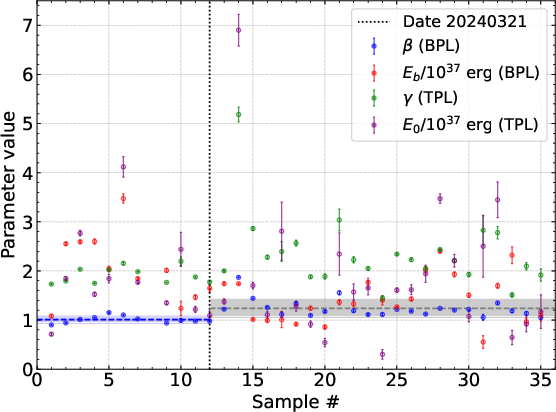
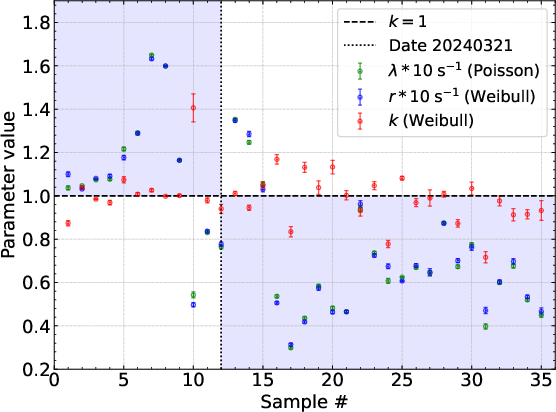
Figure 2: Left: Best-fitting BPL and TPL parameters for energy distributions, highlighting epochal invariance and transition; Right: Evolution of Weibull (k, r) and Poisson (λ) parameters, indicating reduced rates post-transition.
Statistical Contrasts: Energy and Waiting Time Distribution Evolution
Kolmogorov–Smirnov tests and probability histograms clarify the dichotomy. Most E>1039 erg bursts occur pre-21 March 2024, and KS statistics on large aggregated subsamples bracketed by this date show highly significant (β0) contrasts, especially at energies β1 erg.
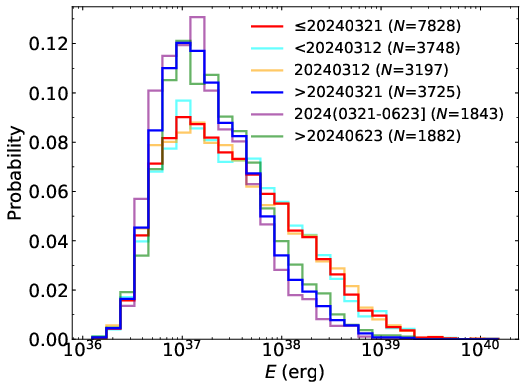
Figure 3: Probability histograms of burst energy in six major time-aggregated subsamples. Pre- and post-transition epochs show distinct high-energy tails.
Differential energy distributions above β2 erg transition from index β3 (pre-transition) to β4 (post-transition), consistent with a softening or steepening break.
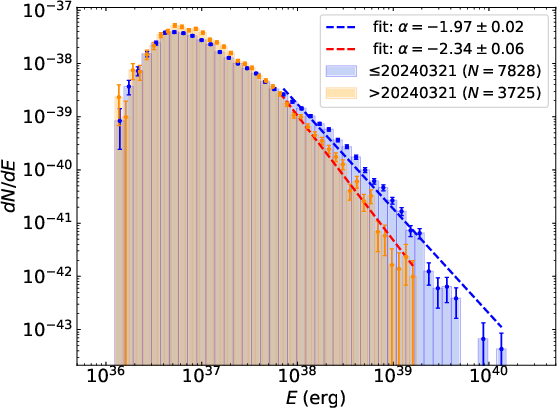
Figure 4: Differential burst energy distributions pre- and post-21 March 2024. Distinct power-law indices imply hard-to-soft evolution.
Waiting time analyses show the median β5 increases significantly from 5.87 s to 11.34 s across the two epochs—unlike the waiting time evolution in FRB 20121102A and FRB 20201124A, where the later active phase shortens, here the late phase is less active.
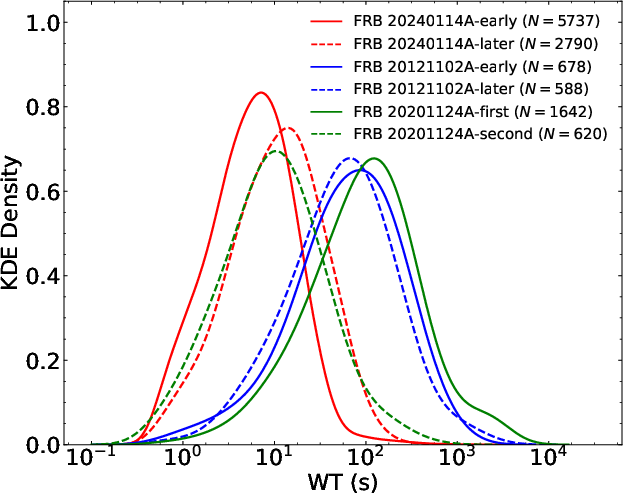
Figure 5: KDE of waiting times for FRB 20240114A, 20121102A, 20201124A across different epochs. Note the contrasting long-wait median in the late epoch for FRB 20240114A.
Interpretation and Theoretical Implications
The pronounced transition in both energy and waiting time statistics of FRB 20240114A, with nearly invariant BPL indices within each segment, is interpreted as evidence for two physically distinct emitting regimes or burst types. The statistical bimodality and epochal partitioning are incompatible with a homogeneous Poissonian emission process from a static underlying engine. Instead, they suggest episodic changes in the emission mechanism, magnetospheric state, or engine conditions, consistent with, but not limited to, magnetar models involving transitions between different magnetospheric or ejecta environments.
The observed transition in energy break, shift in power-law index, and waiting time elongation are not universal among hyperactive repeaters, underscoring the source-dependent nature of the variability. This challenges the general applicability of single-population FRB emission models and suggests an inherent diversity in repeating FRB engines or circumburst medium.
Relation to Broader FRB Population
Comparative analyses with FRB 20121102A and FRB 20201124A reinforce that episodic variability is an emergent property of well-monitored hyperactive repeaters, but FRB 20240114A's specific pattern (activity suppression and high-energy burst deficit in the later phase) is nonuniversal. This, coupled with the documented PMN/Weibull waiting time behavior, argues strongly for population and temporal diversity in the FRB phenomenon.
Future Directions
Further study should focus on:
- High-sensitivity, high-cadence monitoring to resolve intra-epoch substructure and potential further transitions
- Polarimetric and spectral evolution to constrain physical model degeneracies
- Cross-correlation with X-ray/gamma-ray observatories, especially in light of model analogies to magnetar flares
Real-time statistical monitoring is mandated to capture transition epochs and test stochastic versus deterministic duty cycle hypotheses.
Conclusion
This work provides a compelling statistical dissection of FRB 20240114A, establishing two distinct emission epochs with differing energy and temporal properties. The hard boundary at 21 March 2024, characterized by a steepening in energy index and elongation of waiting times, strongly supports a scenario wherein the emission region undergoes a discrete state change. These findings enhance constraints on FRB emission models and underscore the necessity of population-level, high-time-resolution observational campaigns for genuine physical insight.
(2607.01576)