Beyond Pixel Overlap: A Framework for Decomposing Segmentation Evaluation Metrics
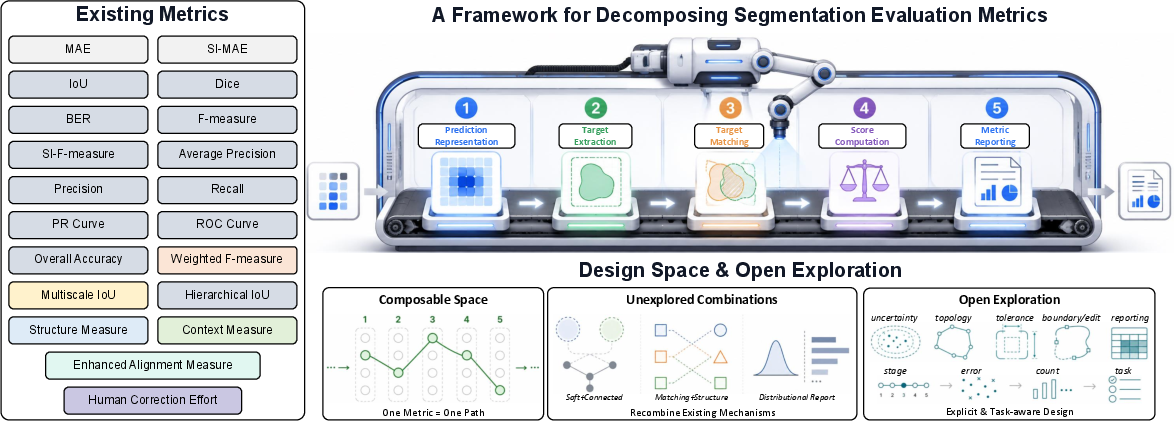
Abstract: Evaluation metrics are central to binary target segmentation because they determine how progress is measured, compared, and interpreted. In this paper, target denotes the task-defined positive region to be segmented rather than a generic foreground object. It may be salient, camouflaged, transparent, glass-like, mirror-like, shadow-like, lesion-like, or defined by other application-specific semantics. We treat existing metrics as compositions of modular design choices rather than isolated formulas. The proposed framework decomposes each metric into five stages covering prediction representation, target extraction, target matching, score computation, and metric reporting. We use this framework to analyze representative metrics and show how newer metrics address specific limits in earlier protocols. The stage choices keep each metric's assumptions visible. We then discuss the design space opened by the framework and its implications for task-aware evaluation protocols. Reference code is available at https://github.com/lartpang/PySODMetrics.



Paper Prompts
Sign up for free to create and run prompts on this paper using GPT-5.
Top Community Prompts
Explain it Like I'm 14
Overview
This paper is about how we judge the quality of computer programs that “color in” the important parts of a picture. This job is called binary target segmentation: for each pixel, the model says “target” (yes) or “not target” (no). It shows up in many areas, like finding hidden animals, glass, shadows, mirrors, tumors in medical images, and more.
The authors argue that the way we measure success (the “metric”) really matters. Instead of treating each metric as a mysterious formula, they break every metric into the same five simple steps. This makes it clearer what each metric is really checking, why two metrics might disagree, and how to design better, fairer tests in the future.
What are the paper’s main questions?
In everyday words, the paper asks:
- How can we organize the many different scoring rules people use to judge segmentation?
- What hidden choices are inside those scores (like thresholds and matching rules), and how do those choices change the results?
- How do newer metrics fix limits in older ones (like ignoring shape, edges, or fairness across big and small objects)?
- How can we report results so others can fairly compare methods?
- How can we make it easier to invent new, task-aware metrics?
How did the researchers study it?
They looked at popular segmentation metrics and showed that each one is built from the same five-stage pipeline. You can think of it like following a recipe: different recipes may share many steps, but change the ingredients or the cooking method at one stage. Here are the five stages in simple terms.
The five stages explained
- Prediction representation
- What form of the model’s output do we use?
- Soft map: a gray image where 0 means “surely background” and 1 means “surely target” (in-between values are less sure).
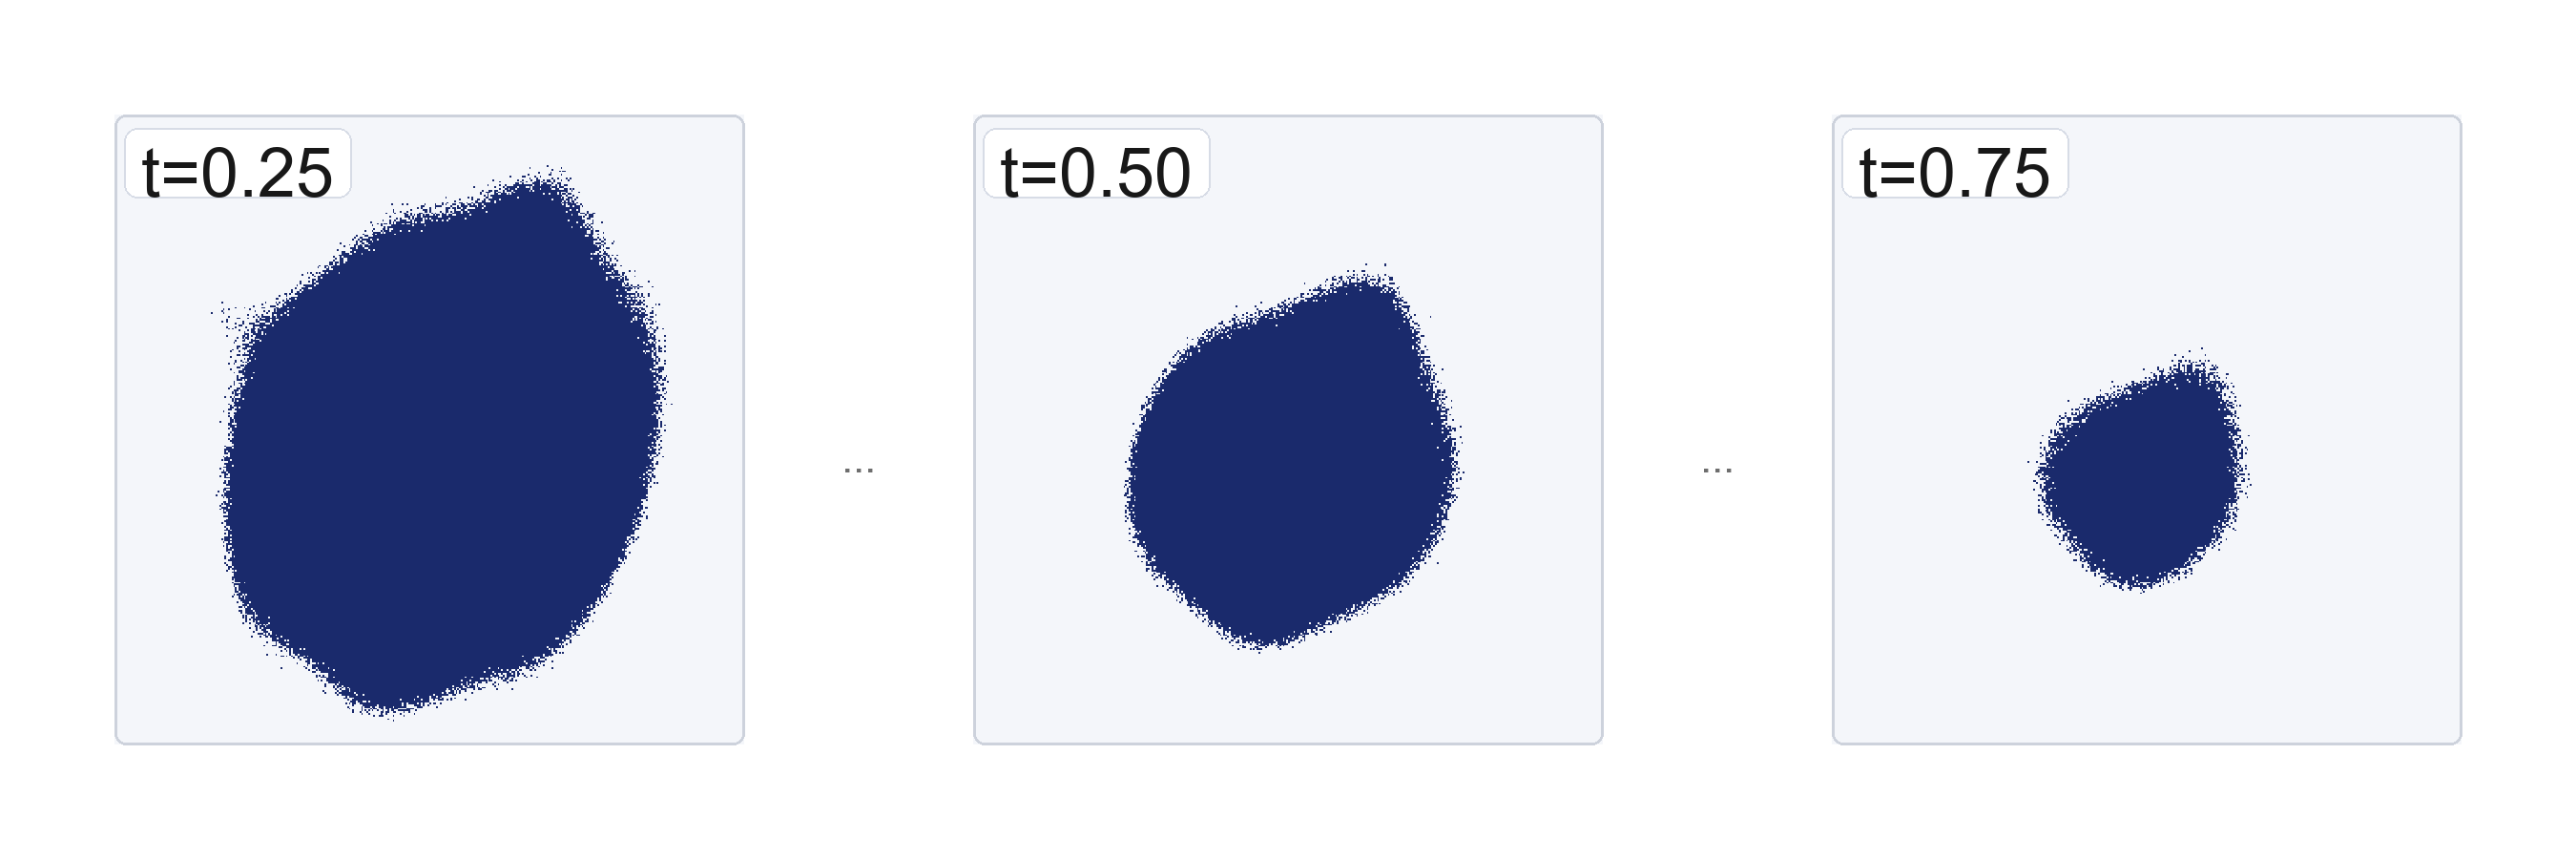
- Fixed threshold: turn the gray map into black-and-white with one chosen cutoff (for example, above 0.5 = target).
- Adaptive threshold: choose the cutoff based on each image’s average prediction (adapts to the image).
- Dynamic sweep: try many cutoffs and see how performance changes across them.
- Target extraction
- What exactly are we evaluating?
- Whole map: treat the entire image as one big region.
- Separate components: split the target into individual objects/parts and evaluate each.
- Region vs edge vs skeleton: look at filled-in shapes (region), just the outline (edge), or the “stick figure” centerline (skeleton).
- Target matching
- How do we pair the prediction with the ground truth (the correct answer)?
- Pixelwise: compare at the same pixel positions.
- Threshold-based pairing: only pair predicted and true objects if they overlap enough.
- Global matching: find the best one-to-one pairing between predicted and true objects (like assigning partners for a dance, so pairings don’t clash).
- Score computation
- How do we turn the comparison into a number?
- Pixel error: average difference (like “how far off are the shades of gray?”).
- Confusion counts: tally correct/incorrect pixels (TP, FP, TN, FN) to make scores like IoU, Dice, F-score, accuracy, or balanced error.
- Importance weighting: count some errors more than others (e.g., boundary mistakes matter more).
- Structure similarity: reward predictions that keep the object’s shape and layout.
- Enhanced alignment: check how local agreement lines up with the overall pattern.
- Multiscale AUC: focus on edges across different zoom levels.
- Correction effort: estimate “how many human fixes (clicks/edits) would this mask need?”
- Context relevance: give more credit for correctly finding targets that blend into their background (harder cases).
- Metric reporting
- How do we present the result?
- A single number (scalar).
- A curve across thresholds (like a Precision–Recall or ROC curve).
- The average, best value, or area under the curve (AUC) across thresholds.
What did they find, and why is it important?
Here are the main takeaways:
- Many metrics share the same steps. Two metrics can look very different on paper but actually differ only in one or two stages (for example, they use the same counts but report them differently).
- Tiny protocol choices matter. Things like which threshold you pick, how you handle empty masks, or whether you split targets into pieces can change results a lot.
- Older “pixel overlap” scores can miss important qualities:
- Shape and structure: A mask might overlap well but break the object into messy chunks.
- Edges and fine details: Thin boundaries can be ignored by area-based scores.
- Fairness across sizes: Big objects can drown out small ones when averaging.
- Human effort: Two masks with similar overlap can take very different time to fix.
- Context difficulty: Finding a camouflaged object deserves more credit than finding an obvious one.
- Newer metrics tackle these gaps:
- Size-invariant variants balance influence across objects of different sizes.
- Hierarchical IoU (hIoU) matches predicted and true objects before scoring, which helps with tiny or multiple targets.
- Multiscale edge metrics (like MSIoU) focus on edges and fine structures.
- Human Correction Effort (HCE) estimates how much manual editing is needed.
- Context Measure (Cm) gives more credit for hard, camouflaged regions.
- Metrics are protocols, not just formulas. To compare fairly, papers should clearly state the choices made at each stage (thresholds, matching rules, reporting, and so on).
What could this change or impact?
This framework can:
- Make comparisons fairer: If everyone reports the same stage choices, it’s easier to trust result tables.
- Help choose the right metric: Pick a metric that matches what you care about (shape? edges? fairness across sizes? low human-edit effort?).
- Encourage better reporting: Authors can include a simple “metrics checklist” so others can reproduce results.
- Spark better metrics: By mixing and matching stages (e.g., edges + global matching + correction cost), researchers can design task-aware metrics without reinventing everything.
- Improve real-world performance: Evaluations that value the right qualities (like small lesions in medicine or thin edges in robotics) can guide models to be better where it counts.
If you remember one thing: A segmentation score isn’t just a number. It’s the result of five clear steps. Knowing those steps helps you understand what the number truly means—and whether it matches the goal you care about.
Knowledge Gaps
Knowledge gaps, limitations, and open questions
Below is a concise list of unresolved issues that future work could concretely address.
- Lack of empirical validation: No experiments quantify how different stage choices (especially Stage 1, 2, and 5) alter method rankings across datasets and tasks; a systematic ablation is needed to show practical impact and stability of the framework.
- Correlation with human judgment: The paper does not measure how various metrics (and stage configurations) align with human perception or human correction effort across tasks; user studies and annotation-time measurements are missing.
- Statistical rigor in reporting: No guidance on confidence intervals, statistical tests, or variance estimates for metric comparisons; bootstrap protocols and significance testing are not specified.
- Dataset-level aggregation: The framework does not standardize macro vs micro averaging, per-image weighting, or pixel-weighted aggregation across images/datasets; this can change rankings and remains unspecified.
- Empty-target and degenerate cases: Although acknowledged, standardized rules (with formulas) for images with no positives, all positives, or all-negative predictions are not fixed and may vary across implementations.
- Threshold protocol standardization: Dynamic-sweep details (number/spacing of thresholds), interpolation for PR/AP and ROC-AUC (e.g., 11-pt vs integral AP), and tie-breaking conventions are not prescribed, impeding comparability.
- Hyperparameter sensitivity: No analysis of sensitivity to stage-specific hyperparameters (e.g., size thresholds for components, skeletonization and edge-extraction settings, relaxation in HCE, scales for MSIoU, context kernels in Cm).
- Computational cost and scalability: The framework does not quantify runtime/memory overhead for different stage choices (e.g., instance matching, multiscale edges, skeleton-based costs) or provide efficiency guidelines for large-scale evaluation.
- Ground-truth noise and ambiguity: Handling of annotation noise, boundary uncertainty, weak/partial labels, or soft GT is not addressed; tolerance bands and robust scoring under uncertain annotations are missing.
- Proper scoring rules for segmentation: The paper does not connect soft-map evaluation to proper scoring rules (e.g., Brier score, log loss) adapted for spatial predictions, leaving calibration assessment underexplored.
- Calibration vs ranking: The trade-off between ranking robustness (dynamic thresholds) and probability calibration (soft evaluation) is not analyzed; no diagnostics quantify when one should prefer soft vs hard protocols.
- Topology-aware metrics: While suggested as future directions, concrete topology-preserving scores (e.g., Betti numbers, persistent homology, hole/branch preservation penalties) are not instantiated or evaluated.
- Boundary-accuracy measures: Beyond MSIoU edges, the framework lacks standardized boundary-tolerant metrics (e.g., boundary F-score with tolerance, Chamfer/HD variants) and their placement within the stages.
- Cross-dataset comparability: No normalization strategy ensures fair comparison across datasets with different target-size distributions, context difficulty, or prevalence; size-invariant variants are discussed but not generalized to other biases.
- Task-to-metric guidance: The framework stops short of a decision guide mapping task characteristics (e.g., small targets, thin structures, contextual ambiguity) to recommended stage choices and metrics.
- Multi-object/instance segmentation: The treatment is binary target–centric; extensions to instance or panoptic settings (many-to-one/one-to-many matching, multi-target scoring, PQ-like analogs) are not formalized within the framework.
- Temporal/video segmentation: Spatiotemporal matching (Stage 3) and temporal consistency scores (Stage 4) are not developed for video or sequential settings.
- Uncertainty-aware evaluation: Stage 1 mentions potential uncertainty-aware representations, but no concrete metrics incorporate predictive uncertainty (e.g., via ensembles or variance maps) into scoring or reporting.
- Adversarial/degenerate behaviors: No analysis of metric gaming risks (e.g., outputs that exploit a metric’s blind spots) or safeguards (e.g., multi-metric checks, failure-mode diagnostics).
- Stage interdependencies: The framework treats stages modularly but does not study non-commutative effects (e.g., thresholding before edge extraction vs after) or interactions that can invert rankings.
- Implementation variability: Differences in connected-component labeling, skeletonization, interpolation, and resizing across libraries are not standardized; this can lead to reproducibility gaps despite identical formulae.
- Context metrics generality: Contextual relevance (Cm) is motivated by COD but lacks validation and adaptation recipes for other domains (e.g., medical, remote sensing) with different context semantics.
- HCE generality and validation: Human Correction Effort is defined via specific skeleton and relaxation choices; its validity across tasks, editors, and tools, and its sensitivity to these choices, is not empirically assessed.
- Reporting richness: Stage 5 focuses on scalar/curve summaries; stratified reporting (by target size, boundary complexity, texture contrast, or difficulty bins) is proposed conceptually but not standardized.
- Composite/multi-objective evaluation: No principled approach is offered to combine complementary metrics (e.g., overlap, boundary, effort, context) or to report Pareto fronts/aggregated scores with interpretable weights.
- Training–evaluation alignment: The framework does not discuss differentiable surrogates or how stage choices relate to loss functions used in training, potentially causing misalignment between optimization and evaluation.
- Domain shift and prevalence shift: Effects of dataset/domain shifts on threshold policies, calibration, and context-aware scoring are not explored, nor are adaptation strategies for consistent evaluation across domains.
- Code-level specification gaps: The referenced code is mentioned but the paper does not specify versioning, parameter defaults, or exact protocol presets required for strict reproducibility across studies.
Practical Applications
Immediate Applications
Below are concrete ways the paper’s five-stage framework and metric analysis can be used right now across sectors. Each item includes sectors, what to implement, and key dependencies.
- Industry ML/Software (MLOps) — Standardize segmentation evaluation via “metric protocol manifests”
- What: Define and enforce S1–S5 choices (prediction representation, target extraction, matching, scoring, reporting) in a project-wide YAML/JSON manifest. Use it to drive evaluation scripts, CI, and model cards.
- Tools/Workflows: Integrate PySODMetrics into CI; add a “Metric Protocol” section to model cards; export PR/ROC/AP/threshold curves alongside scalar summaries; log per-stage artifacts to MLflow/W&B.
- Assumptions/Dependencies: Access to soft prediction maps (not just binarized masks); agreement on connected-component and edge/skeleton routines; buy-in to update existing pipelines.
- Benchmarking and Academic Reporting — Adopt the paper’s checklist for reproducible metrics
- What: Require authors/benchmarks to report S1–S5 decisions (e.g., threshold rules, tiebreakers, empty-case handling, component definitions) and provide raw curves plus scalar summaries.
- Tools/Workflows: Publish a repository-level “evaluation protocol” file; host re-evaluation scripts using PySODMetrics; archive prediction maps for re-scoring.
- Assumptions/Dependencies: Dataset maintainers willing to host prediction artifacts; consistent definitions across papers; minor overhead in paper templates.
- Healthcare (Medical Imaging) — Task-aware metric selection and human-effort estimates
- What: Use size-invariant metrics (e.g., SI-MAE, size-invariant Fβ) for lesion-heavy workloads; adopt HCE (Human Correction Effort) to estimate radiologist editing time; report boundary/edge fidelity (MSIoU) when margins are clinically meaningful.
- Tools/Workflows: Decision matrix mapping clinical priority (e.g., sensitivity vs margin accuracy) to S4 scoring choice; threshold-sweep reports (PR/AP) for operating point selection; annotation tooling dashboards with HCE per case.
- Assumptions/Dependencies: Ground-truth quality (consistent lesion delineation); access to soft logits/probabilities; validation of HCE calibration against real editing workflows.
- Robotics/Autonomous Driving — Edge- and threshold-robust evaluation for safety-critical segmentation
- What: Use MSIoU for thin structures (lane markings, wires); adopt dynamic threshold sweeps with PR/ROC and operating-point selection rules; consider hierarchical IoU (hIoU) for small/fragmented objects.
- Tools/Workflows: Safety dashboards that report threshold curves and chosen operating points; regression tests that flag boundary regressions even when IoU is stable.
- Assumptions/Dependencies: Availability of high-resolution edge-ground-truth or robust edge extraction from masks; consistent per-image threshold policy; synchronized sensor GT timestamps.
- Remote Sensing/Defense (IRSTD, small targets) — Instance-aware matching and size fairness
- What: Use hIoU with target matching to evaluate fragmented/merged detections; adopt size-invariant metrics to avoid dominance by large backgrounds; report AUC/PR curves for varying signal-to-noise.
- Tools/Workflows: Component parsing on prediction and GT, Hungarian/OPDC matching; per-target score summaries (not just image averages).
- Assumptions/Dependencies: Accurate small-target GT; agreed matching thresholds; stable centroid/overlap computations at low SNR.
- Manufacturing/Quality Control (Transparency/Glass/Reflective) — Context-aware evaluation
- What: Apply Context Measure (Cm) to weight performance by visual embedding difficulty (useful for transparent/mirror objects, shadows); complement with boundary-sensitive metrics where cut/seal accuracy matters.
- Tools/Workflows: Compute camouflage degree per image to modulate scoring; include structure-aware metrics (S-measure) in acceptance criteria.
- Assumptions/Dependencies: Reliable context features or camouflage estimation; GT consistent in ambiguous boundaries; access to soft maps.
- Data Annotation and Labeling Ops — Predict correction cost and triage work
- What: Use HCE to estimate per-image correction time; prioritize high-HCE images for expert annotators or upstream model retraining; forecast labeling budgets.
- Tools/Workflows: Integrate HCE into annotation platforms; route tasks based on predicted effort; build QA thresholds on HCE and boundary errors.
- Assumptions/Dependencies: Calibrated HCE parameters for the specific tool/editing primitives; consistent skeletonization for GT; empirical validation against actual labor.
- Product Analytics and Model Monitoring — Stage-aware diagnostics to speed debugging
- What: Build dashboards that separate failure sources by stage (e.g., calibration/threshold sensitivity in S1 vs boundary errors in S4 vs broken matching in S3); track drift with complementary metrics (IoU + MSIoU + S-measure + AP).
- Tools/Workflows: Alerting when “best-case” Fβ deviates from “mean” Fβ (threshold robustness); store raw curves, not just scalars.
- Assumptions/Dependencies: Telemetry for predictions and GT over time; consistent pipeline for curve computation; storage for raw evaluation artifacts.
- Education and Training — Curricula and labs to demystify metric choices
- What: Teach metric bias and protocol effects by toggling S1–S5 and observing ranking changes across the same predictions.
- Tools/Workflows: Course notebooks using PySODMetrics; assignments on designing task-aware metrics for given applications.
- Assumptions/Dependencies: Access to datasets with GT; compute resources for class labs.
Long-Term Applications
These opportunities require additional research, tooling, or standardization before broad deployment.
- Standards and Policy — Protocolized metrics in regulations and procurement
- What: Codify S1–S5 “metric protocol manifests” in standards (e.g., ISO/IEC AI evaluation) and require them in regulatory submissions (e.g., medical devices) and public procurements.
- Potential Outcomes: Comparable claims across vendors; audit-ready evaluation trails; fairness clauses (e.g., size-stratified reports using size-invariant variants).
- Dependencies: Standards committee adoption; consensus on default conventions (e.g., > vs ≥, empty-case rules); public exemplars.
- AutoML/Evaluation-as-a-Service — Automatic metric selection and multi-objective tuning
- What: Build meta-optimizers that select or compose metrics (via S2/S3/S4 choices) from end-user requirements (e.g., minimize HCE subject to IoU ≥ K).
- Potential Products: “Metric designers” that output protocol manifests; AutoML systems optimizing thresholds per segment size or context.
- Dependencies: Large evaluation corpora linking metric choices to downstream costs; APIs to PySODMetrics-like engines; acceptance of non-single-number leaderboards.
- New Metric Families — Topology-, uncertainty-, and time-aware metrics by recombining stages
- What: Extend Stage 1 with uncertainty quantification; Stage 2 with topology units (holes, branches) or part regions; Stage 3 with temporal/track-aware matching for video; Stage 4 with topology-preservation or displacement costs.
- Potential Outcomes: Better evaluation for surgical planning, AR occlusion handling, video segmentation, and thin-structure preservation.
- Dependencies: Robust topology GT; uncertainty-calibrated models; efficient temporal matching algorithms; community baselines.
- Human-in-the-Loop Optimization — Closed-loop cost minimization using HCE
- What: Use HCE (and future effort models) online to decide when to defer to humans, which samples to prioritize, and how to set thresholds to minimize aggregate correction effort.
- Potential Products: Smart routing in labeling/QA platforms; adaptive UIs that suggest least-cost edits first.
- Dependencies: Continuous measurement of real editing behavior; privacy-compliant logging; reliable mapping from metric costs to actual effort.
- Context-Adaptive Deployment — Per-image thresholding and scoring policies
- What: Deploy dynamic S1 policies (adaptive thresholds) informed by image context (e.g., camouflage degree) to optimize for operating constraints (precision-first vs recall-first).
- Potential Outcomes: Reduced false positives in brittle contexts; safer autonomy via context-sensitive operating points.
- Dependencies: Accurate context estimators; calibration monitoring; governance for adaptive behavior.
- Cross-Domain and 3D/Multiclass Extensions — Generalize the framework beyond binary 2D
- What: Apply S2/S3 to per-class instances (instance segmentation) and to 3D volumetric masks with topology-aware scoring; harmonize multi-label reports in S5.
- Potential Outcomes: Consistent evaluation across radiology volumes, point clouds, AR scene understanding.
- Dependencies: High-quality 3D GT; scalable component and skeleton extraction in 3D; community-agreed instance matching.
- Safety and Operations Dashboards — Stage-aware metrics as operational risk signals
- What: Use threshold robustness gaps (max vs mean Fβ) and boundary scores (MSIoU) as live risk indicators in robots/vehicles; trigger safe modes when metrics deteriorate.
- Potential Outcomes: Early detection of distribution shift affecting critical boundaries; explainable triggers for incident review.
- Dependencies: Low-latency metric computation; robust GT proxies or weak labels in production; well-tuned alert thresholds.
- Annotation Marketplaces and Pricing — Effort-based costing
- What: Price tasks and SLAs using predicted HCE and complexity stratification; route to specialized labelers based on expected effort.
- Potential Outcomes: More accurate budgeting; better workforce utilization; transparent billing models.
- Dependencies: Market acceptance; calibrated HCE-to-time conversions; integration with marketplace APIs.
- Foundation Model Evaluation — Unified, task-aware segmentation metrics at scale
- What: Evaluate segmentation heads of multimodal foundation models using stage-aware, context-weighted, and size-invariant metrics at dataset scale with stratified S5 reporting.
- Potential Outcomes: More meaningful comparisons across domains; better alignment with downstream tasks.
- Dependencies: Access to raw logits; scalable evaluation infra; cross-domain GT curation.
- Metric Protocol Registries and DOIs — Citable, immutable evaluation definitions
- What: Publish protocol manifests with DOIs; require citation in papers/benchmarks so results are exactly reproducible.
- Potential Outcomes: Reduced re-scoring disputes; long-term comparability; easier meta-analyses.
- Dependencies: Hosting infrastructure; publisher/conference policies; community uptake.
Notes on Feasibility and Dependencies Across Applications
- Core dependency: availability of soft prediction maps P and binary ground-truth masks G; many benefits (calibration, threshold sweeps, weighted metrics) require soft maps.
- Assumptions to validate per domain: GT consistency (especially boundaries/topology), relevance of boundary vs area vs instance matching, and alignment of HCE or context weights with real-world costs/difficulties.
- Tooling: PySODMetrics provides an immediate codebase; extensions may be needed for 3D, video, or domain-specific targets.
- Organizational buy-in: The benefits rely on teams agreeing to protocolize evaluation and report S1–S5 explicitly.
Glossary
- Adaptive threshold: An image-specific decision threshold computed from the prediction map, often based on its mean, used to binarize predictions. "The adaptive-threshold branch uses $t_{\mathrm{adp}=\min\{2\bar P,1\}$, where is the mean prediction value."
- Area Under the Curve (AUC): A scalar summarizing the performance across all thresholds for a curve (e.g., ROC or PR), representing integrated behavior. "\gls{MSIoU} uses multiscale \gls{AUC} to integrate statistics that vary across scale changes."
- Average Precision (AP): The area under the precision-recall curve that summarizes precision-recall trade-offs over thresholds. "Common curve reports include the precision-recall (PR) curve, the \gls{ROC} curve, and \gls{AP} as a scalar summary of the PR curve."
- Balanced Accuracy (BA): An accuracy measure that averages true positive rate and true negative rate to reduce class imbalance effects. "while \gls{Fbeta}, \gls{IoU}, Dice, \gls{BA}, and \gls{BER} summarize different views of thresholded confusion statistics."
- Balanced Error Rate (BER): The average of class-wise error rates, weighting target and background errors equally. "\gls{BER} corrects this class-prior effect by averaging target-side and background-side error rates, so predicting almost everything as background no longer gives a good score."
- Camouflaged Object Detection (COD): A segmentation task focusing on targets that are visually concealed within their surroundings. "addresses the \gls{COD} setting~\cite{Survey-COD,ConcealedObjectDetection,COD10K}, where difficulty depends on how the target is embedded in its visual context."
- Centroid distance: The distance between object centroids, often used as a cost for matching predicted and ground-truth instances. "solving a one-to-one assignment with centroid distance as the cost"
- Confusion matrix: Counts of TP, FP, TN, and FN used to derive overlap, accuracy, and related metrics. "and confusion matrix, used to derive overlap, accuracy-like, balance-oriented, or agreement-corrected scores from target-background agreement and disagreement statistics."
- Connected components: Disjoint foreground regions identified in a binary mask, often used as separated targets. "They parse connected components from the \gls{GT} mask, retain components above a minimum-area rule"
- Contextual relevance: A scoring mechanism that weights correctness by context-informed importance and completeness. "\gls{Cm} uses contextual relevance to combine forward prediction relevance and reverse \gls{GT} completeness under a context kernel"
- Correction effort: An estimate of the manual operations needed to fix segmentation errors. "\gls{HCE} uses correction effort to estimate the manual operations needed to repair a mask."
- Dice coefficient: An overlap-based similarity metric between predicted and ground-truth regions, closely related to IoU. "When computed from the same hard partition, Dice is an increasing transform of \gls{IoU}"
- Dichotomous Image Segmentation (DIS): A family of segmentation tasks/benchmarks focused on binary delineation of targets. "including \gls{DIS}~\cite{HumanCorrectionEffortMeasure,DIS-BiRefNet,BASNet,DIS-MVANet}"
- Dynamic threshold sweep: Evaluating performance across a range of thresholds by binarizing predictions at each threshold. "The dynamic branch evaluates a threshold-indexed sequence "
- Enhanced Alignment Measure (E_m): A metric assessing alignment of local agreements with global target layout after mean centering. "\gls{Em} uses enhanced alignment to transform local agreement with image-level statistics."
- Glass Detection (GD): A segmentation task dealing with identifying glass-like regions. " \gls{GD}~\cite{GlassDetection}"
- Ground Truth (GT): The reference binary mask used for evaluation. "this prediction is compared with a binary \gls{GT} mask."
- Hierarchical IoU (hIoU): An IoU variant that matches predicted and ground-truth components before computing overlap. "\gls{hIoU}~\cite{HierarchicalIoU} also uses separated region targets, but it parses connected components on both the thresholded prediction and the \gls{GT}"
- Hungarian matching: An optimization algorithm for one-to-one assignment, used for matching predicted and ground-truth instances. "Hungarian matching is a common one-to-one instance of this formulation."
- Human Correction Effort (HCE): A metric estimating how much manual editing is needed to correct a segmentation mask. "\gls{HCE}~\cite{HumanCorrectionEffortMeasure} uses correction effort to estimate the manual operations needed to repair a mask."
- Infrared Small Target Detection (IRSTD): A task focusing on detecting very small targets in infrared imagery. "such as \gls{IRSTD}~\cite{IRSTDSurvey}"
- Intersection-over-Union (IoU): The ratio of the intersection to the union of predicted and ground-truth regions, measuring overlap. "\gls{IoU} and Dice emphasize target overlap"
- Mean Absolute Error (MAE): The average absolute difference between predicted probabilities and ground-truth labels. "\Gls{MAE} follows this path as shown in \cref{tab:stage_metric_mapping}. It measures average soft disagreement without choosing a threshold."
- Medical Lesion Segmentation (MLS): Segmentation tasks aimed at delineating lesions in medical images. "including \gls{MLS}~\cite{PraNet,MSNet,M2SNet}"
- Mirror Detection (MD): A segmentation task that identifies mirror-like regions. " \gls{MD}~\cite{MirrorDetection}"
- Multiscale IoU (MSIoU): An edge-focused, multiscale evaluation of overlap emphasizing fine structures. "\gls{MSIoU}~\cite{MSIoU} adopts the whole-map edge setting and still treats the sample as one target instance, but changes the target type from region maps to whole-map Sobel edge maps before multiscale shrinking."
- OPDC strategy: A target matching procedure combining overlap qualification and distance-constrained compensation. "The OPDC strategy used by \gls{hIoU}~\cite{HierarchicalIoU} follows this target-level view"
- Precision-Recall (PR) curve: A curve showing precision versus recall across thresholds. "Common curve reports include the precision-recall (PR) curve"
- Receiver Operating Characteristic (ROC) curve: A curve showing true positive rate versus false positive rate across thresholds. "Common curve reports include the precision-recall (PR) curve, the \gls{ROC} curve, and \gls{AP} as a scalar summary of the PR curve."
- Salient Object Detection (SOD): A segmentation task aimed at extracting visually prominent objects. "including \gls{SOD}~\cite{CMMSODSurvey,RGBDSODSurveyZhou,DUTS,DUT-OMRON,MINet,PoolNet,GateNet,HDFNet,DANet,SOD-S3OD}"
- Shadow Detection (SD): A segmentation task focused on identifying shadow regions. " \gls{SD}~\cite{SurveyShadowDetection,CDConceptSeg-Spider}"
- Size-Invariant Mean Absolute Error (SI-MAE): A MAE variant computed within target-aware regions to reduce size bias. "\gls{SIMAE} reuses pixel error, and size-invariant \gls{Fbeta} reuses confusion-matrix scoring"
- Skeletonization: A morphological operation that reduces foreground regions to their medial axes. "skeletonization, and aggregation over images or datasets can all change reported scores."
- Sobel edge maps: Edge maps computed with the Sobel operator, used as targets for edge-focused evaluation. "but changes the target type from region maps to whole-map Sobel edge maps before multiscale shrinking."
- Structural Similarity Index (SSIM): A perceptual similarity measure comparing structural information between images. "and aggregates block-wise structural similarities~\cite{SSIM}."
- Structure Measure (Sm): A metric that evaluates object- and region-level structural agreement between prediction and ground truth. "\gls{Sm}~\cite{Smeasure} uses structural similarity to evaluate object-level and region-level structural agreement."
- Transparent Object Segmentation (TOS): A segmentation task that targets transparent objects. "including \gls{TOS}~\cite{TransparentObjectSegmentation}"
- Weighted F-measure: An F-measure variant that weights errors spatially to reflect their perceptual importance. "Weighted \gls{Fbeta}~\cite{wFmeasure} uses importance weighting by constructing a weighted error map and then deriving weighted precision and recall."
Collections
Sign up for free to add this paper to one or more collections.

