- The paper introduces an analytic gradient of the WS upper bound that reduces both the largest Hessian eigenvalue and its spectral spread.
- It provides closed-form derivations for Hessian trace and trace-square in three-layer NNs using cross-entropy loss, ensuring computational efficiency and precision.
- The proposed HSR regularization narrows the loss Hessian eigenspectrum, leading to smoother decision boundaries and enhanced generalization performance.
Introduction and Motivation
This work addresses the theoretical foundations of the flatness hypothesis in neural network (NN) optimization, which posits that flatter minima in the loss landscape correlate with improved generalization. Flatness is commonly quantified via the Hessian eigenspectrum, but methods that target the curvature specifically—such as Sharpness-Aware Minimization (SAM) and Hessian regularization—typically operate algorithmically or numerically, often without clear theoretical connections to network structure or data distribution. This study bridges this gap by analytically deriving a closed-form steepest descent direction—based on the Wolkowicz–Styan (WS) upper bound—aimed at reducing the upper bound of the Hessian’s largest eigenvalue for three-layer hierarchical feedforward NNs with cross-entropy (CE) loss.
Analytical Framework: WS Upper Bound and its Gradient
The analytic centerpiece is the WS upper bound, an explicit function of the mean and variance of the Hessian eigenspectrum, representing an upper bound on the largest eigenvalue. The closed-form expressions for key spectral quantities (trace and trace-square of the Hessian) previously obtained for the specific three-layer NN regime (Omae et al., 11 Apr 2026) serve as a foundation for further differentiation.
The key result is the analytic, parameter-space gradient of the WS upper bound. This steepest descent direction offers two effects: (1) a reduction in the mean eigenvalue (shifting the spectrum downward), and (2) a reduction in the standard deviation (narrowing the spectrum), thus driving both the top eigenvalue and the spectral spread toward values associated with flat minima. Notably, this enables explicit computation of directions in parameter space that induce flatness, rather than relying on implicit or numerically approximated criteria.
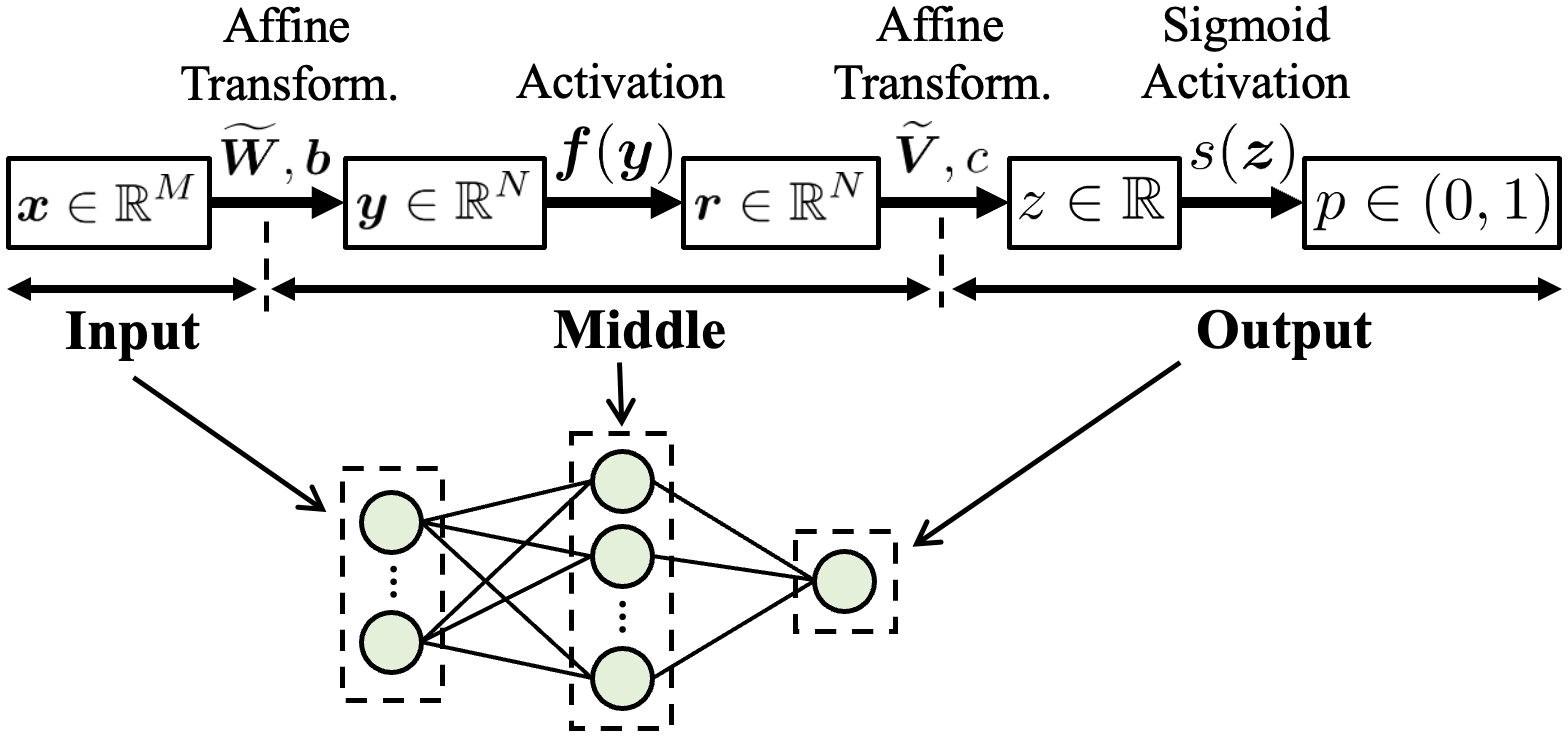
Figure 1: Three-layer hierarchical NN analyzed in this study.
Analytical Gradient Derivation and Properties
The gradients of both trace and trace-square of the loss Hessian are derived analytically with respect to network weights and biases, yielding closed-form directional information. The computation time of these analytic gradients was benchmarked against numerical differentiation. The analytical forms not only avoid the computational burden of repeated finite-difference estimation but also maintain tight agreement, with difference norms below 10−9 across test cases.
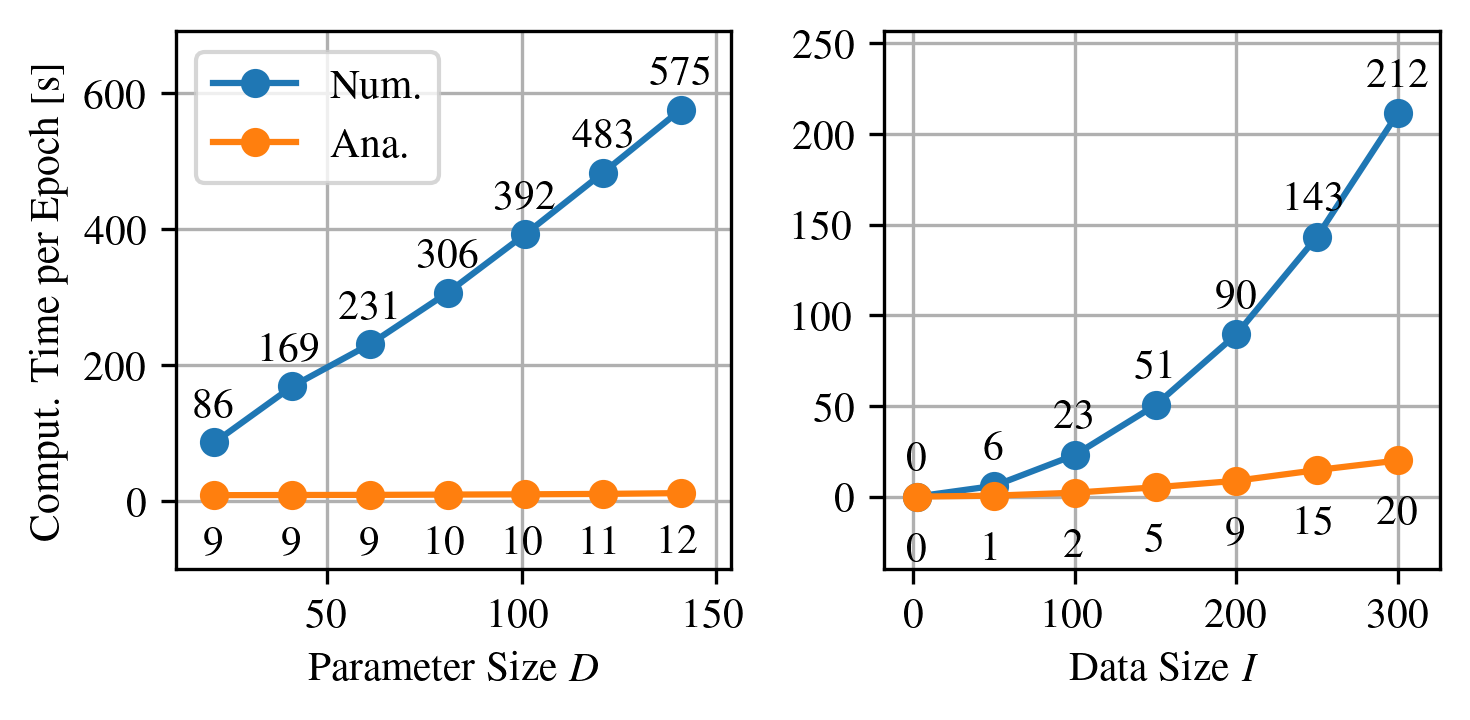
Figure 2: Computation time of λsup, showing significant efficiency of the analytical solution over numerical differentiation as model or data size grow.
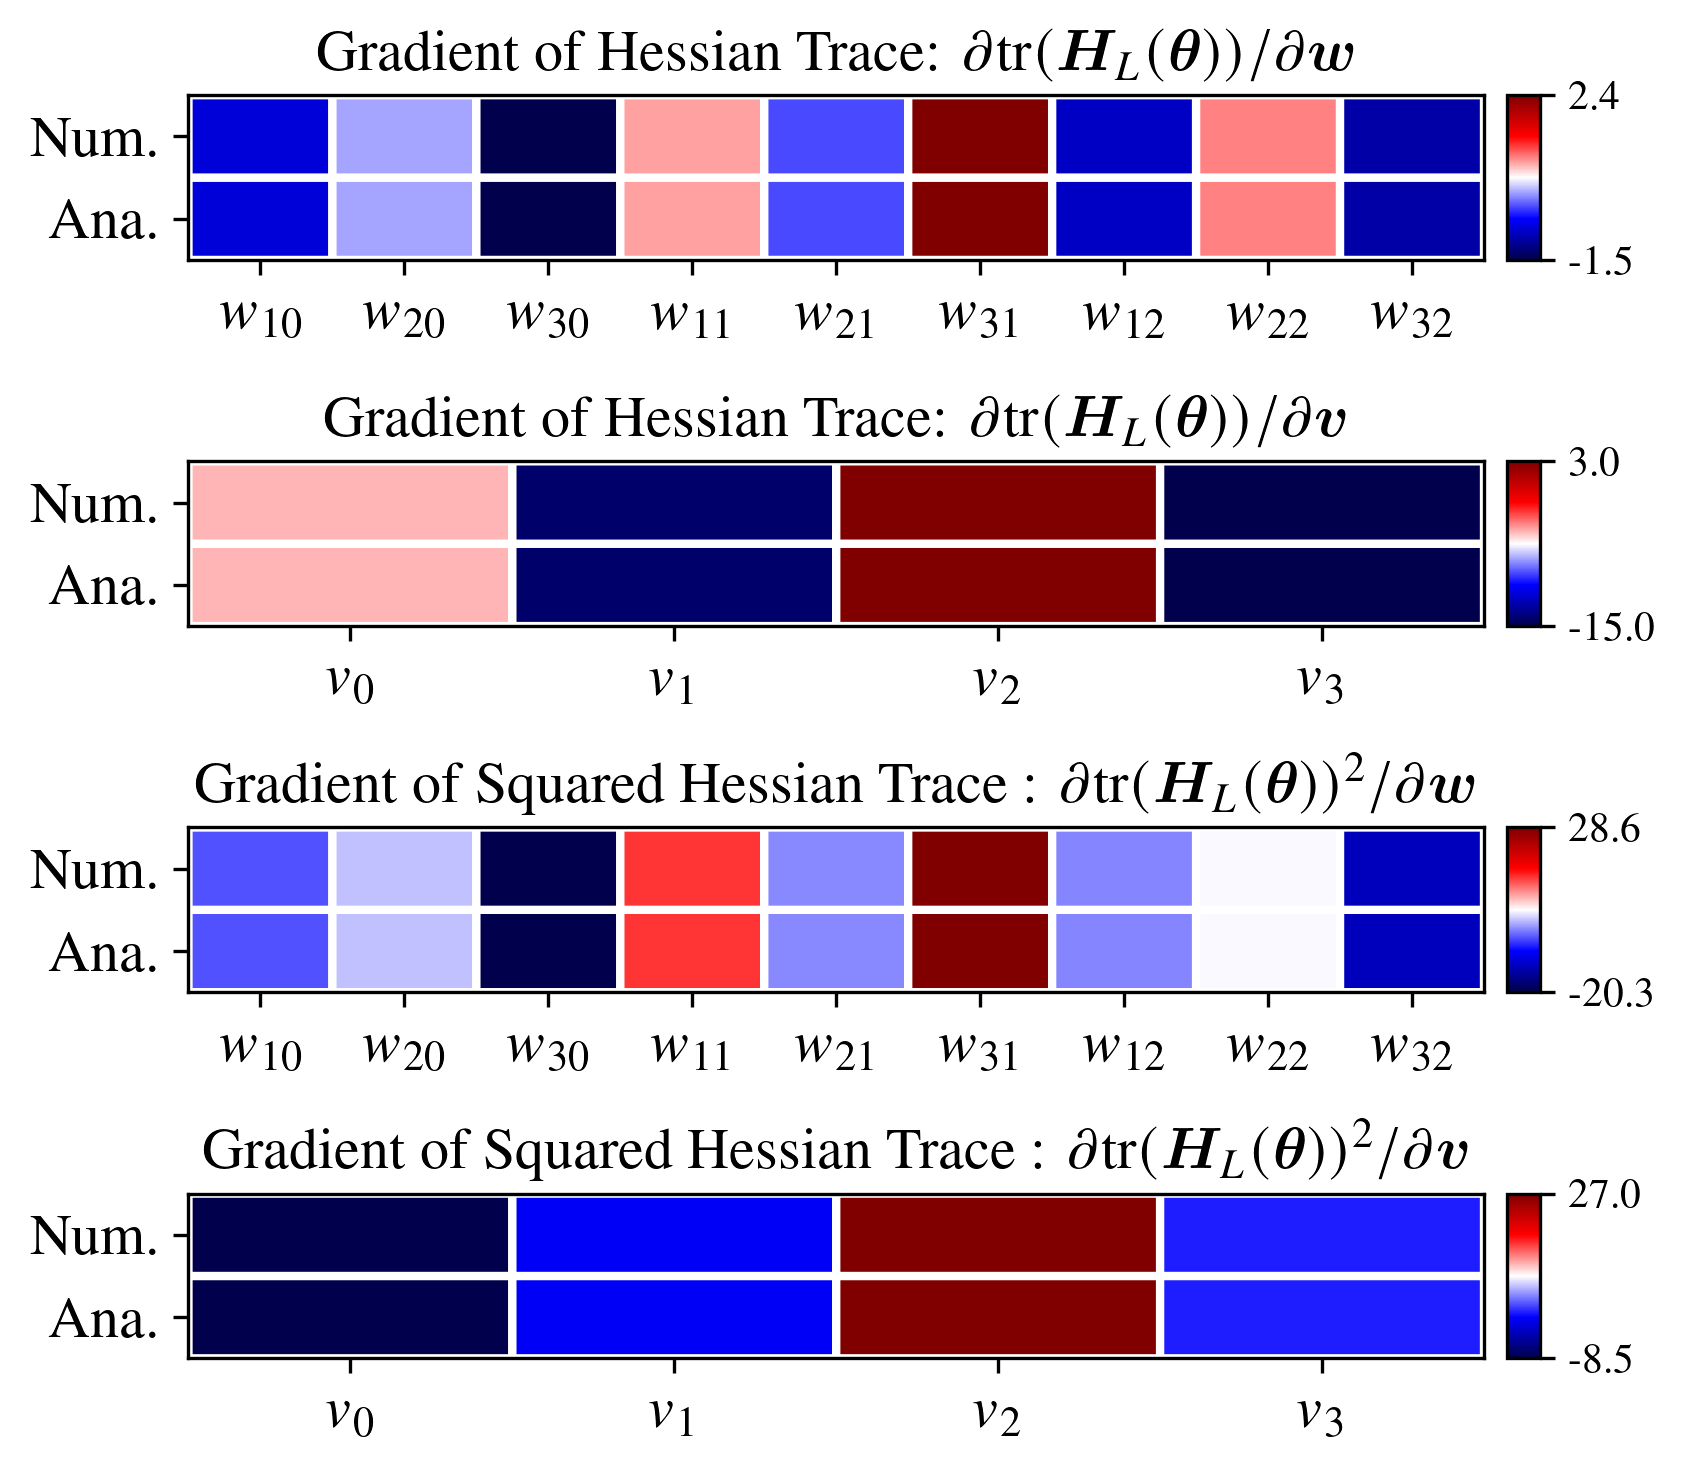
Figure 3: Comparison between numerical and analytical solutions for the gradients; both approaches are nearly indistinguishable, validating the correctness of the analytical derivation.
Crucially, the gradient norms for individual data points drop to zero as the NN’s predictive probability for those points converges to the ground-truth label, implying that well-modeled samples cease to influence the flat-minima-seeking regularization (as shown in Figure 4 below).
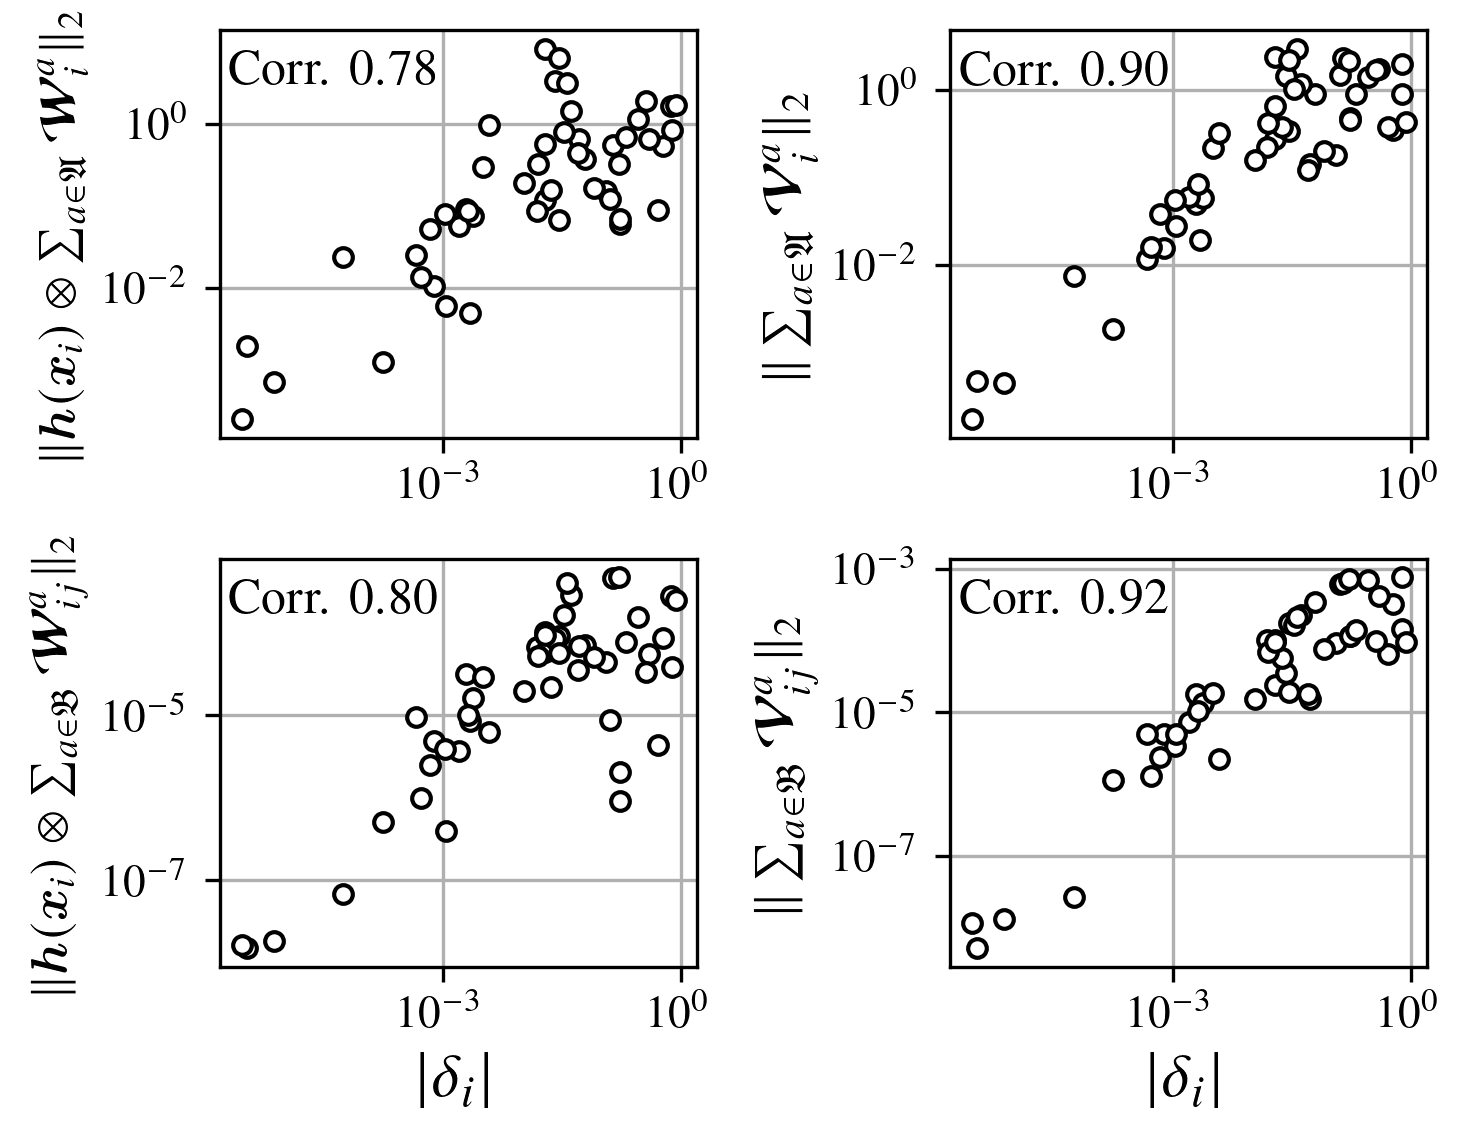
Figure 4: Relationship between ∣δi∣ (label prediction error) and gradient norms, confirming that correctly predicted data points exert negligible effect on the regularization direction.
Data Geometry Effects and Term Decomposition
The analysis reveals that the inner product similarity among training samples influences the scaling of the squared Hessian trace gradient; higher similarity magnifies the contribution to curvature regularization, a dependency that is dampened by non-linear activations such as sigmoid.
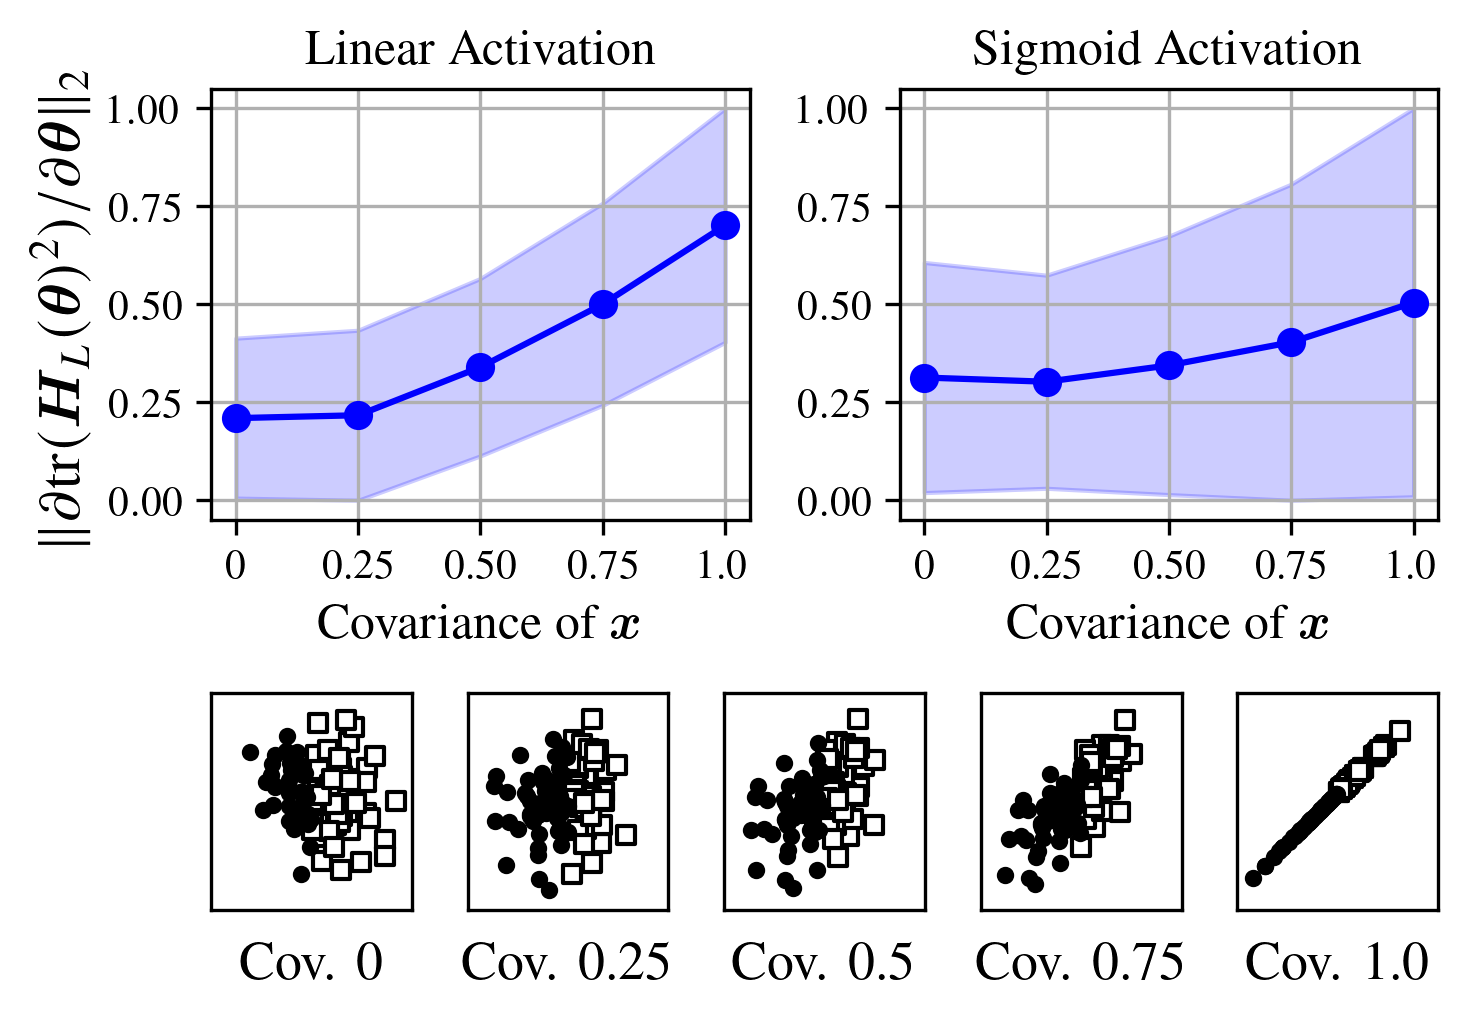
Figure 5: Relationship between input data covariance and the squared Hessian trace gradient; linear activations yield higher sensitivity to sample similarity than sigmoidal.
Decomposing the steepest descent direction clarifies that the standard deviation term dominates the mean term, especially as either model size or data quantity grows—empirically validated via randomized trials of NN instances.
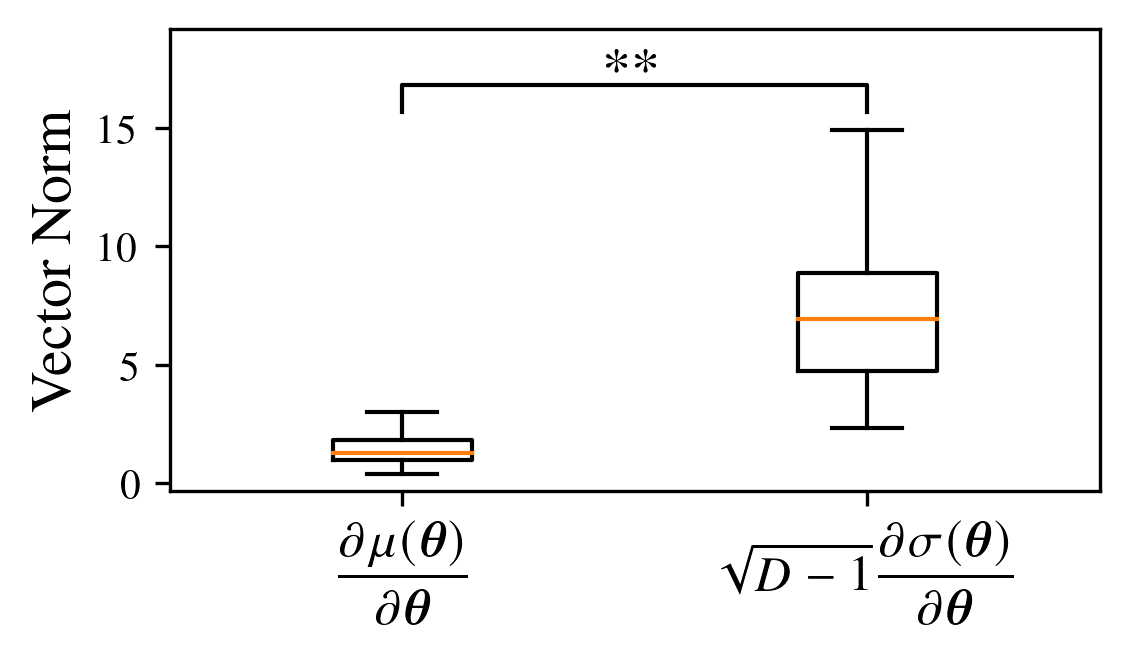
Figure 6: Comparison of gradient norms between the mean and the standard deviation terms, with the latter typically dominating the direction toward flat minima.
Practical Regularization: Hessian Spectral Range (HSR) Regularization
The theoretical machinery naturally extends to a practical parameter update rule based on a convex combination of the cross-entropy loss and the WS upper bound gradient, termed HSR regularization. Unlike conventional sharpness-minimization heuristics, this approach precisely targets spectral flatness by narrowing the eigenspectrum.
Experiments illustrate that exclusive reduction of the WS upper bound concurrently elevates the WS lower bound, effectively compressing the Hessian eigenspectrum, with eigenvalues moving toward zero from both directions.
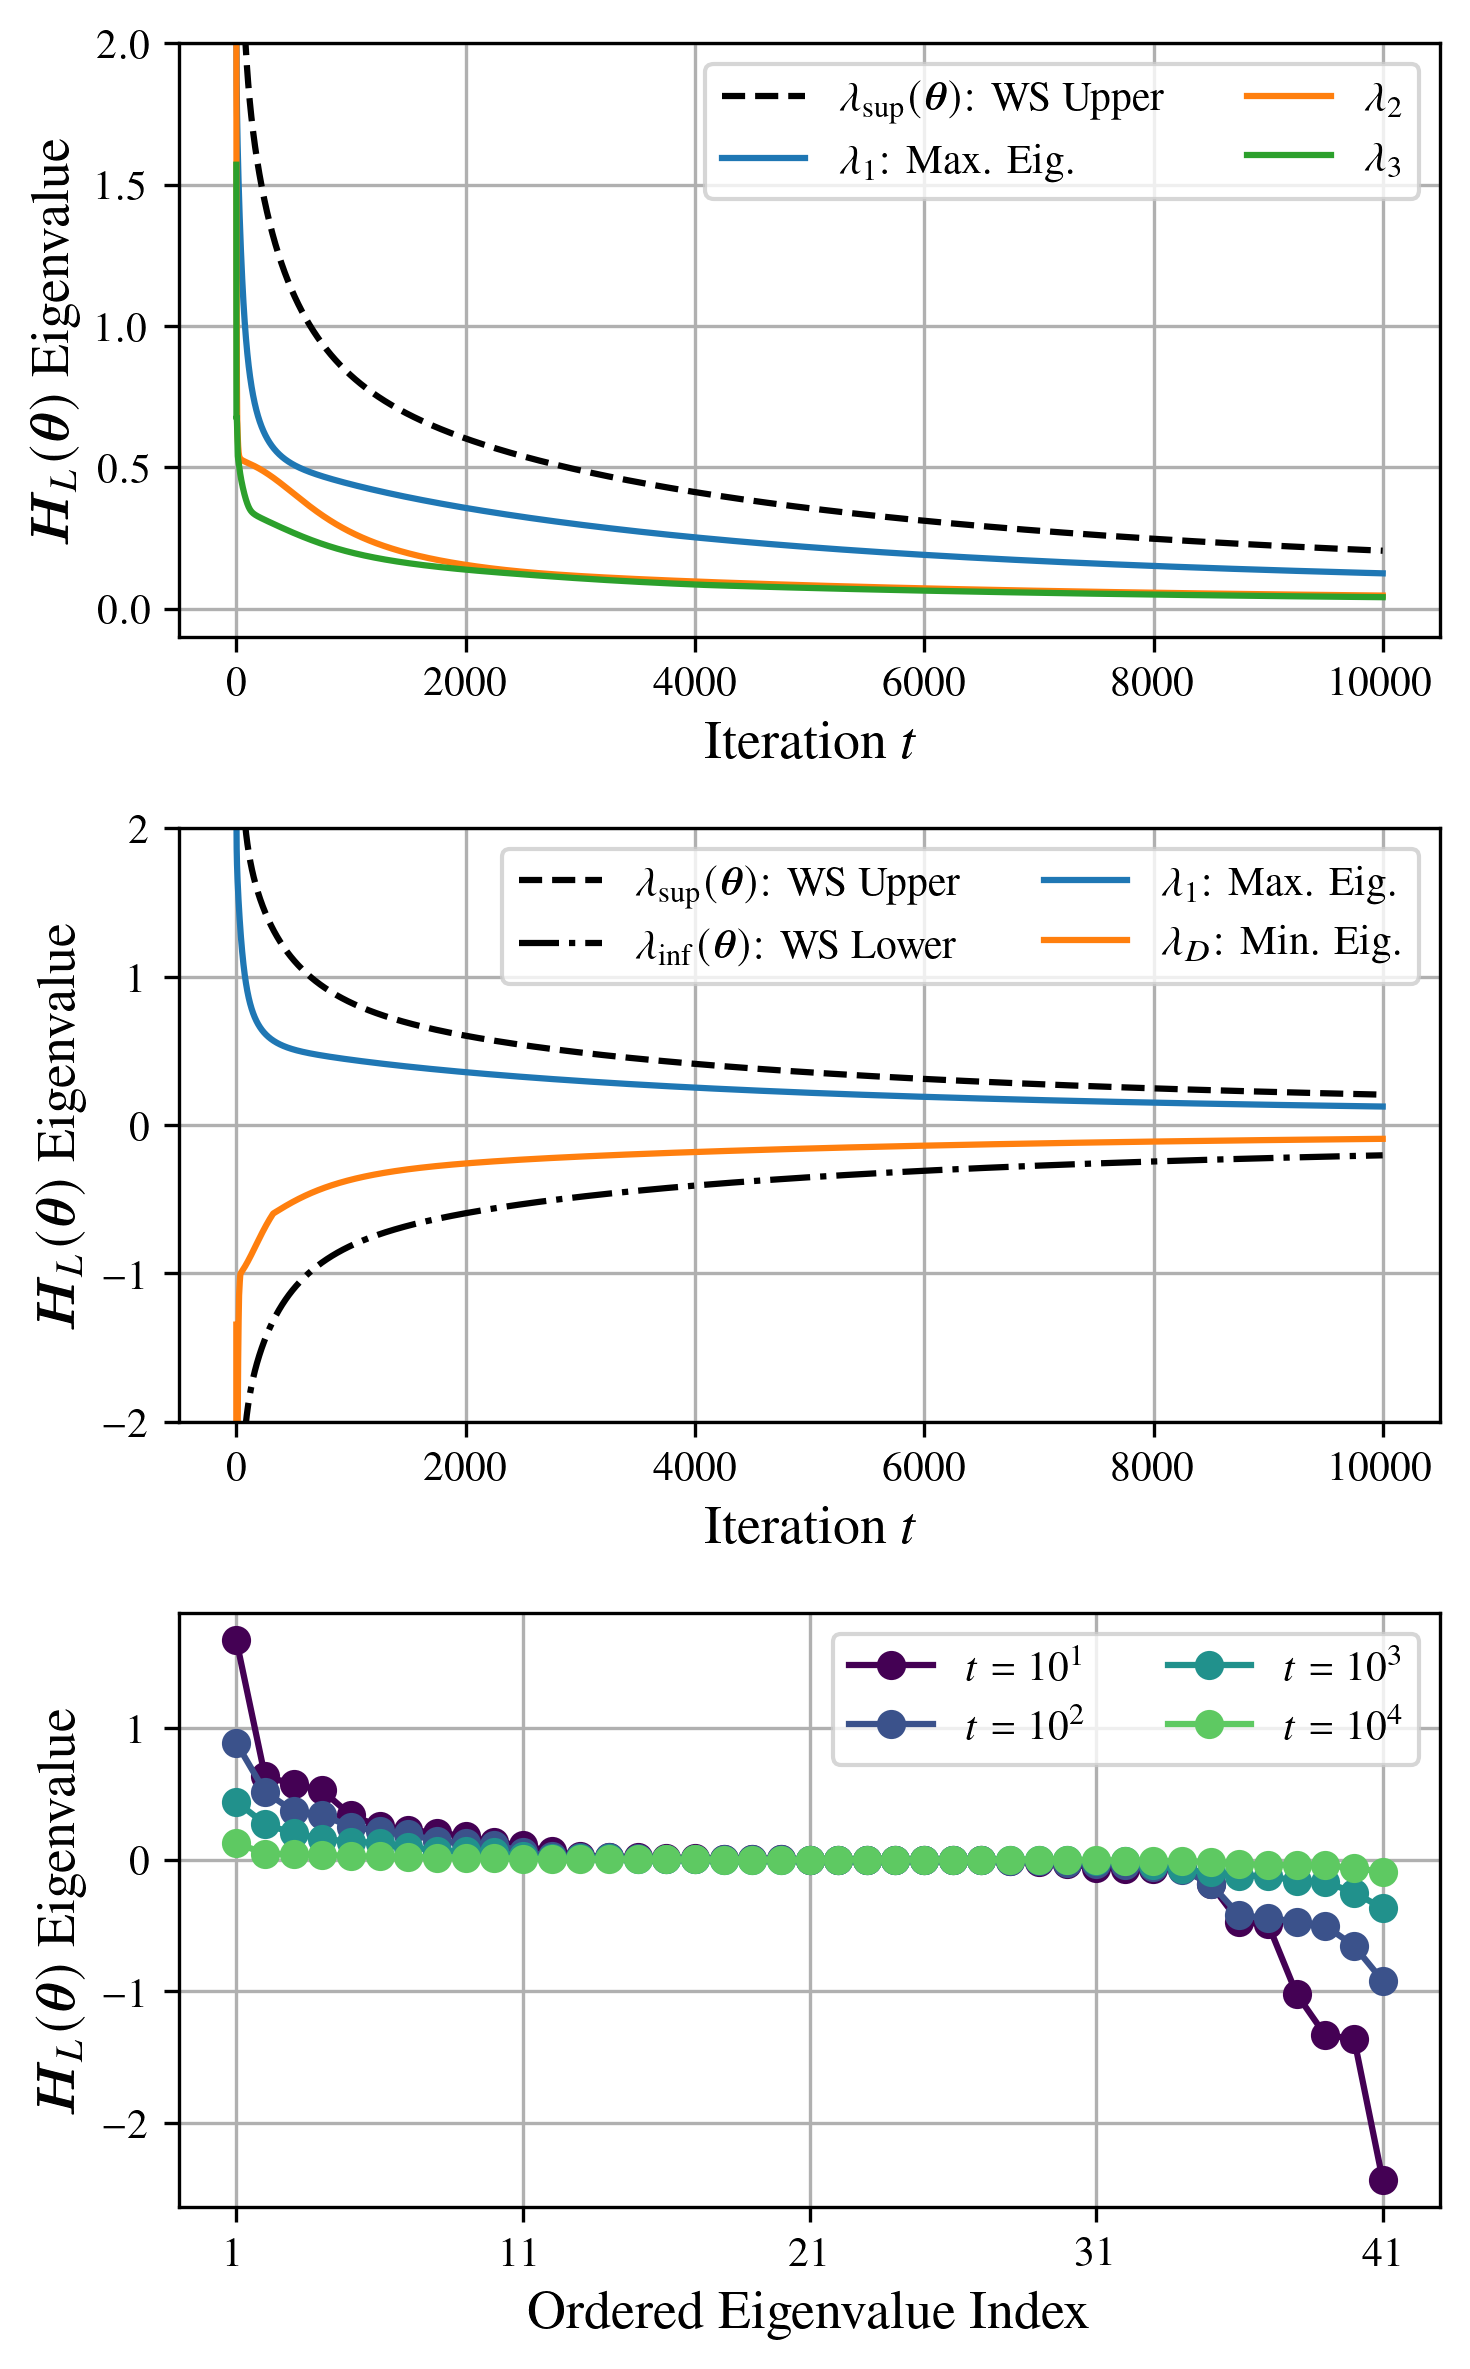
Figure 7: Training dynamics under steepest WS upper bound minimization: both upper and lower spectral bounds compress, and the spectrum narrows without significant negative eigenvalues (which correspond to unstable saddle points).
Experimental Results
A range of critical points (minima and saddles) was harvested by repeated training runs on a canonical 2D Gaussian classification problem with balanced data, explicitly comparing sharp and flat minima seeds using loss landscape and spectral statistics.
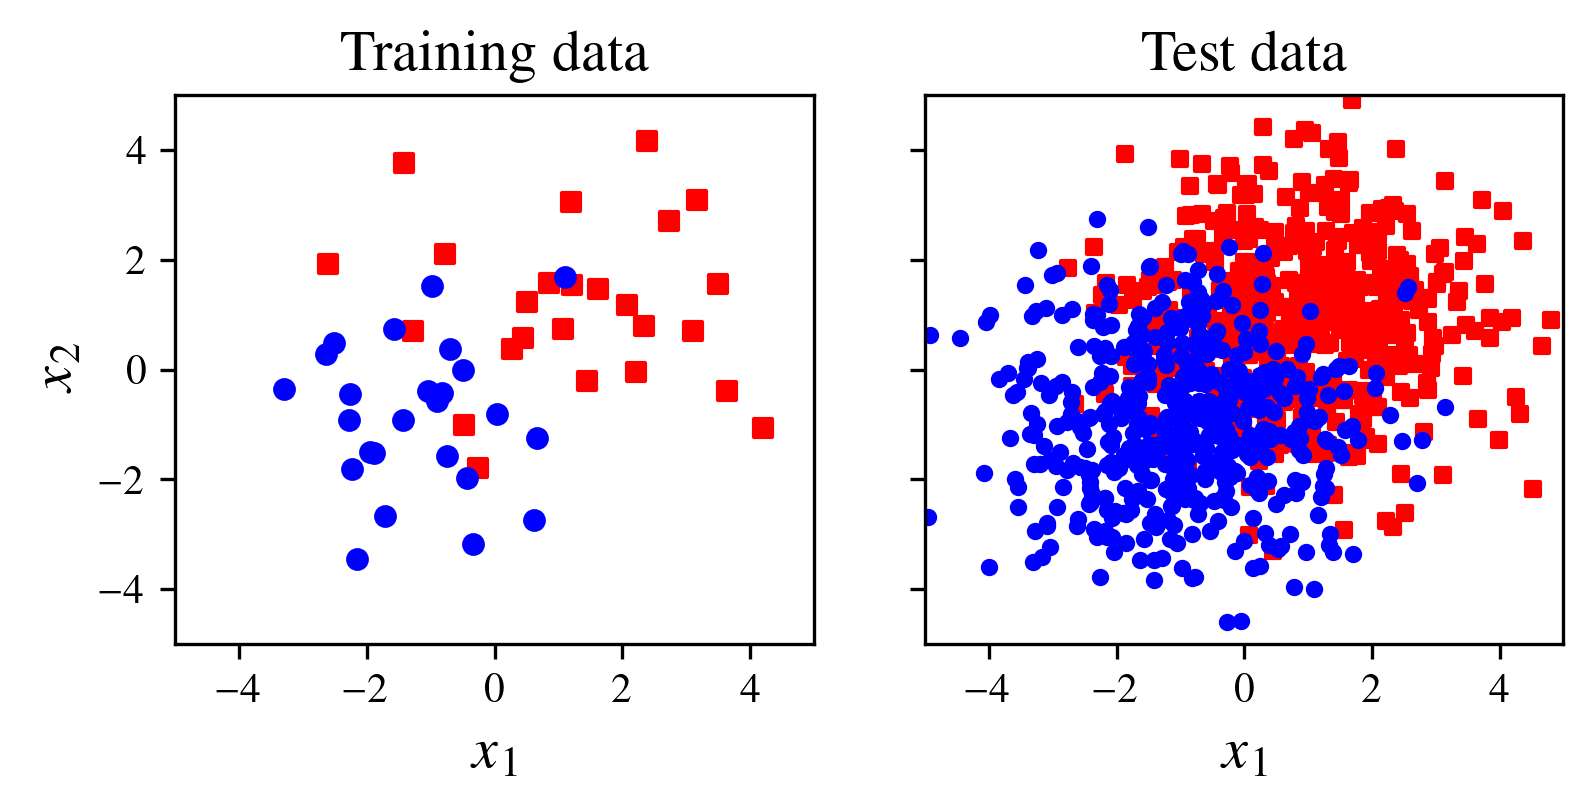
Figure 8: Visualization of balanced training and test data distributions for the synthetic Gaussian classification task.
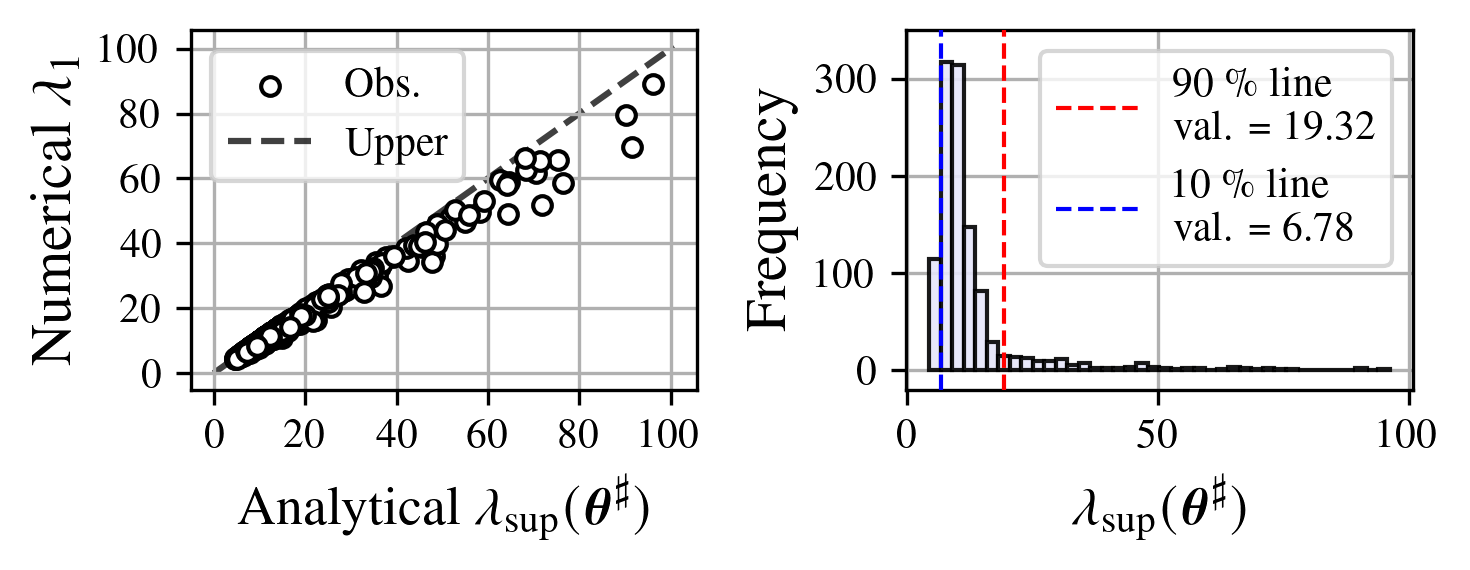
Figure 9: Tight correspondence between the largest Hessian eigenvalue and the WS upper bound at critical points, validating the flatness quantification.
Comprehensive training with four methods—the baseline, Hessian regularization, A-SAM, and HSR—shows that HSR matches or outperforms other approaches in reducing both the largest eigenvalue and the spectral spread, while also maintaining competitive loss minimization. Importantly, only HSR avoided regular convergence to clear saddle points, a risk observed with A-SAM in some conditions.
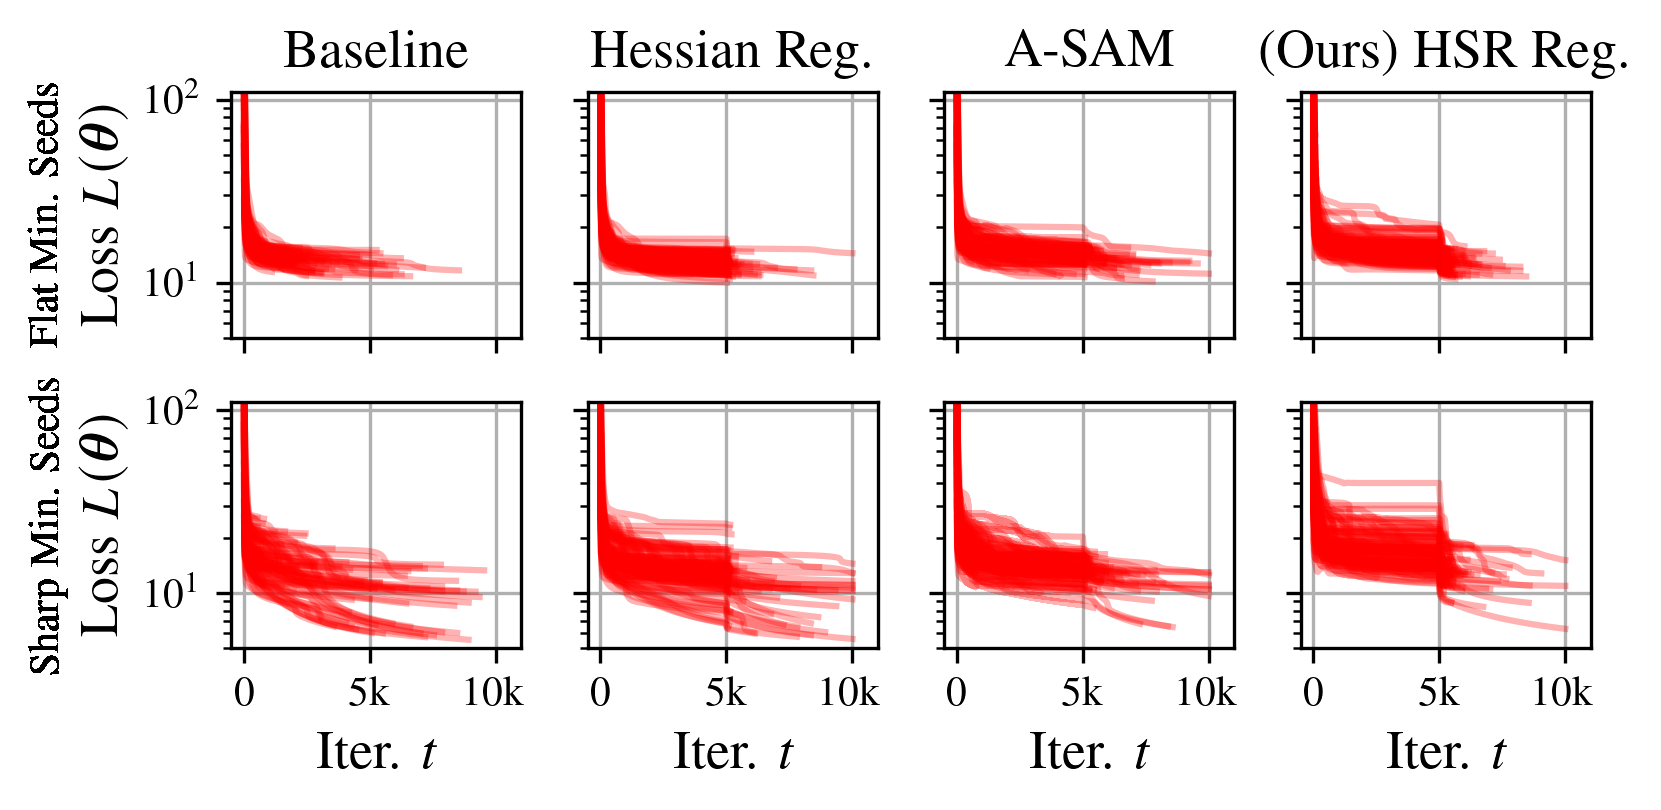
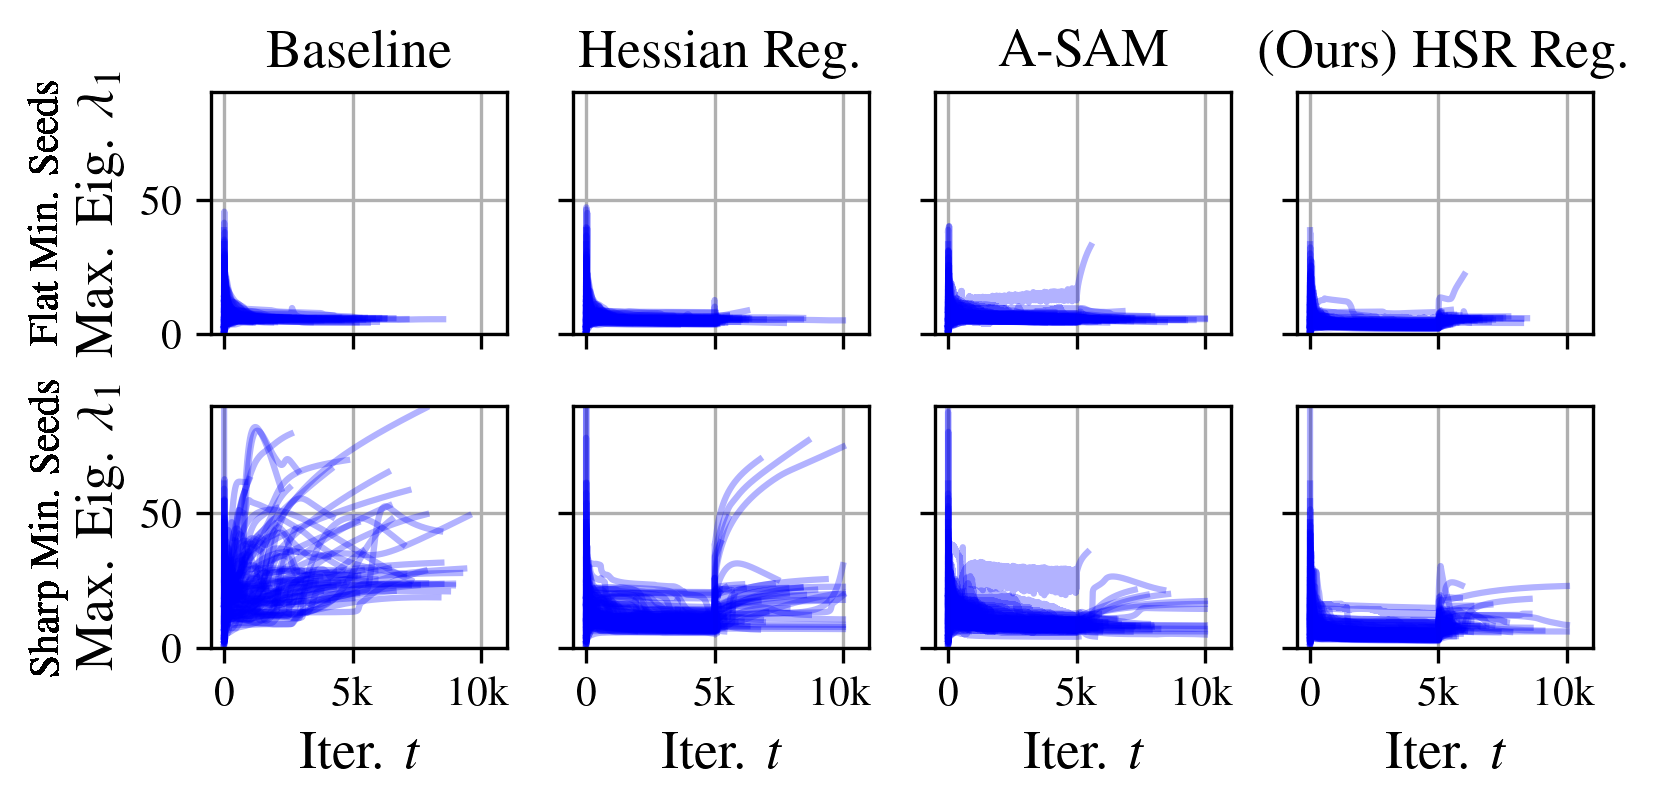
Figure 10: Loss L(θ) and Hessian spectral dynamics throughout training; HSR and A-SAM consistently achieve both low loss and lower maximum eigenvalue compared to baseline.
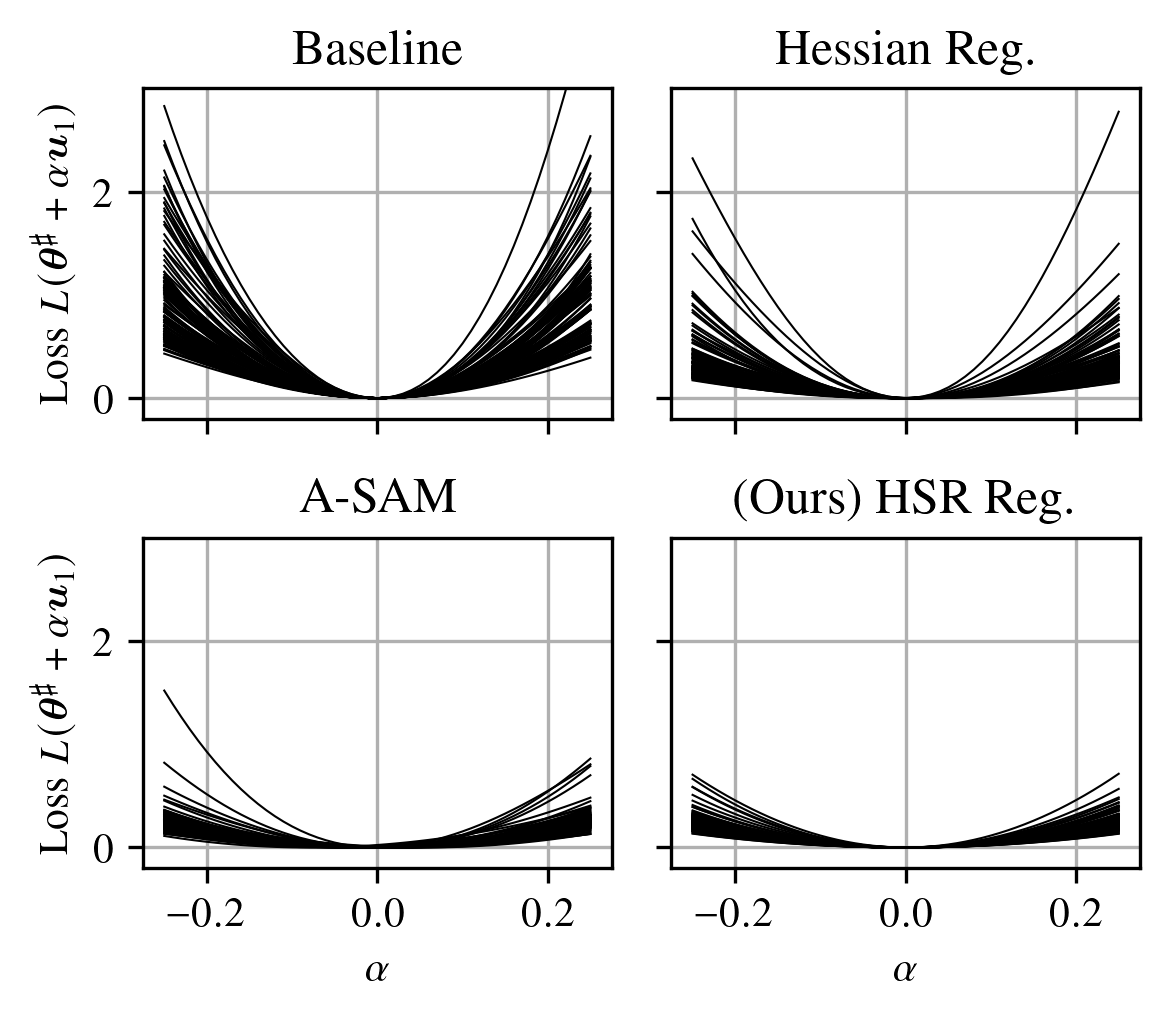
Figure 11: Loss landscapes near critical points for Sharp Minima Seeds: regularization significantly reduces curvature in the u1 (max-eigenvector) direction.
A rigorous comparison of spectral statistics across all methods reinforces the superior or equivalent performance of HSR regularization in lowering the maximum eigenvalue, mean, and spectral standard deviation. The risk of pronounced negative minimum eigenvalues (i.e., saddle points) is notably higher in A-SAM, whereas HSR’s spectral compression—dual targeting of upper and lower bounds—avoids this hazard.
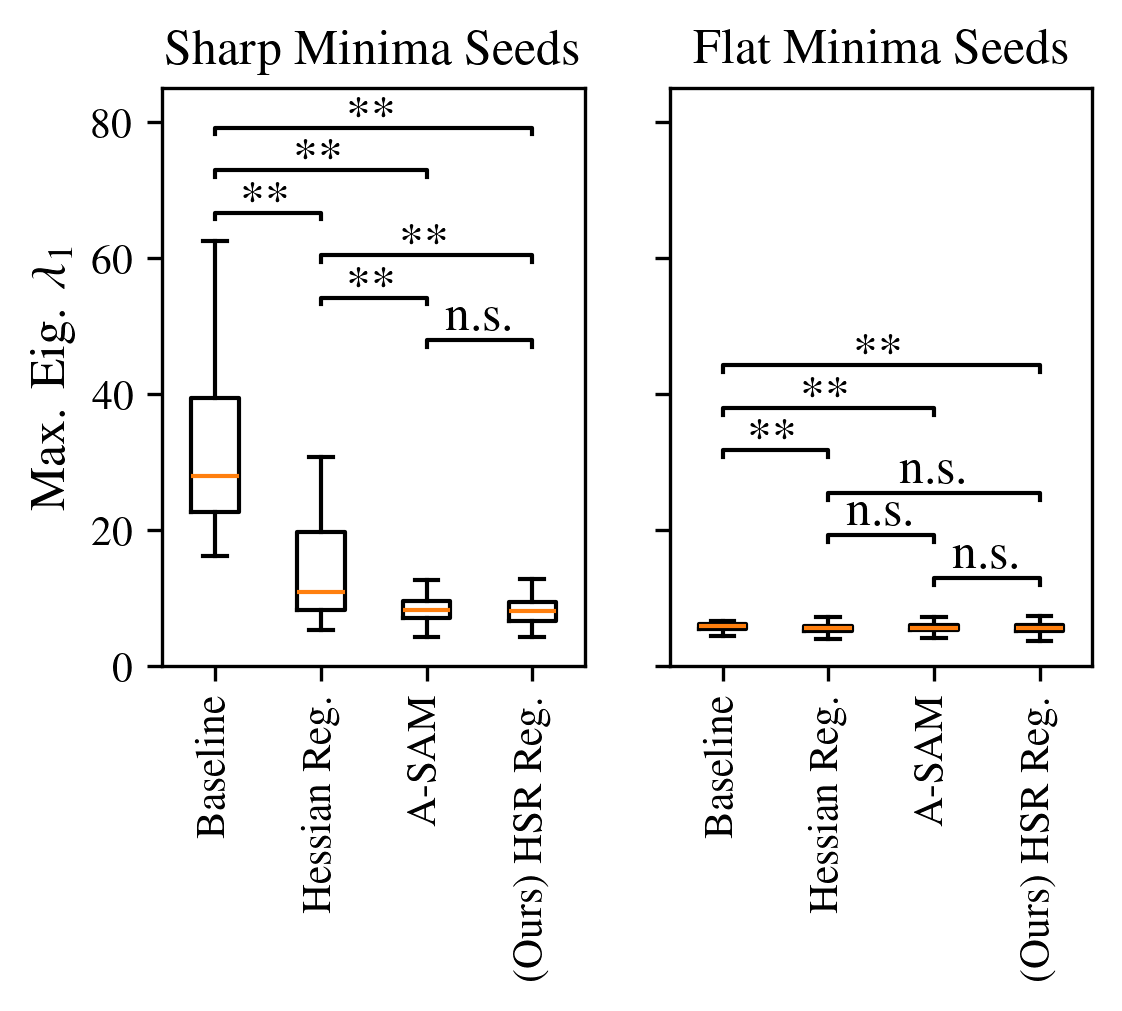
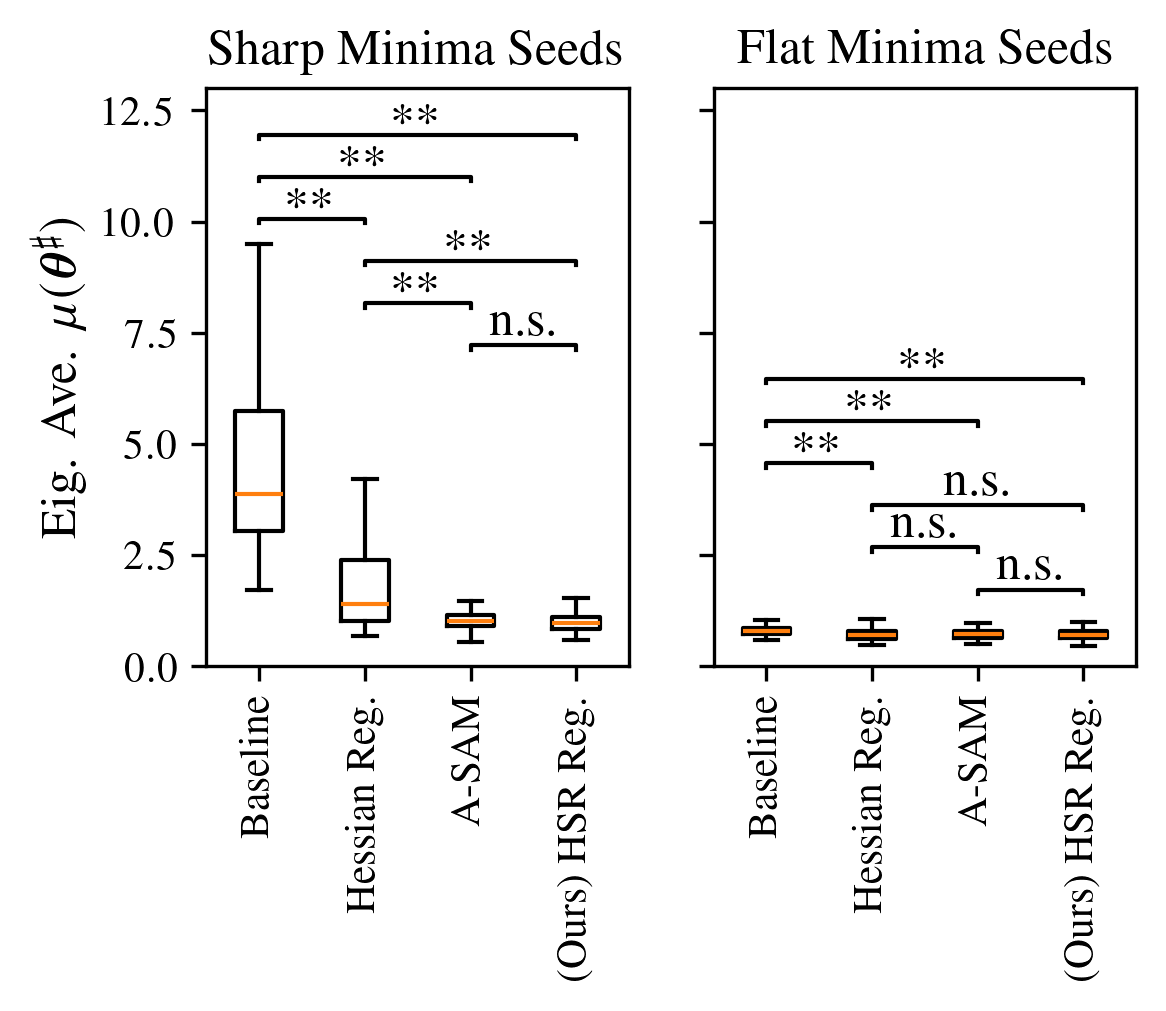
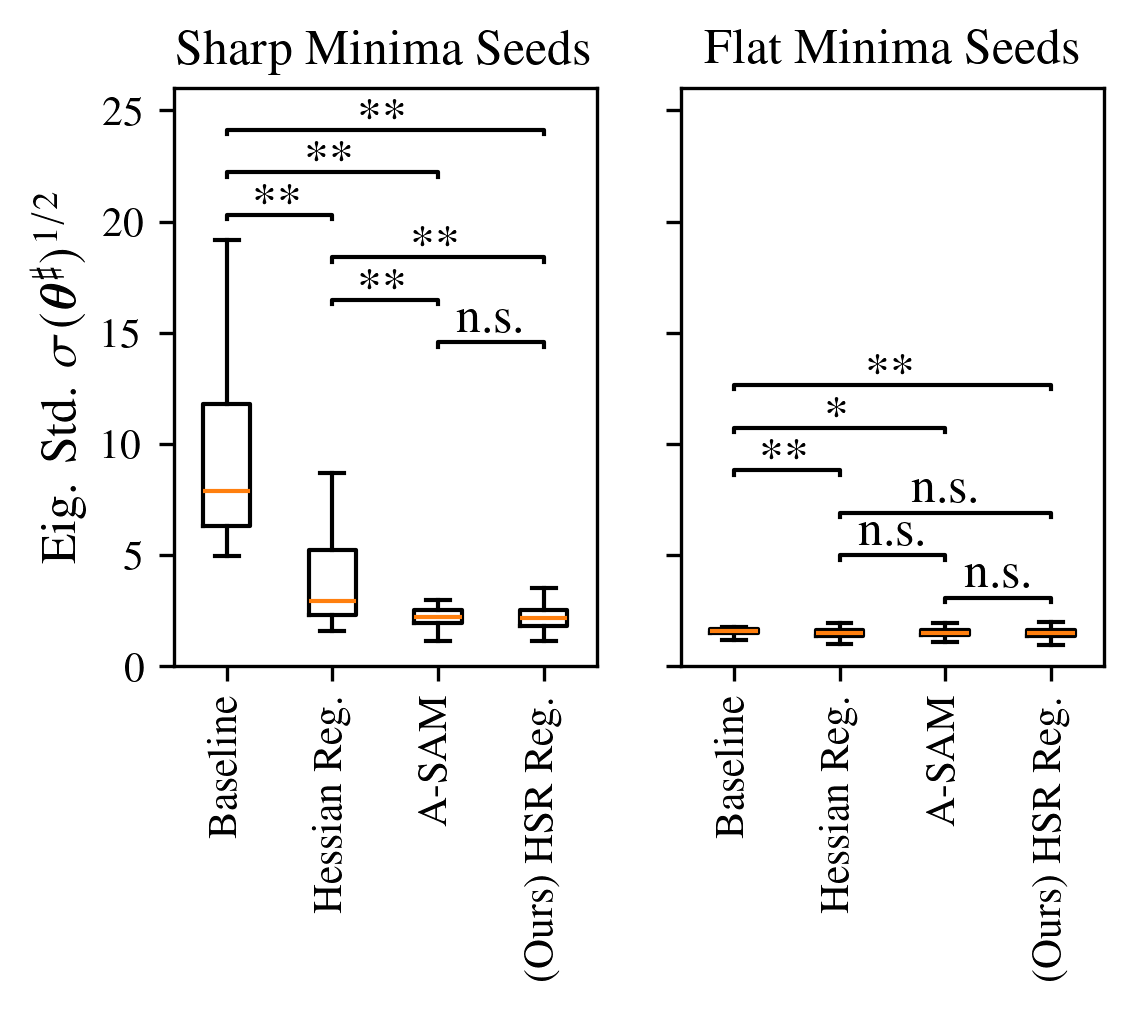
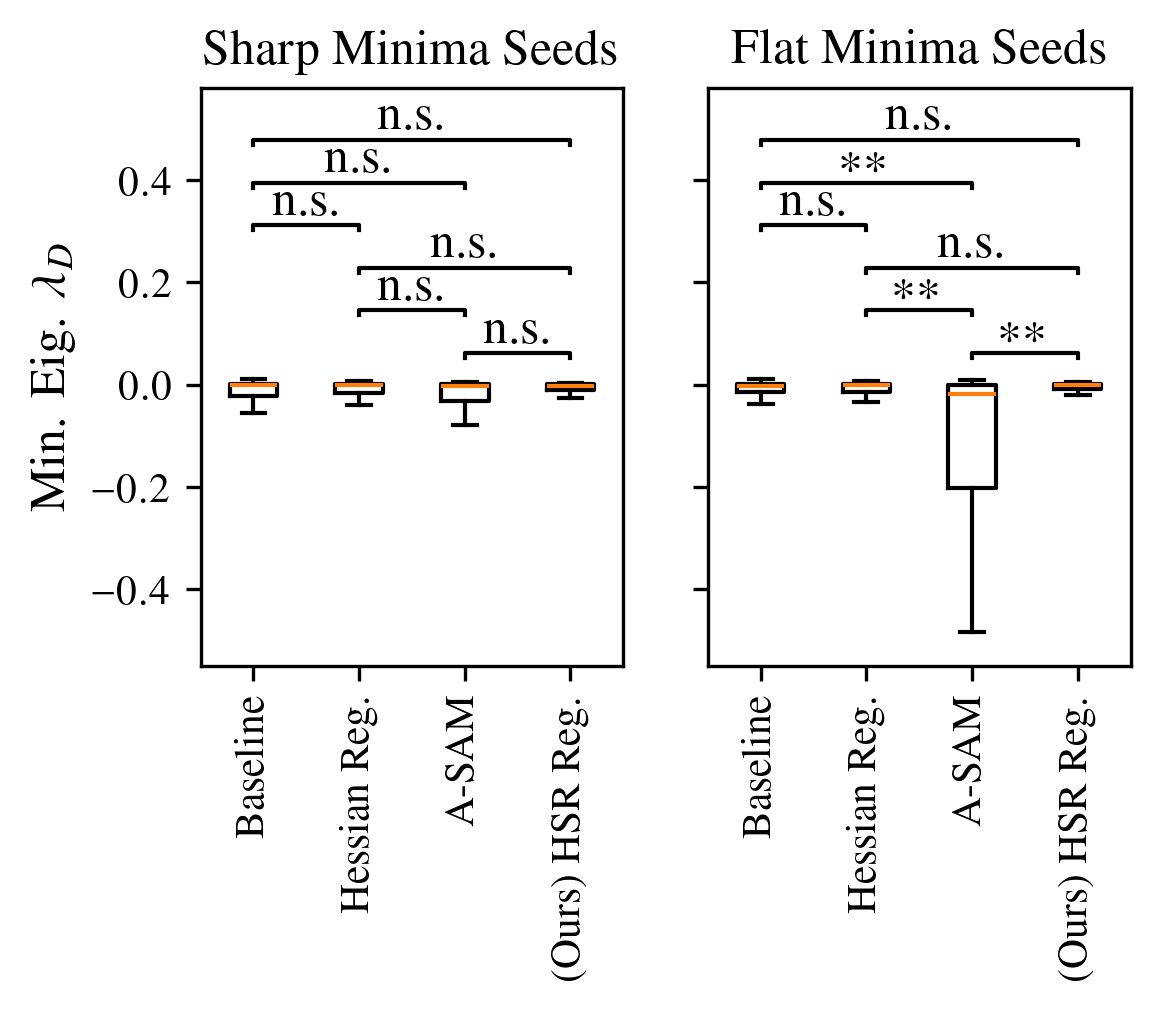
Figure 12: Maximum, mean, standard deviation, and minimum Hessian eigenvalues for critical points under various minimization strategies. HSR regularization achieves the most controlled and centralized spectrum.
Further, when inspecting the loss landscape in the direction of the minimum eigenvector, HSR-regularized solutions demonstrate robustness against falling into pronounced saddles.
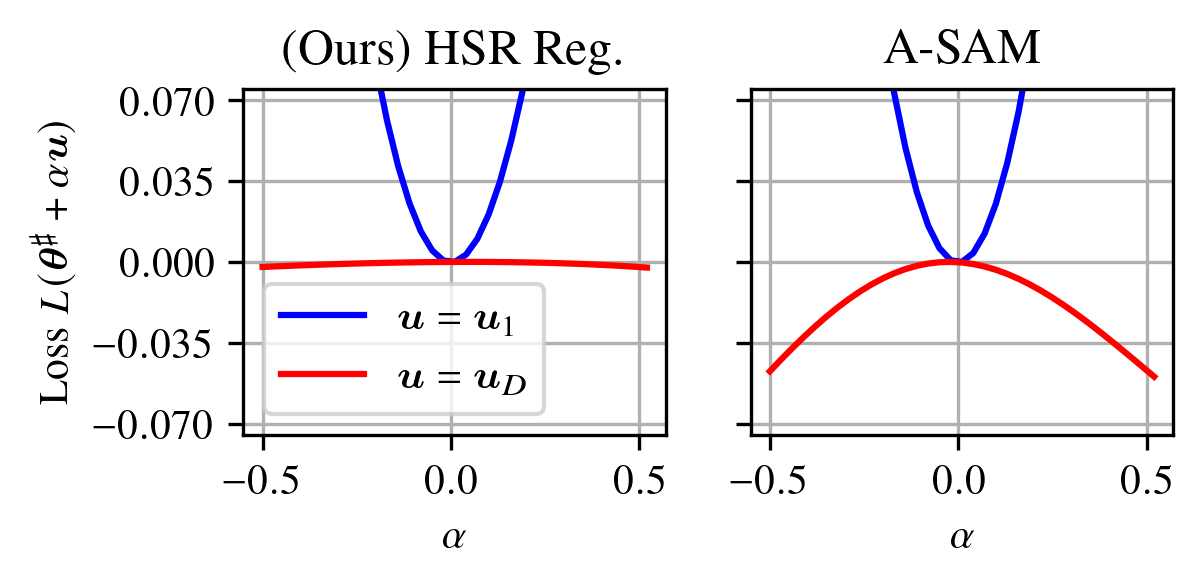
Figure 13: Loss landscape along the primary eigenvector directions at the critical point: HSR regularization avoids the deep saddle structures that are sometimes observed with A-SAM.
Generalization and Decision Boundary Effects
Regularization-induced reduction of Hessian sharpness correlates with improved generalization, confirmed by higher macro F1 scores on test data for HSR-regularized models compared to baseline or sole Hessian trace regularization. Decision boundary visualization reveals that HSR regularization systematically simplifies and smooths class boundaries, indicating overfitting suppression.
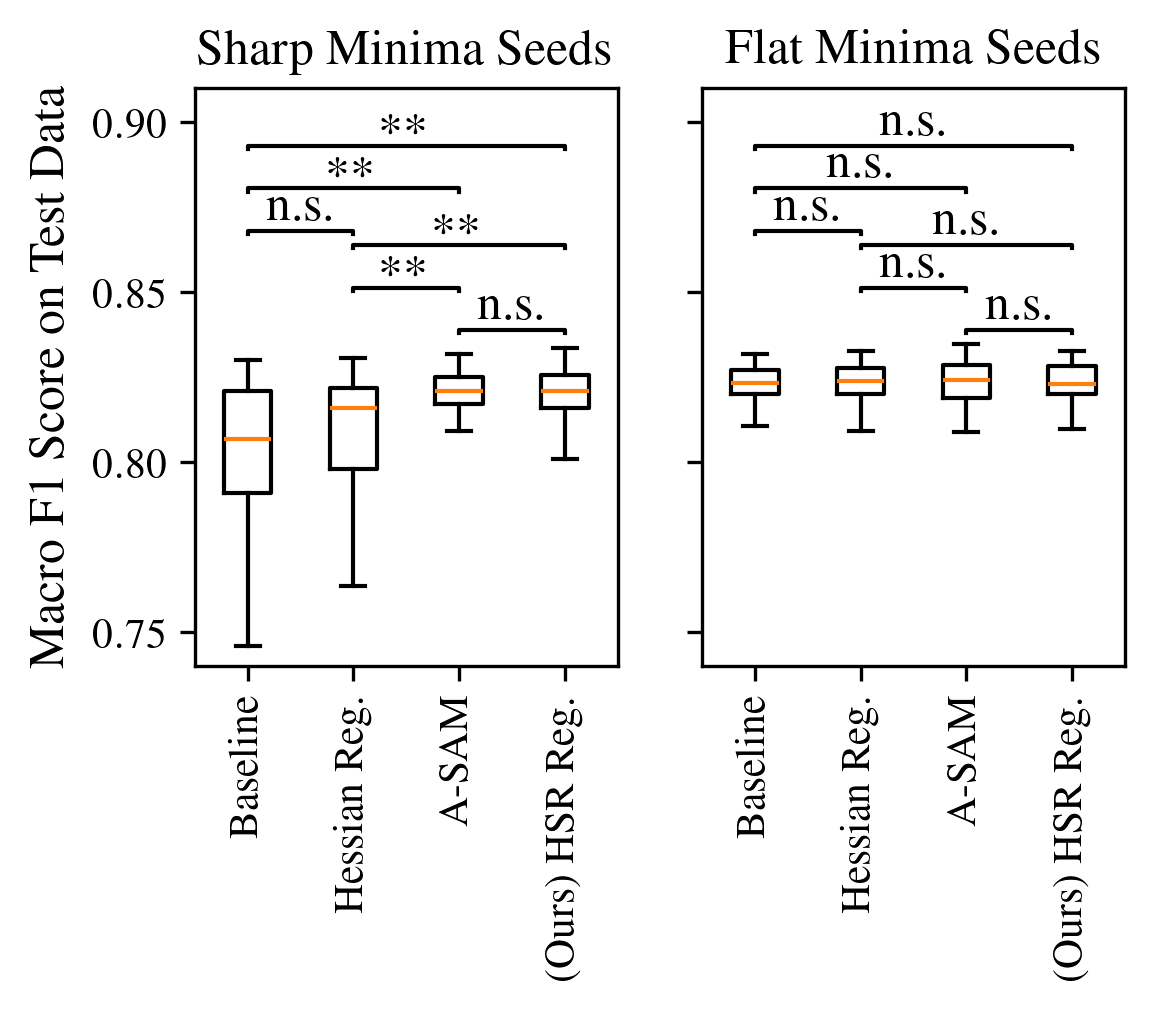
Figure 14: Macro F1-scores at critical points. Eigenvalue-targeting regularization methods—especially HSR—statistically improve generalization compared to baseline.
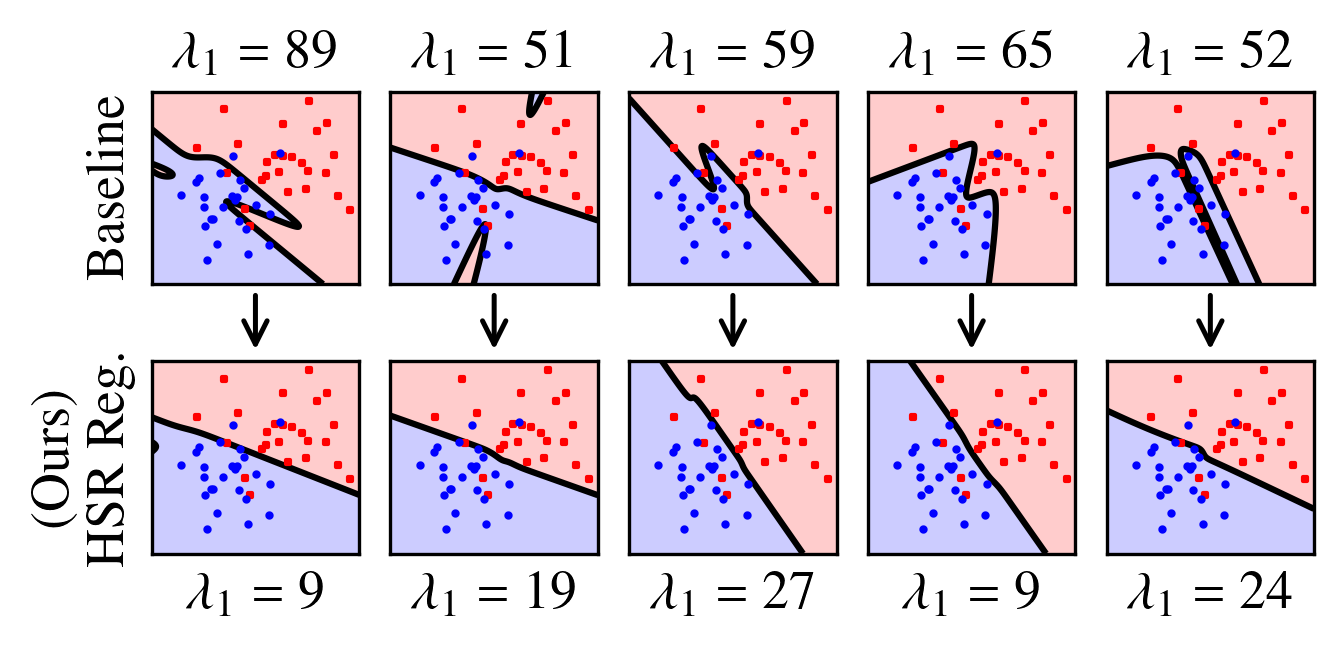
Figure 15: Decision boundaries with and without HSR regularization for Sharp Minima Seeds, with regularization yielding smoother, less overfit classification surfaces.
Theoretical Implications, Limitations, and Future Directions
HSR regularization, as formulated, is constrained to three-layer networks with cross-entropy loss, limiting its immediate applicability. However, its explicit, closed-form derivation offers several crucial theoretical contributions:
- It quantifies, in analytic terms, how data distribution and parameterization influence the directionality of flatness-seeking optimization.
- It demonstrates that simultaneous control of both Hessian spectral bounds is feasible, mitigating the risk of falling into wide, unstable saddle regions which may otherwise derail training.
- It provides a foundation for generalizing spectral regularization strategies beyond heuristic or numerically motivated designs.
Future research must address extension to multilayer architectures, multi-class problems, and broader loss families, with focus on analytic tractability or principled approximations (2606.28662).
Conclusion
This study presents the first closed-form steepest descent direction aimed at reducing upper Hessian spectral bounds in NNs, building an explicit connection between Hessian eigenspectrum control and parameter updates. The introduced HSR regularization achieves spectral flattening comparable to or surpassing state-of-the-art methods such as SAM/A-SAM and outperforms Hessian trace regularization, with beneficial impacts on generalization and loss landscape stability. While currently limited in scope, these findings elucidate the theoretical mechanics of flatness-driven generalization and provide a powerful lever for further analytical investigations in neural learning theory.