- The paper establishes that a universal, maximally dynamic aggregation scale (η*) optimizes activation in temporal networks.
- It employs rigorous preprocessing and classification on 39 datasets to reveal stability, burstiness, and openness across diverse domains.
- Analytical modeling using renewal processes underpins insights into connectivity trade-offs and self-regulatory dynamics in complex networks.
Universal Time Scales Linking Topology and Dynamics in Temporal Networks
Dataset Corpus and Preprocessing Protocols
The study systematically analyzes 39 temporal network datasets spanning diverse domains including social, informational, online activity, and offline interactions. Datasets are sourced from the Netzschleuder repository and subjected to rigorous preprocessing: selection of appropriate observation periods to handle heterogeneous activity, application of edge weight cutoff (w∗=10) to reduce noise and stabilize burstiness metrics, and exclusion of networks with less than 100 edges after processing. These steps ensure statistical robustness in subsequent analyses and allow generalization across dynamic and topological regimes.
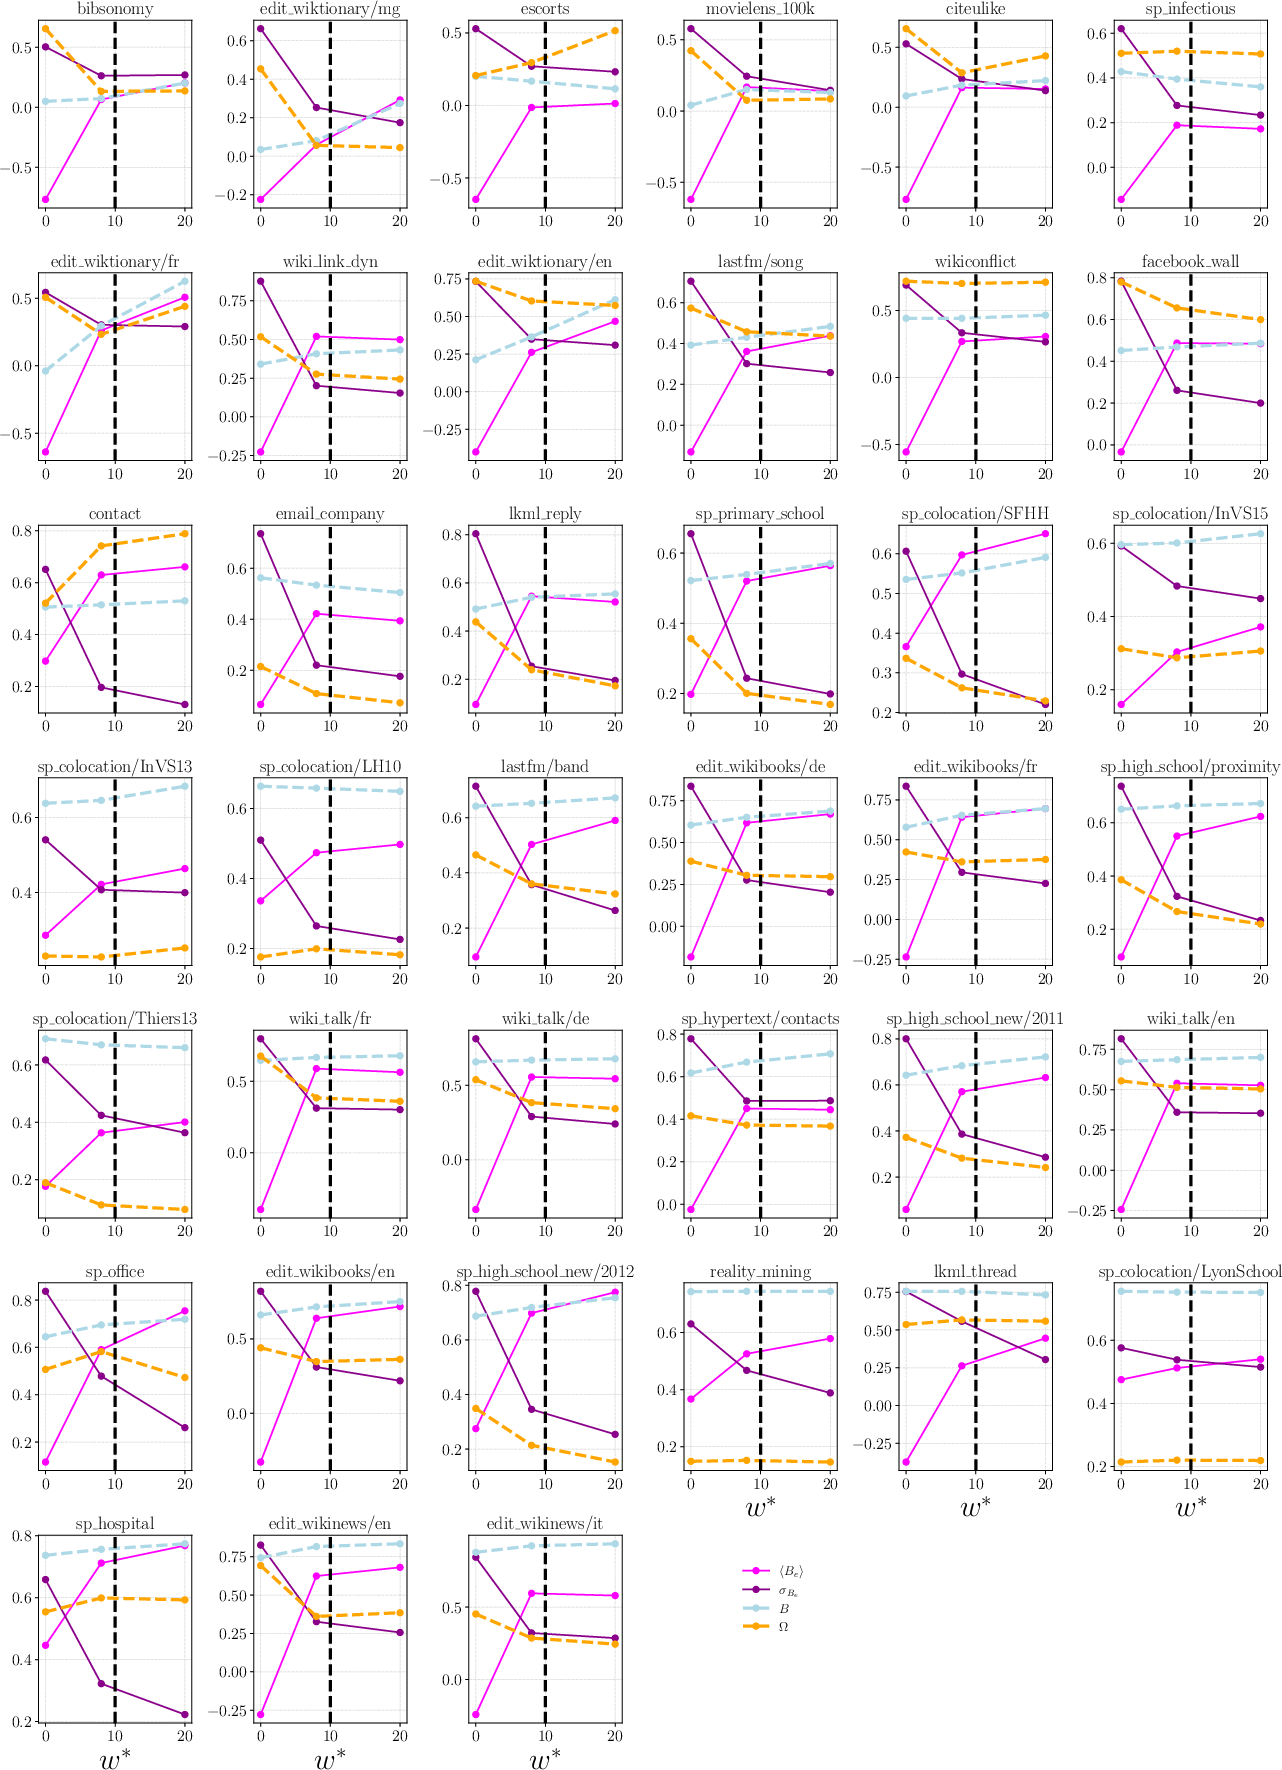
Figure 1: Mean and standard deviation of edge burstiness, system burstiness, and openness as a function of the edge weight cutoff w∗. Properties stabilize near w∗=10.
Structural and Temporal Network Properties
Static Node and Edge Statistics
Fully aggregated degree and strength distributions demonstrate substantial heterogeneity both within and across dataset types. Most distributions remain stable under variations of the observation window, indicating structural robustness to temporal sampling. The observed strength-degree correlations, characterized by near-linear dependence (β≈1), indicate minimal intrinsic correlation: event frequencies are largely proportional to connection count.
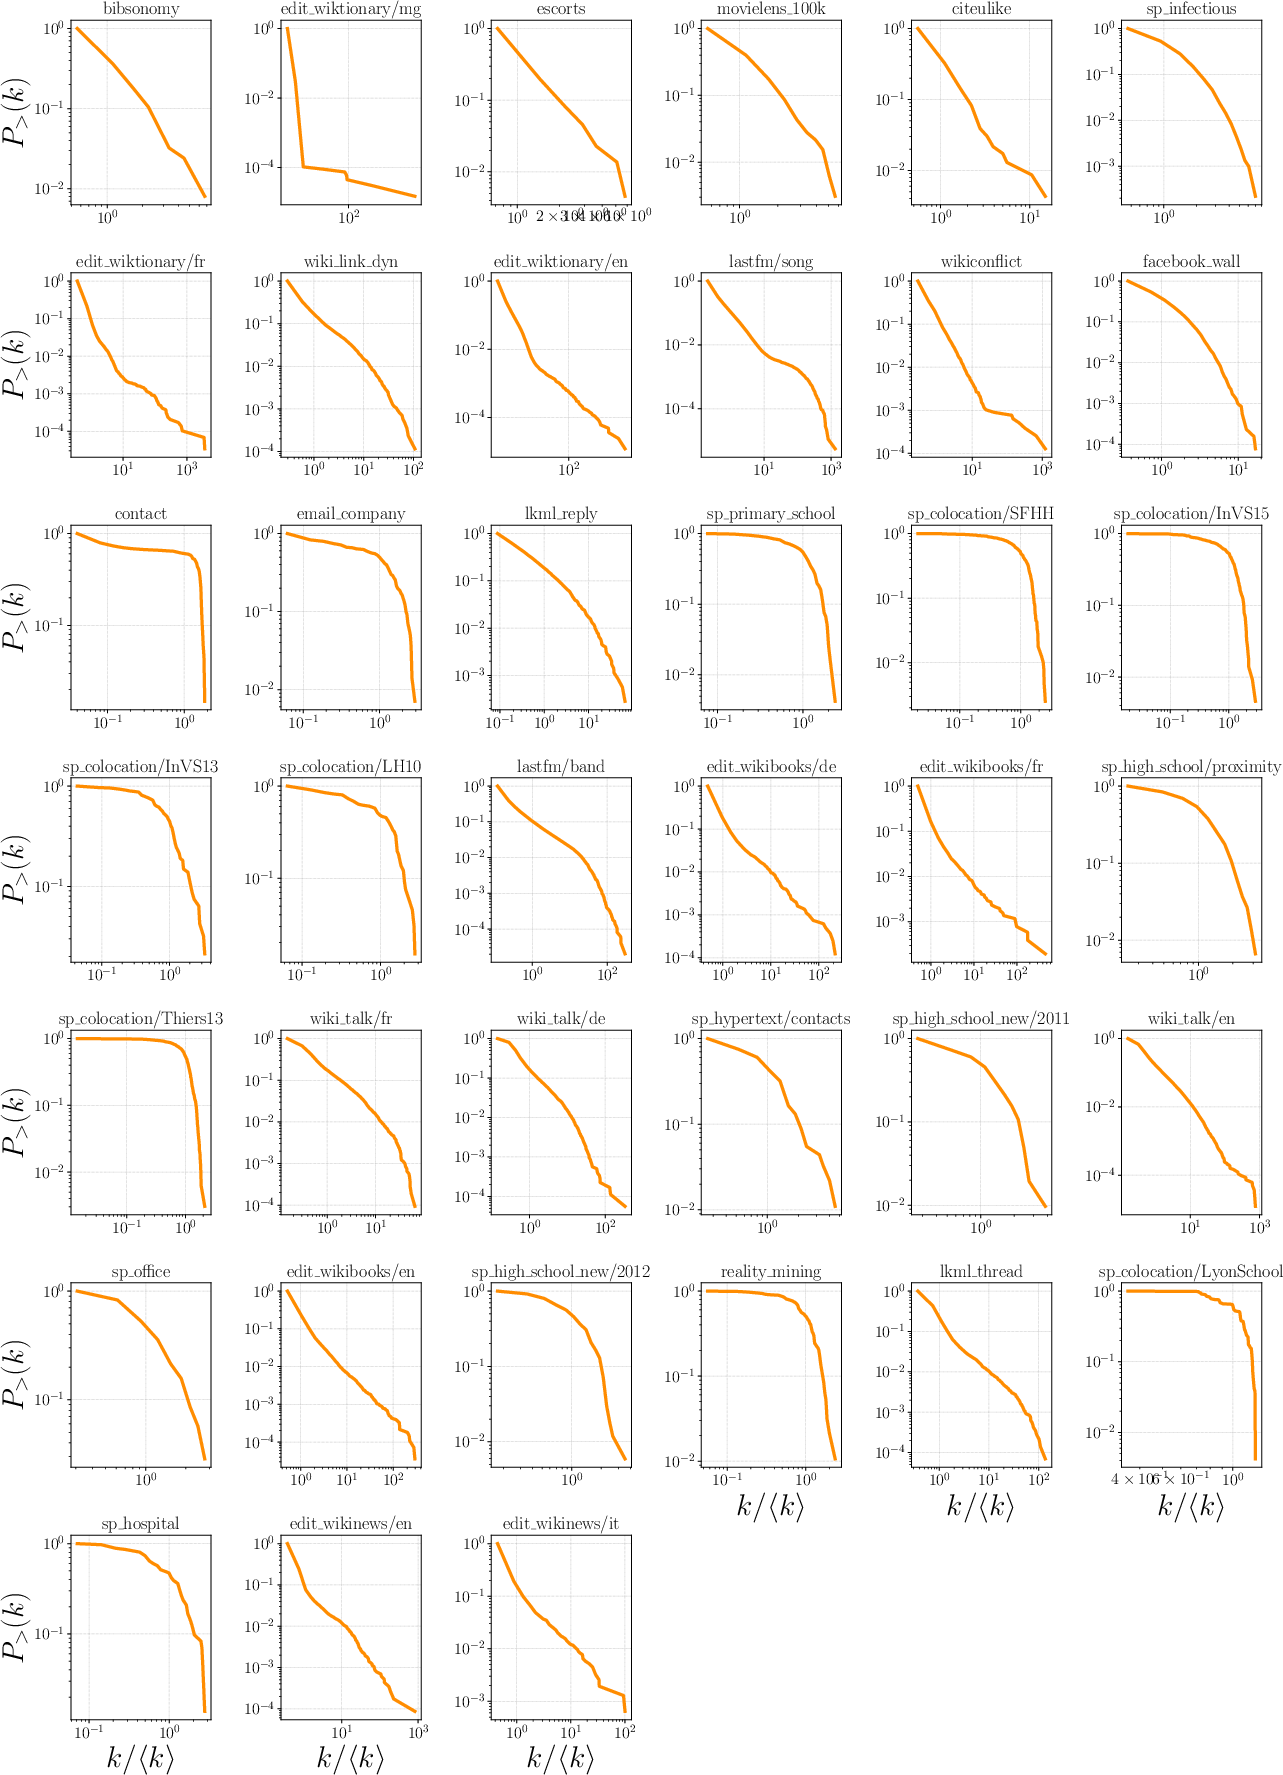
Figure 2: Complementary cumulative distribution function (CCDF) of node degree for all datasets, illustrating topological diversity.
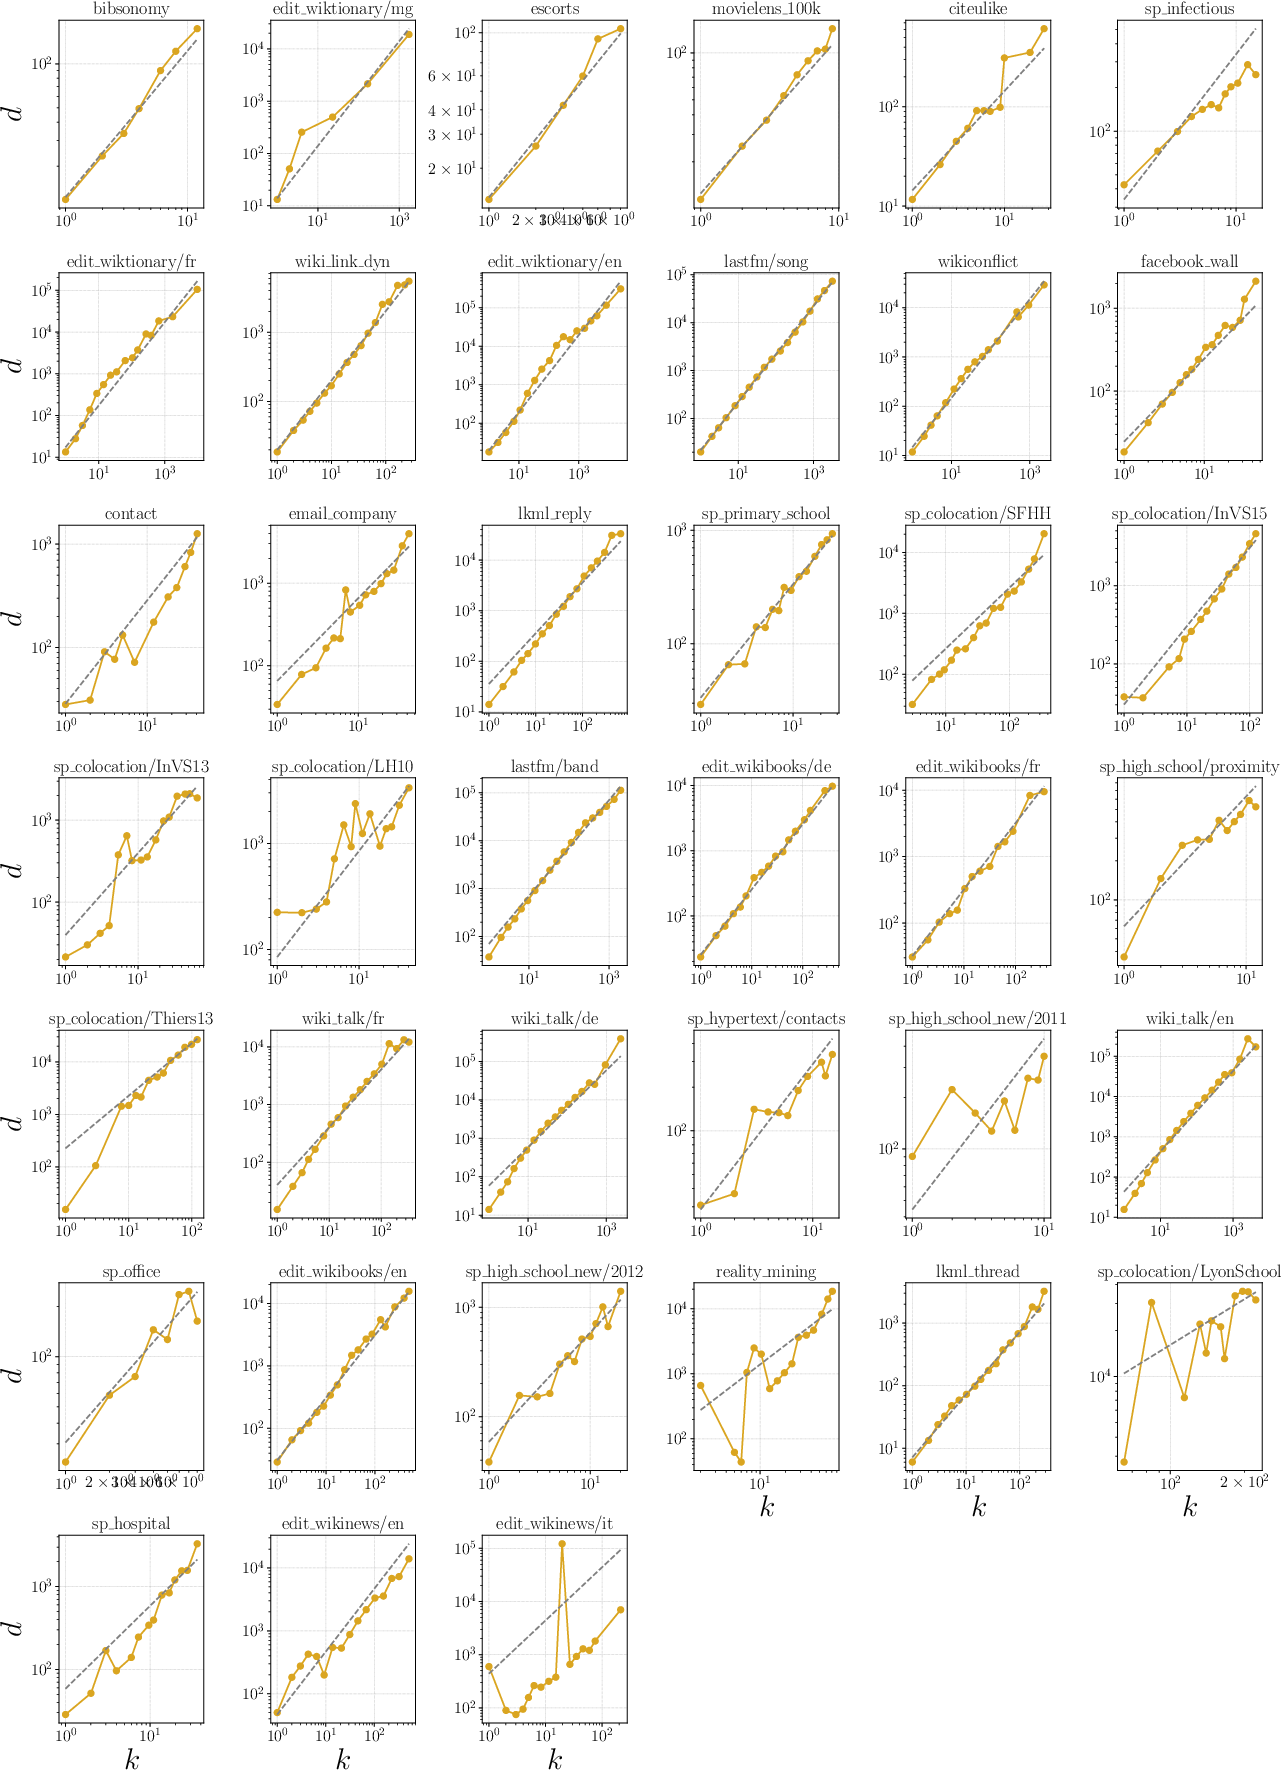
Figure 3: Correlation between node strength and node degree; the dashed line marks linear uncorrelated behavior.
Edge weights exhibit wide variability, with distributions typically spanning multiple orders of magnitude. While most offline social datasets manifest power-law regimes in inter-event time (IET) distributions with exponential tails, online and informational networks deviate and rarely display such scaling behavior. The IET distribution is stable under different observation window choices, confirming temporal stationarity at the macro level.
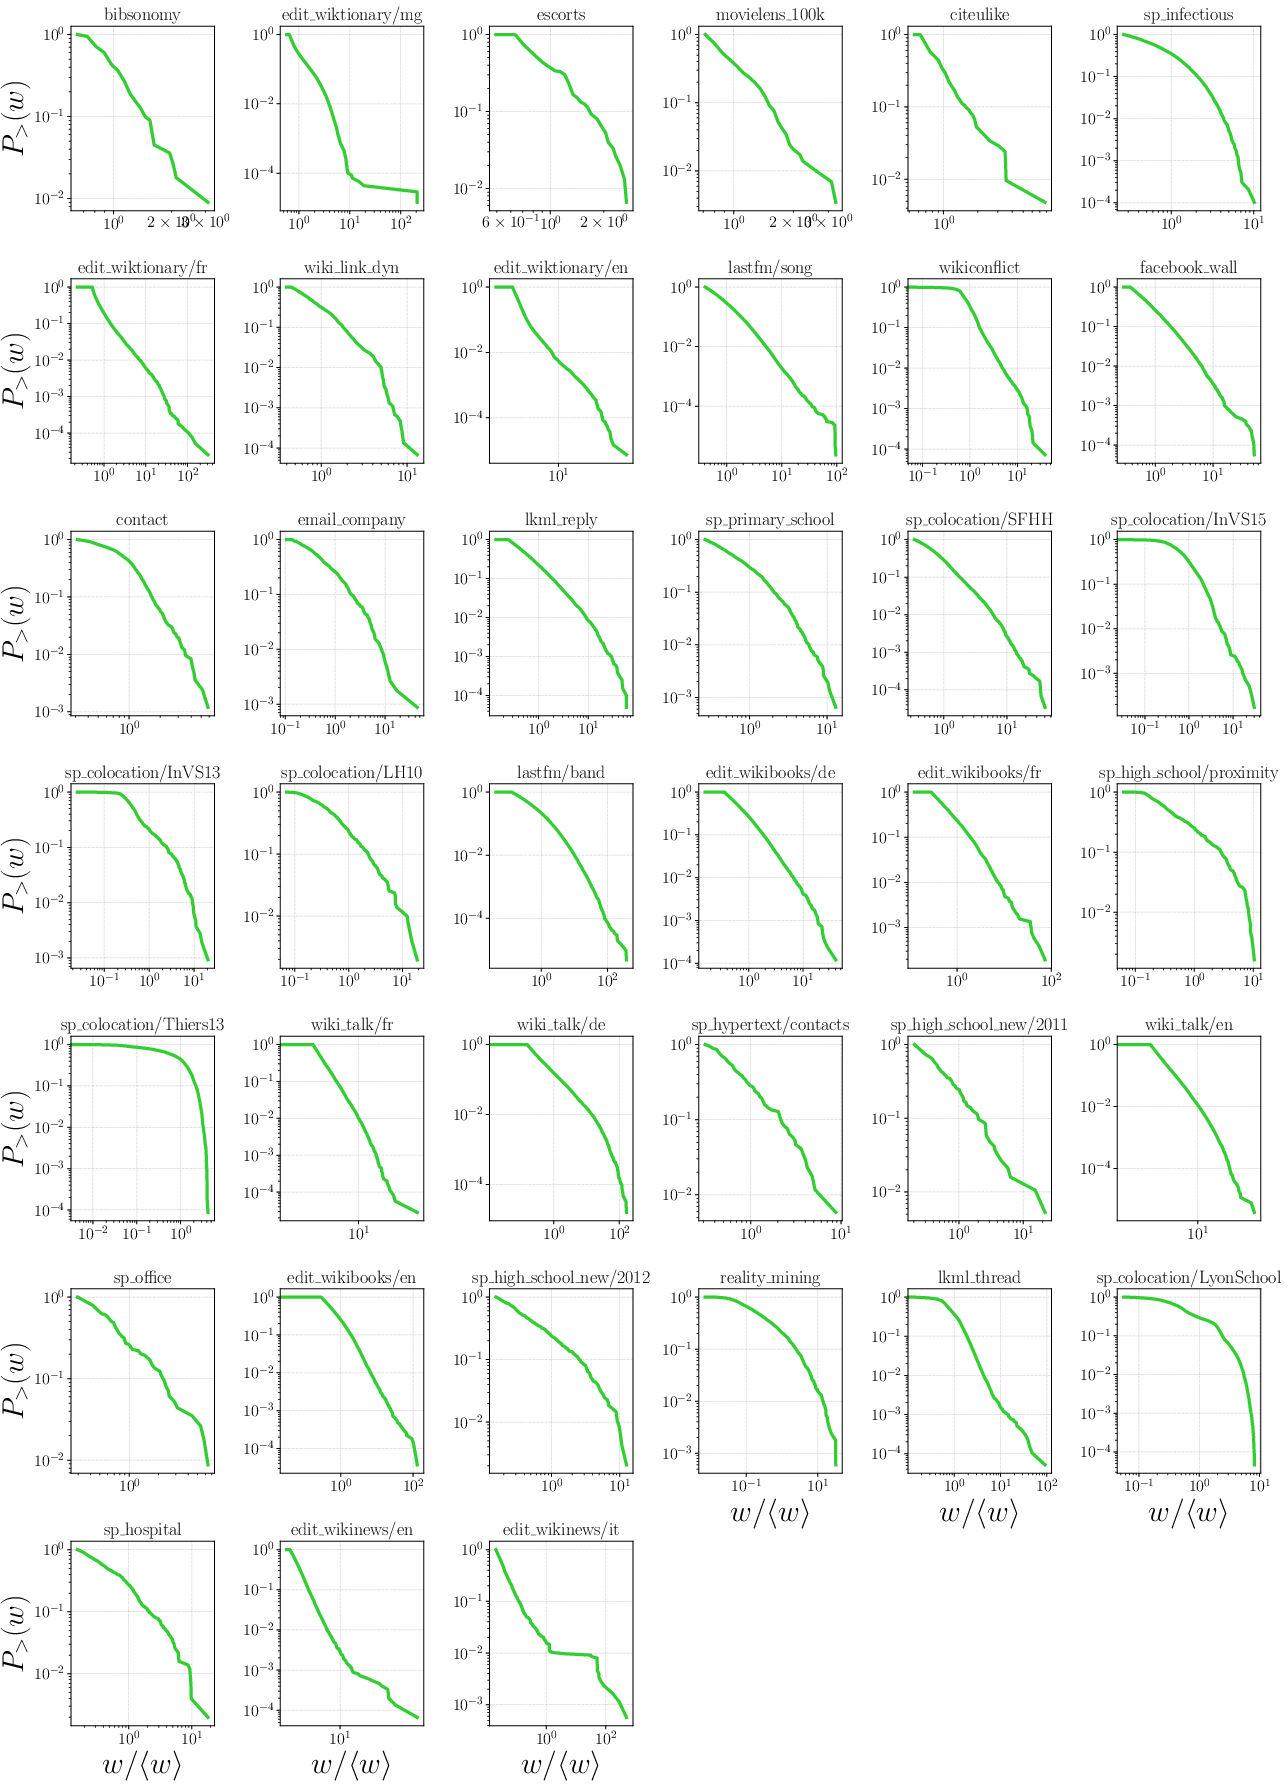
Figure 4: CCDF of edge weights across all datasets, exemplifying event load heterogeneity.
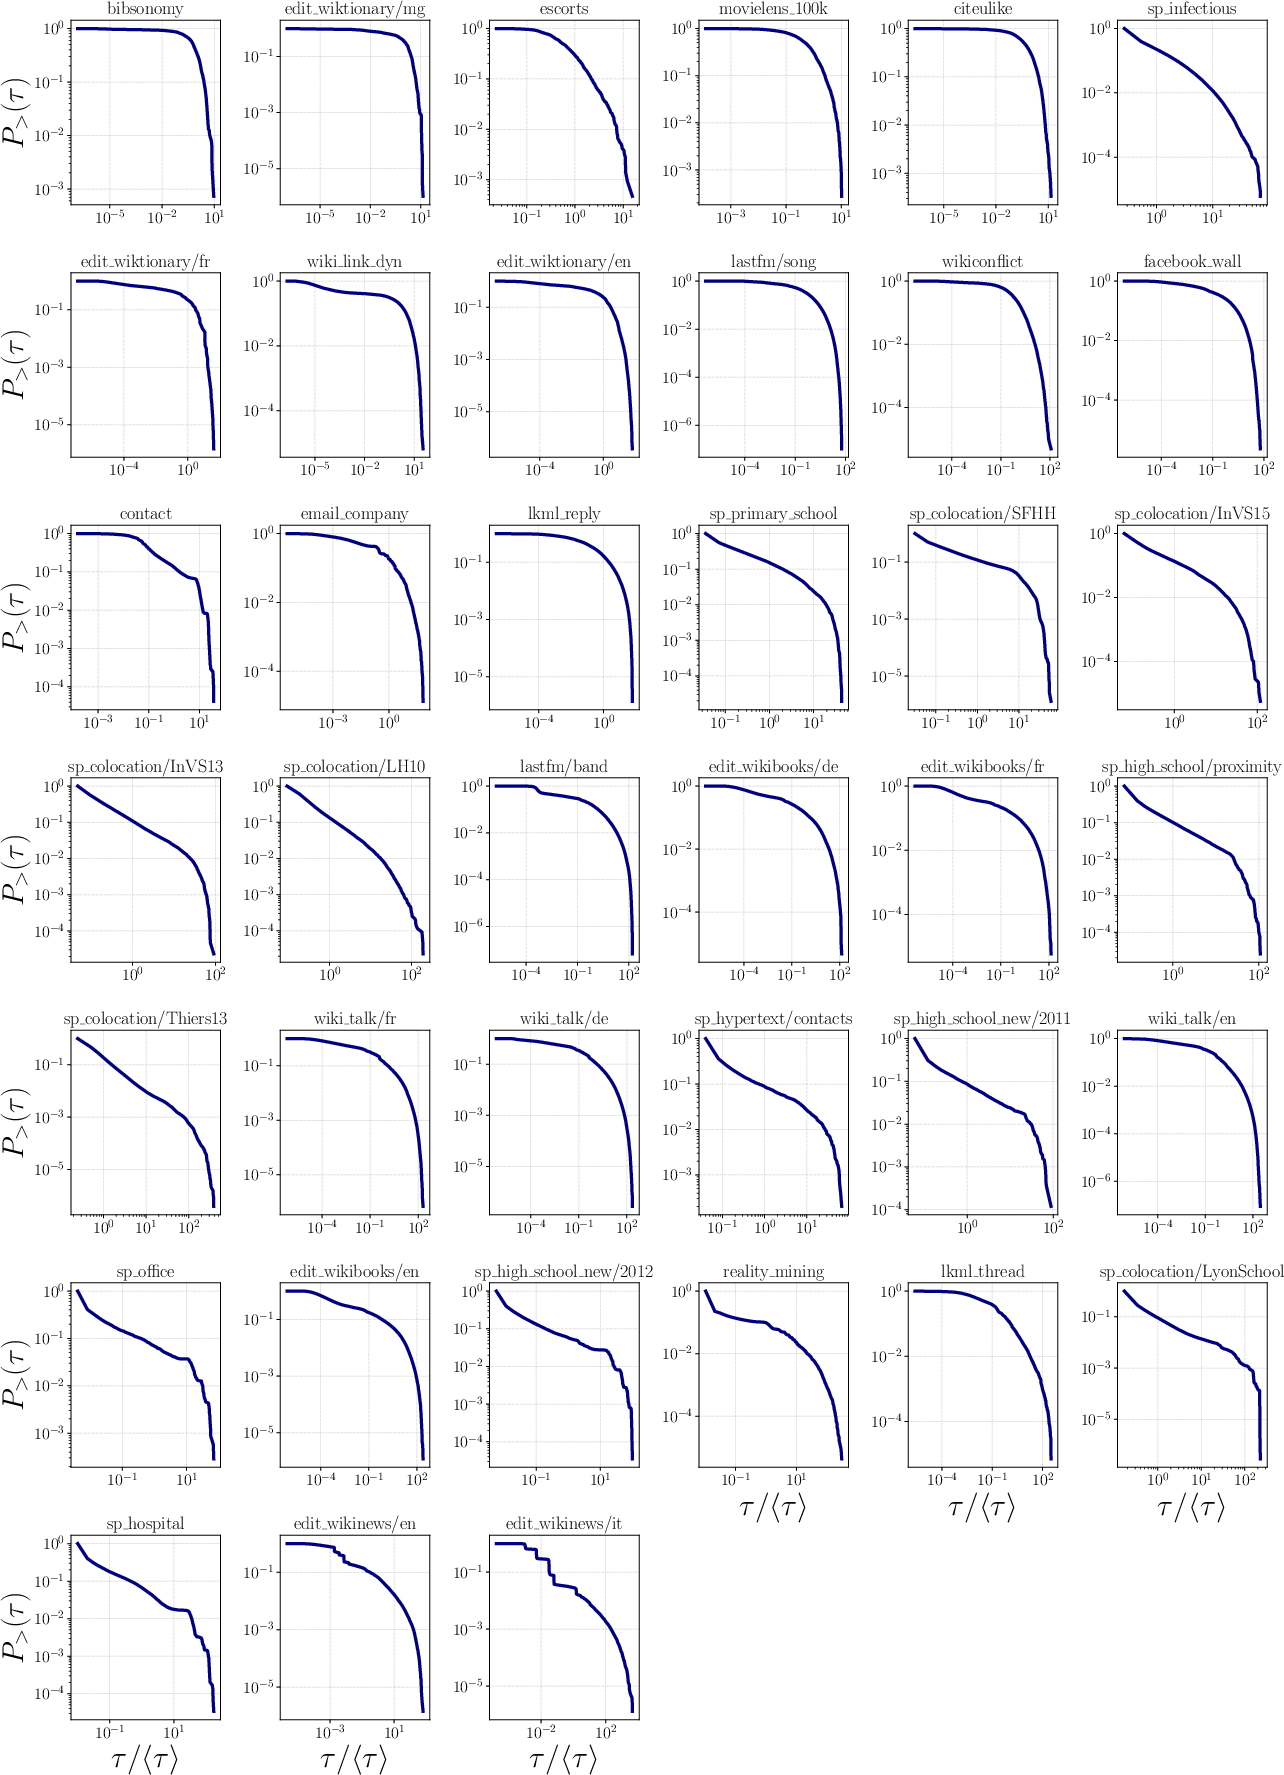
Figure 5: CCDF of edge IETs, with offline social datasets showing power-law regimes.
Burstiness and Openness
Burstiness (B) quantifies the variability of temporal events and is computed both at edge and system levels, incorporating finite-size corrections. Datasets span the full [0,1] burstiness interval, with median B=0.65. Openness (Ω), measured as the L1 distance between the residual time distribution and CCDF of IETs, captures the system’s distinction from closed Poissonian renewal dynamics. No significant correlation is found between burstiness and openness, evidencing distinct dynamical regimes irrespective of topological features.
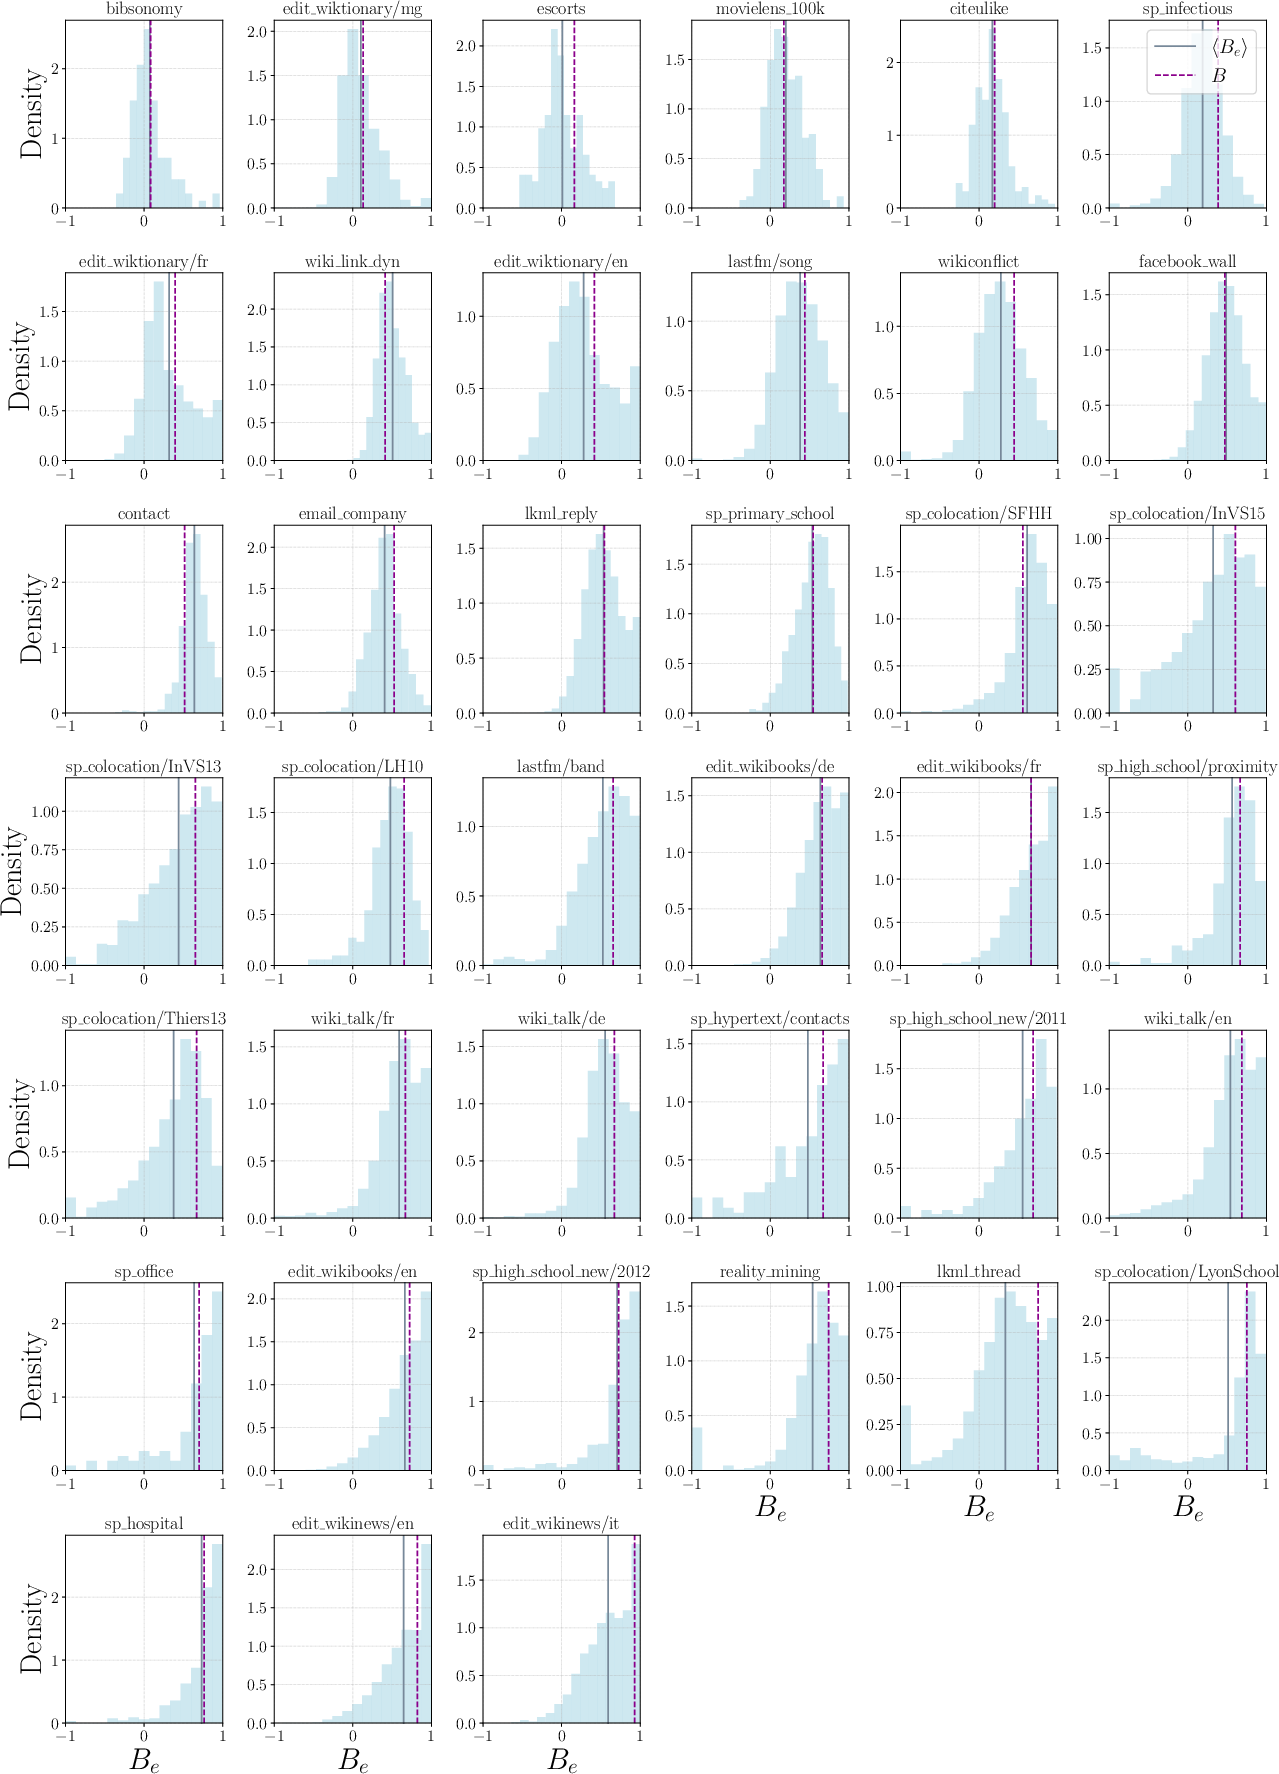
Figure 6: Distribution of edge burstiness for all datasets; dashed purple line indicates system burstiness.
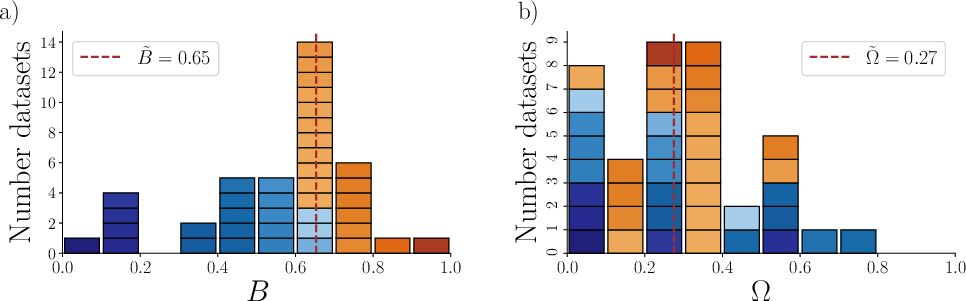
Figure 7: Distribution of datasets along burstiness and openness dimensions, with clear separation of groups.
Grouping by Dynamical Regime
Datasets are classified into four groups based on high/low burstiness and high/low openness, facilitating downstream comparisons on activation dynamics and aggregation effects. The classification is invariant to structural or domain-specific features, highlighting universal metrics emerging from empirical analysis.
Event Aggregation and Universal Time Scales
Edge and Node Activation Dynamics
The edge activation probability (P+) as a function of aggregation window scale (w∗0) and overlap (w∗1) reveals a universal bell-shaped curve: a maximally dynamic scale (w∗2) emerges where activation is highest. Overlap increases statistical reliability but leaves w∗3 invariant. Notably, openness shifts the activation probability curve toward wider windows, significantly affecting the attainable maximal dynamicity.
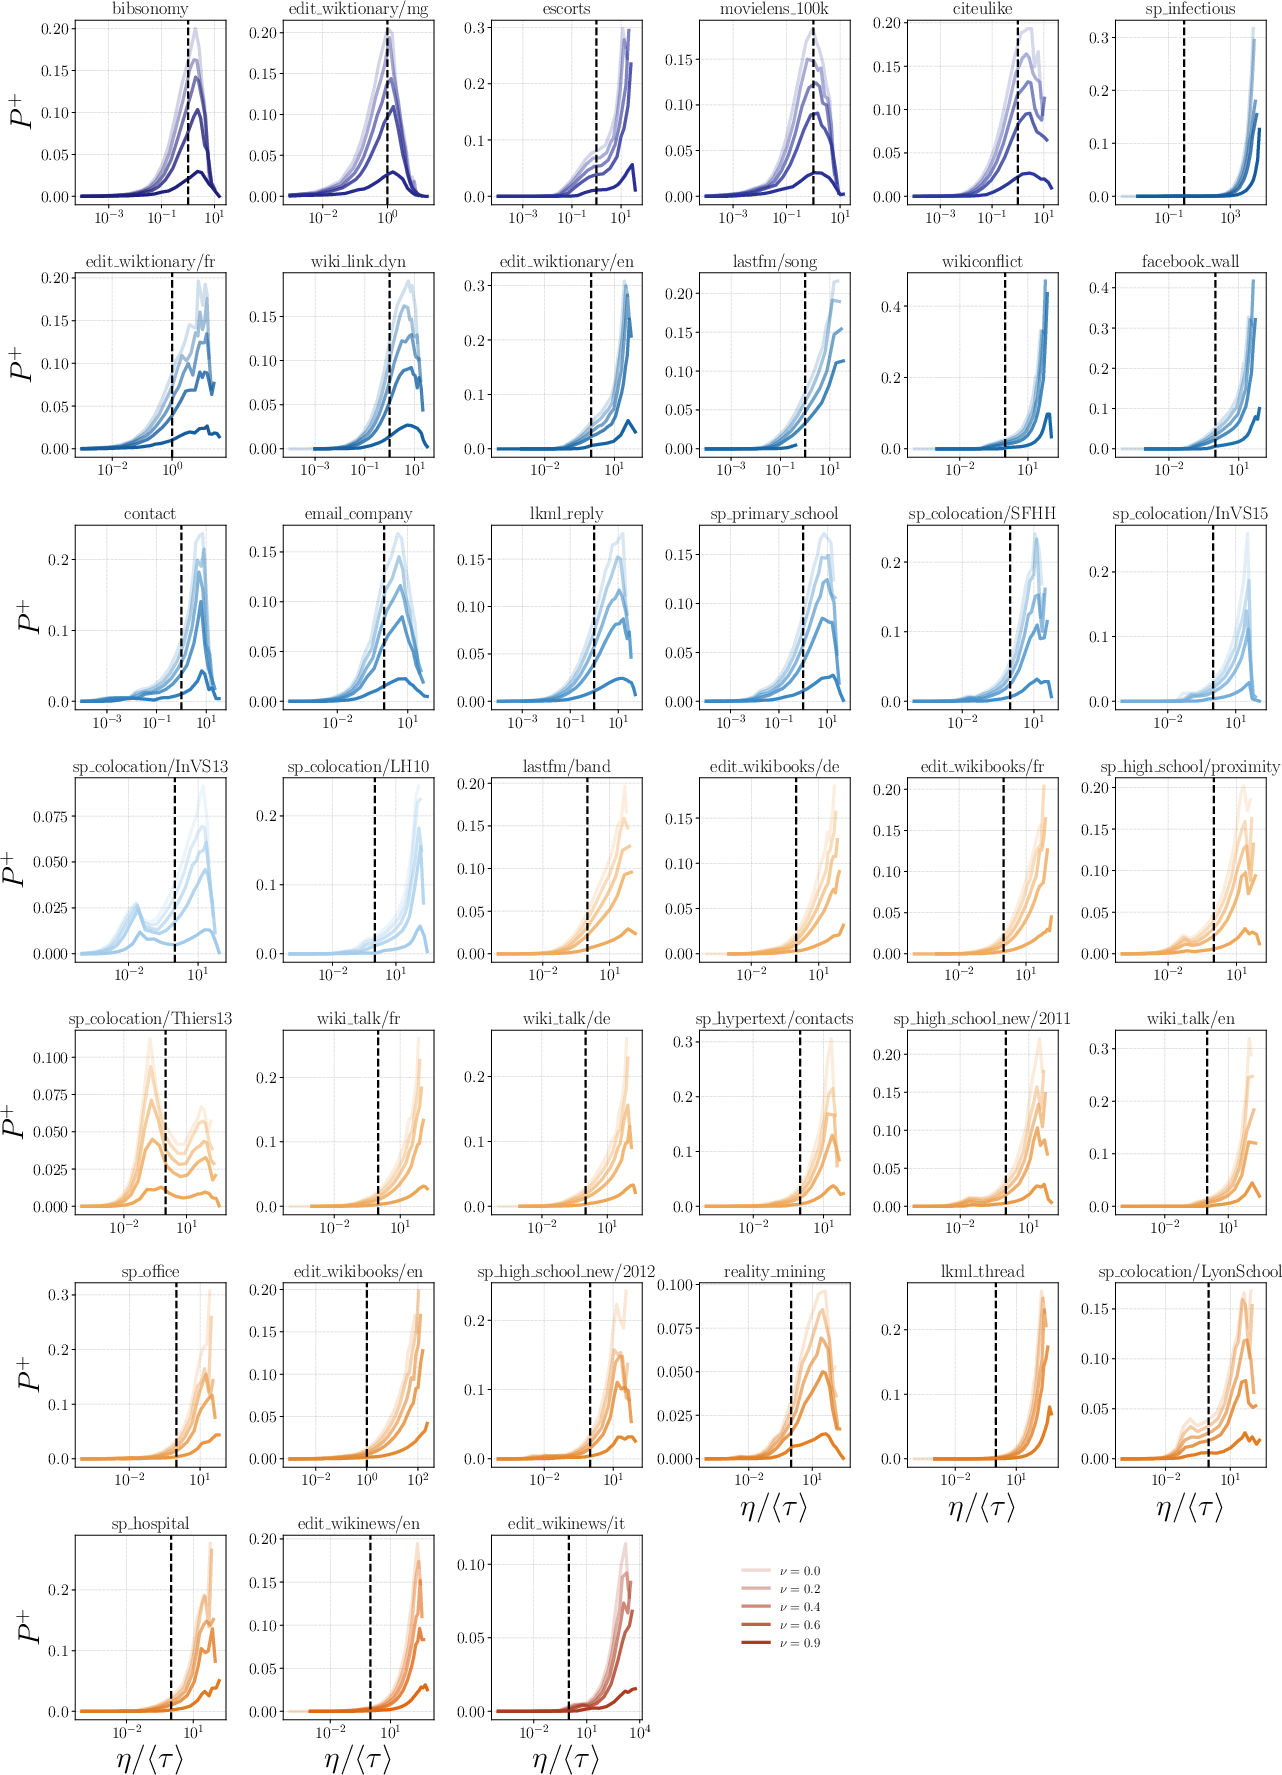
Figure 8: Mean edge activation probability vs. rescaled window width w∗4 for various fractional overlaps w∗5.
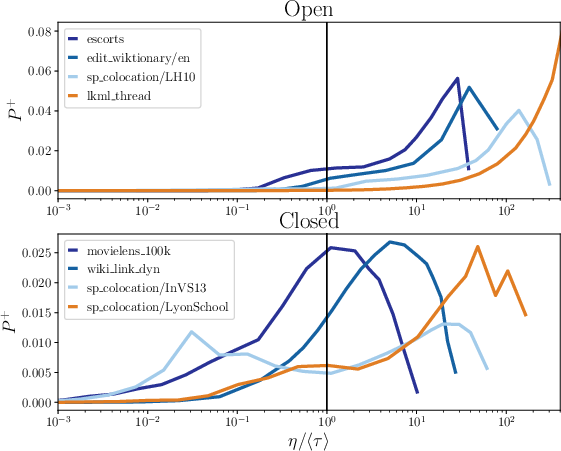
Figure 9: Effect of openness on activation probability curves at fixed burstiness.
Projection methods for bipartite datasets confirm qualitative robustness of activation probabilities to topological coarse-graining.
Activation-Deactivation Symmetry and Node-Level Effects
Activation and deactivation probabilities are symmetric under time reversal, becoming empirically identical upon adjustment for openness. Extension to node-level dynamics (coarse-grained over incident edges) maintains qualitative behavior, underscoring universality across aggregation levels.
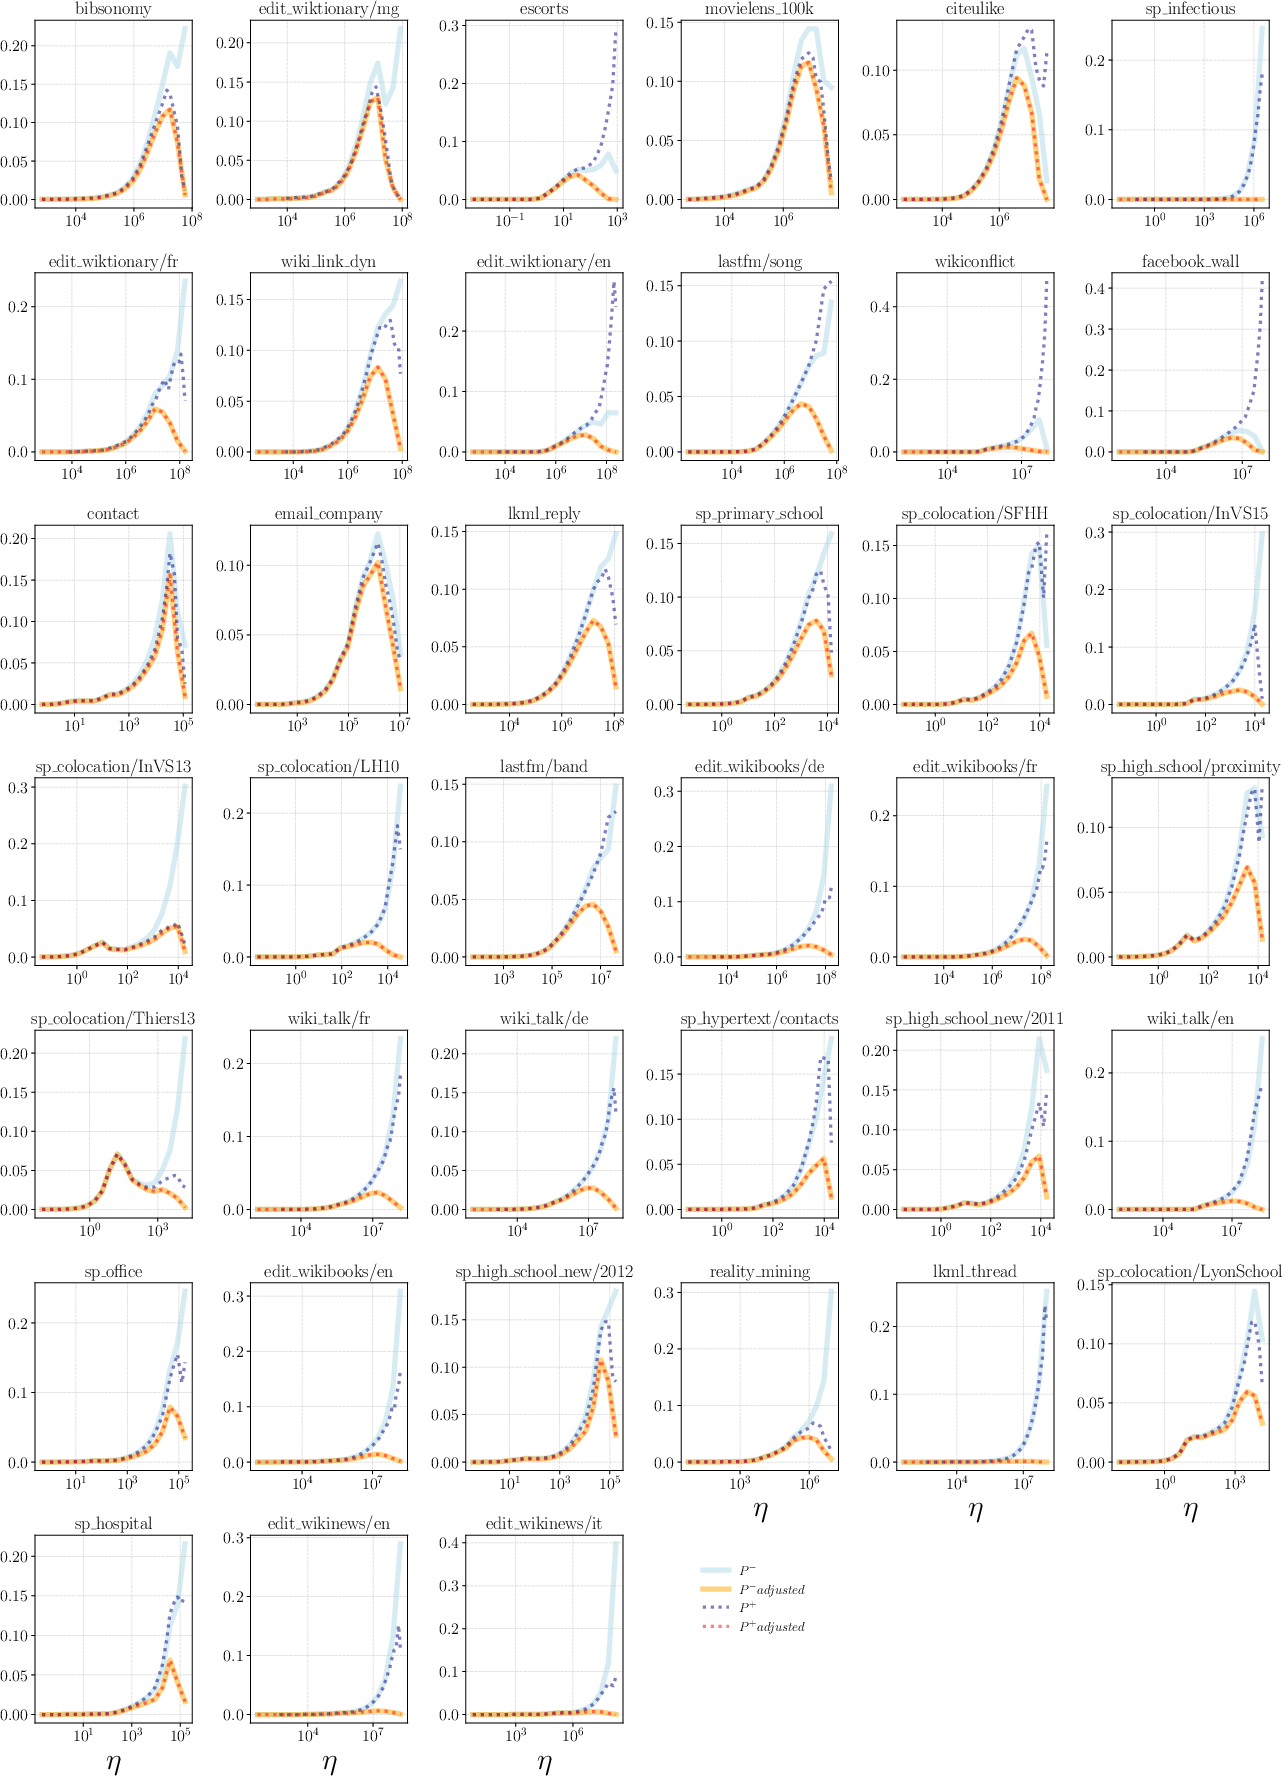
Figure 10: Adjusted activation and deactivation probabilities yield perfect symmetry after openness correction.
Aggregation Scale Comparison
Optimal aggregation scale (w∗6) for each dataset—numeric and analytical—often aligns with meaningful social or circadian rhythms, but empirical results highlight divergence from scales commonly used in prior literature. The scale at which the largest connected component (LCC) emerges (w∗7) is generally distinct from w∗8, revealing trade-offs between dynamism and connectivity.
Microscopic Regulation and Macroscopic Stability
Degree Change Dynamics
Analysis of degree change (w∗9) vs. degree across consecutive windows uncovers self-regulatory patterns: nodes with low (high) degree tend to gain (lose) connections, demonstrating negative feedback at local scales. This behavior is robust for broad parameter ranges and overlaps, with the fitted slope w∗=100 strictly negative and saturating for extreme overlap values.
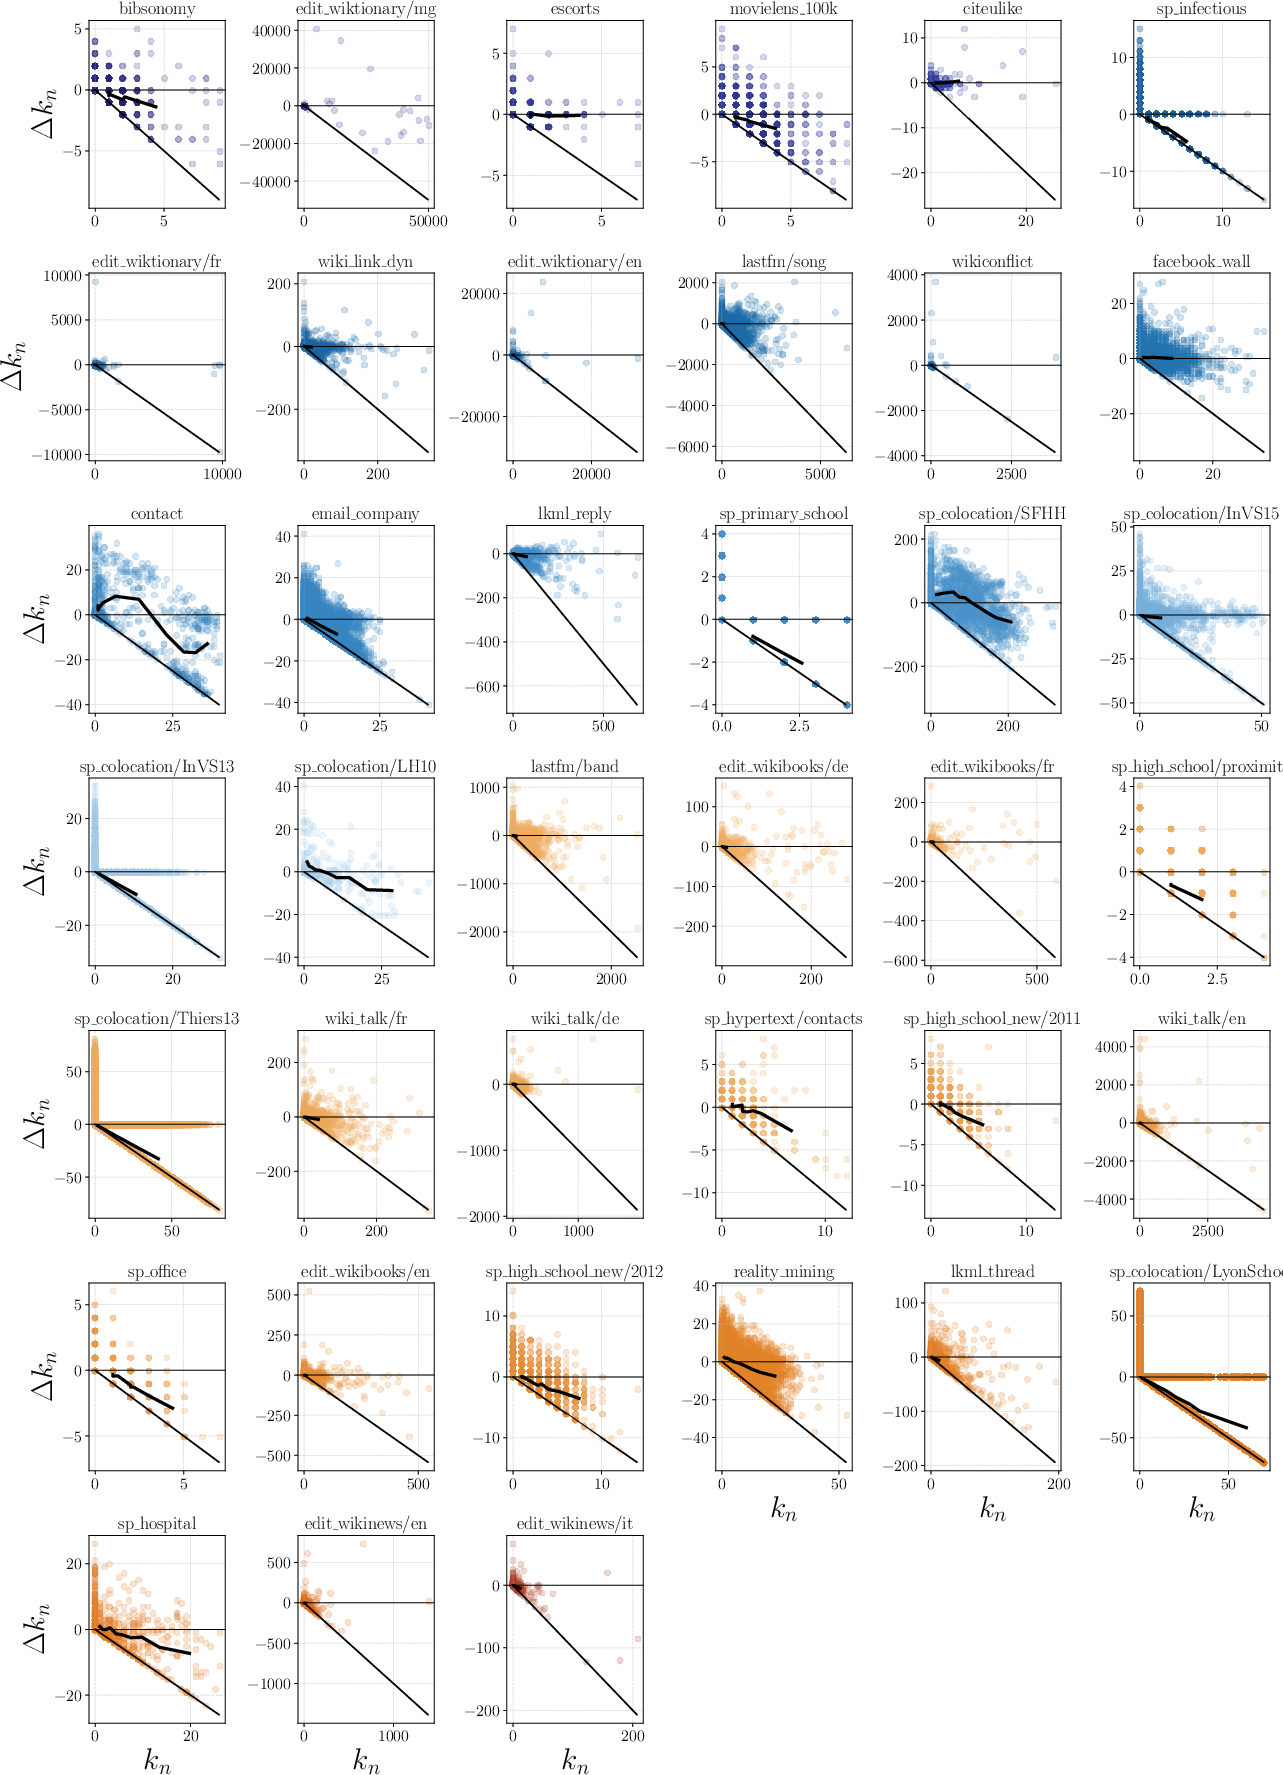
Figure 11: Degree change vs. degree, displaying self-regulatory trends across datasets.
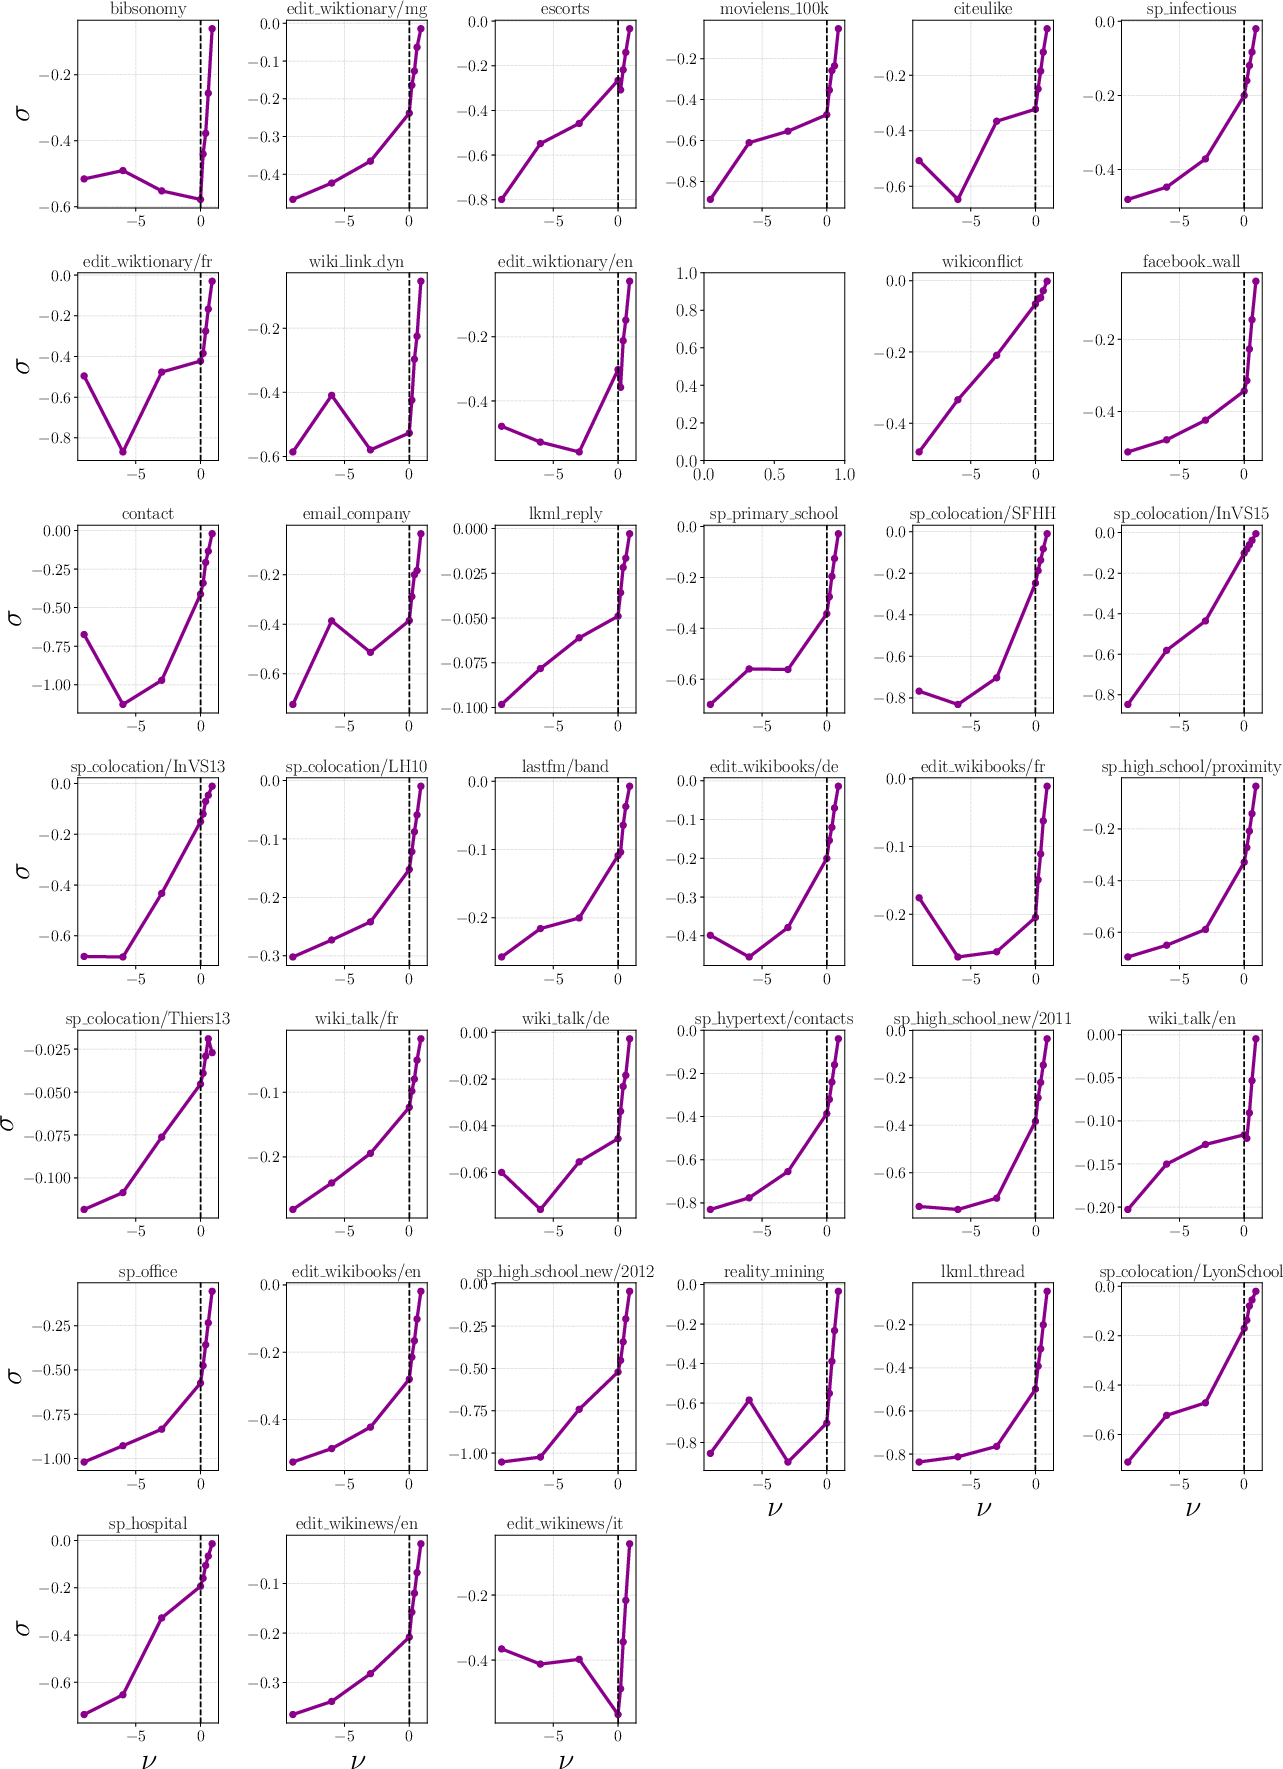
Figure 12: Fitted linear slopes of degree change vs. degree across overlap values, revealing regime transitions.
Empirical degree change distributions, peaked at zero with exponentially suppressed deviations, qualitatively match analytical binomial expectations but exhibit quantitative discrepancies reflecting edge activation correlations.
Cyclic Degree Trajectories
Node degree trajectories exhibit recurrent cyclic behavior in the w∗=101 plane, especially at optimal window scales and high overlap. Exceptions (e.g., email company dataset) reveal double cycles corresponding to weekly rhythm, distinguishing weekdays from weekends.
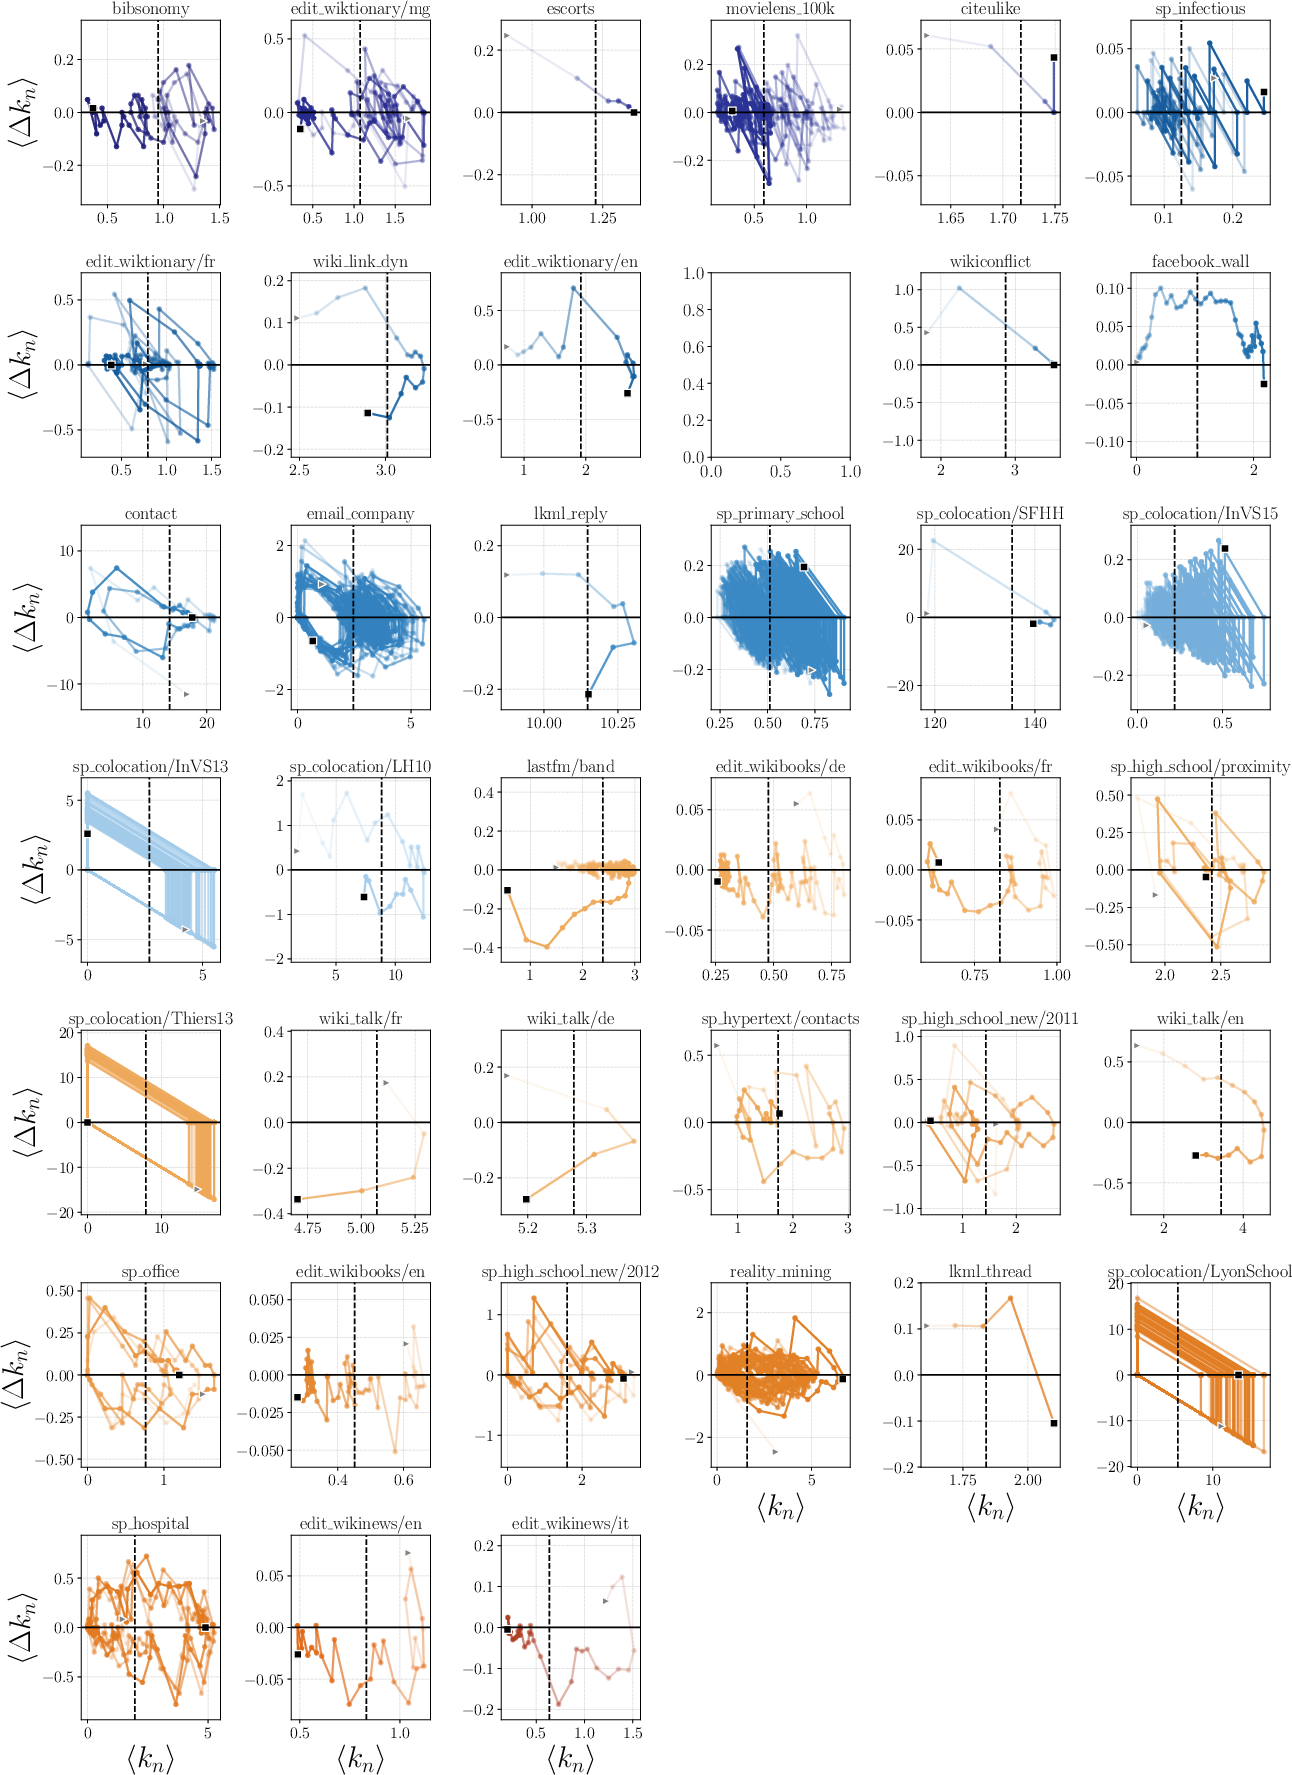
Figure 13: Mean population trajectories in w∗=102, evidencing cyclic recurrence.
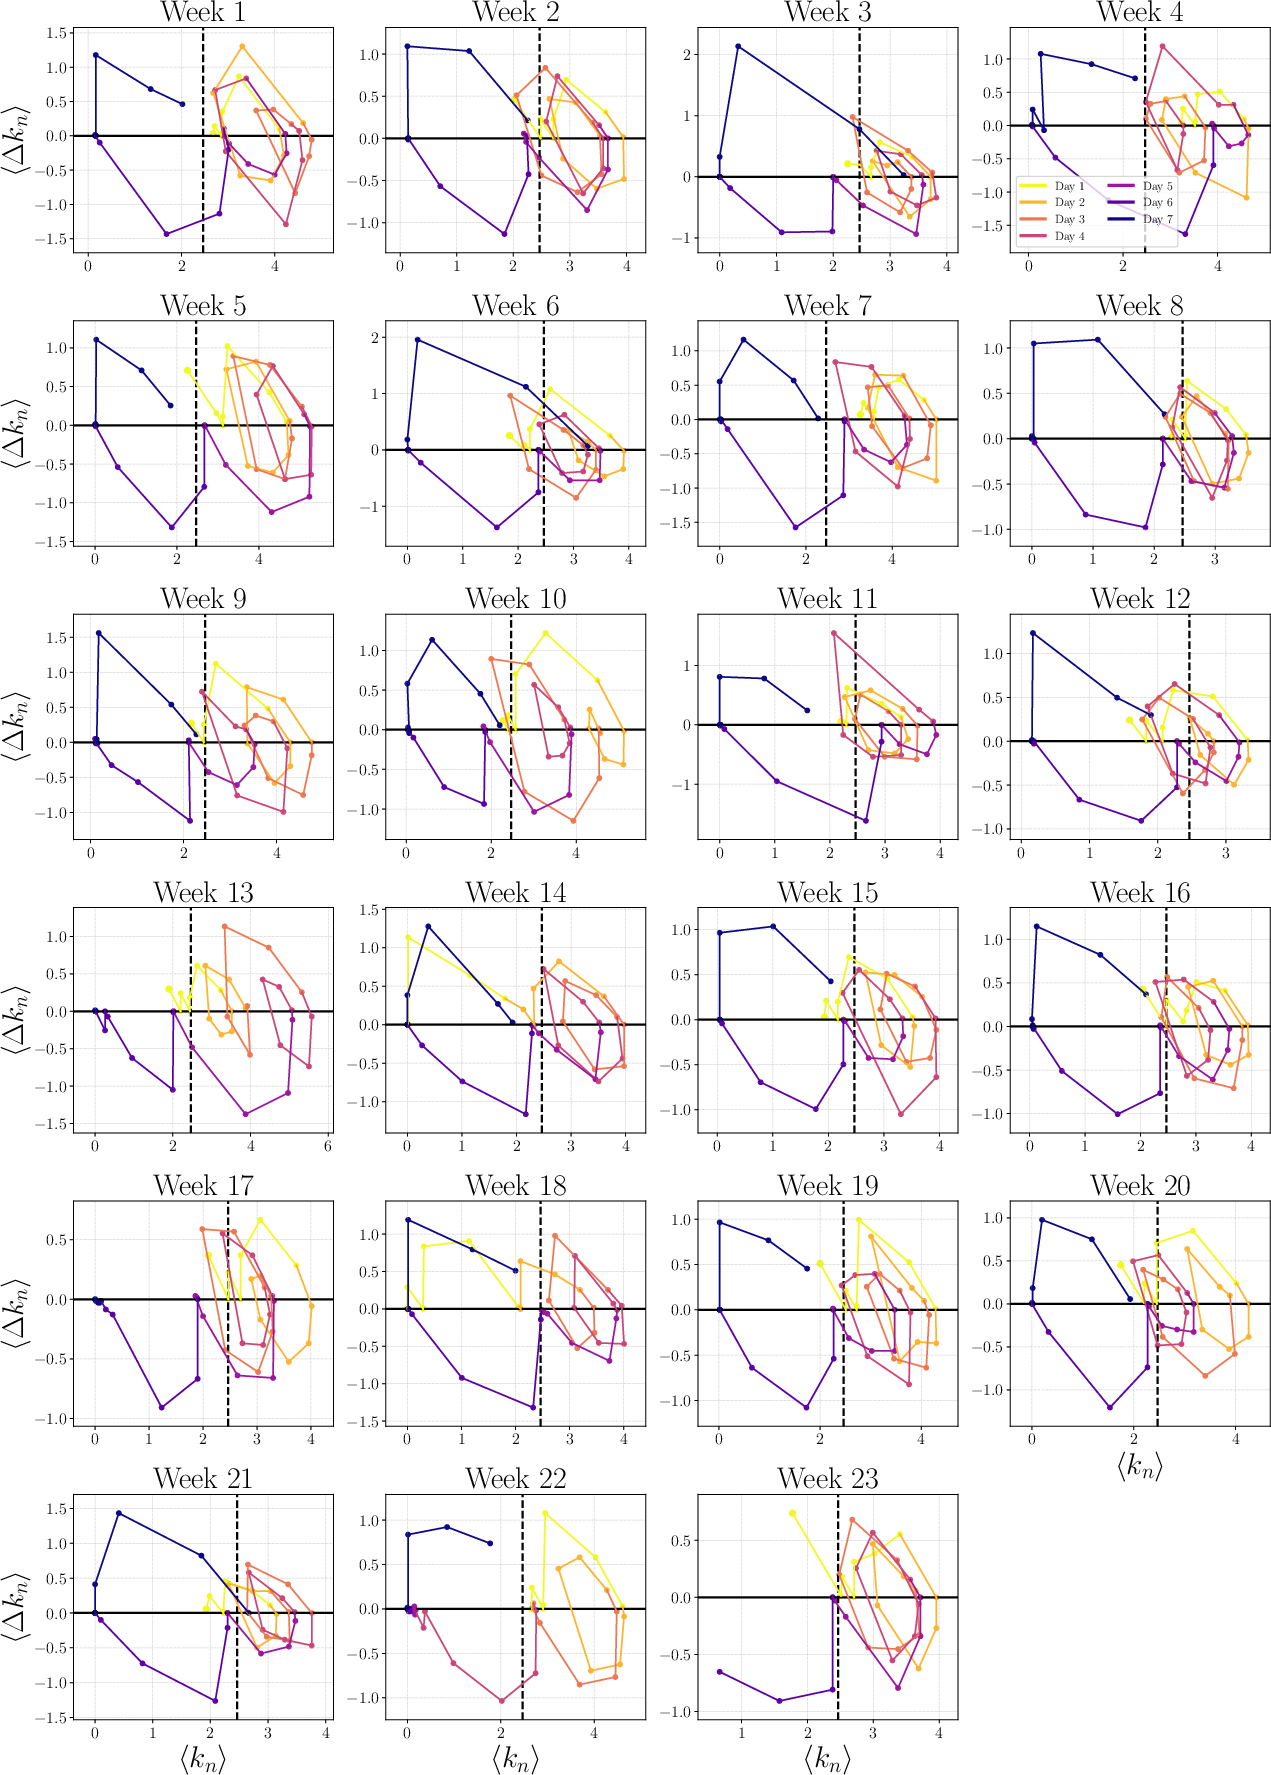
Figure 14: Anomalous double cycle in email company dataset, separating weekday/weekend dynamics.
Analytical Framework and Model Results
The renewal process-based temporal network model formalizes event dynamics over static topologies using empirically parameterized inter-event time and degree distributions. Analytical developments include convolutions and Laplace transforms for event distribution calculations, explicit forms for activation probability and optimal aggregation window, and percolation threshold (w∗=103) for LCC emergence. Both homogeneous (exponential IET and Poisson degree) and heterogeneous (Gamma IET, Zipf degree) cases are treated, showing that optimal aggregation scales and connectivity thresholds diverge with increasing heterogeneity.
Empirical datasets are generally well fit by Gamma IET distributions, though deviations occur in offline interactions, especially in tail behavior.
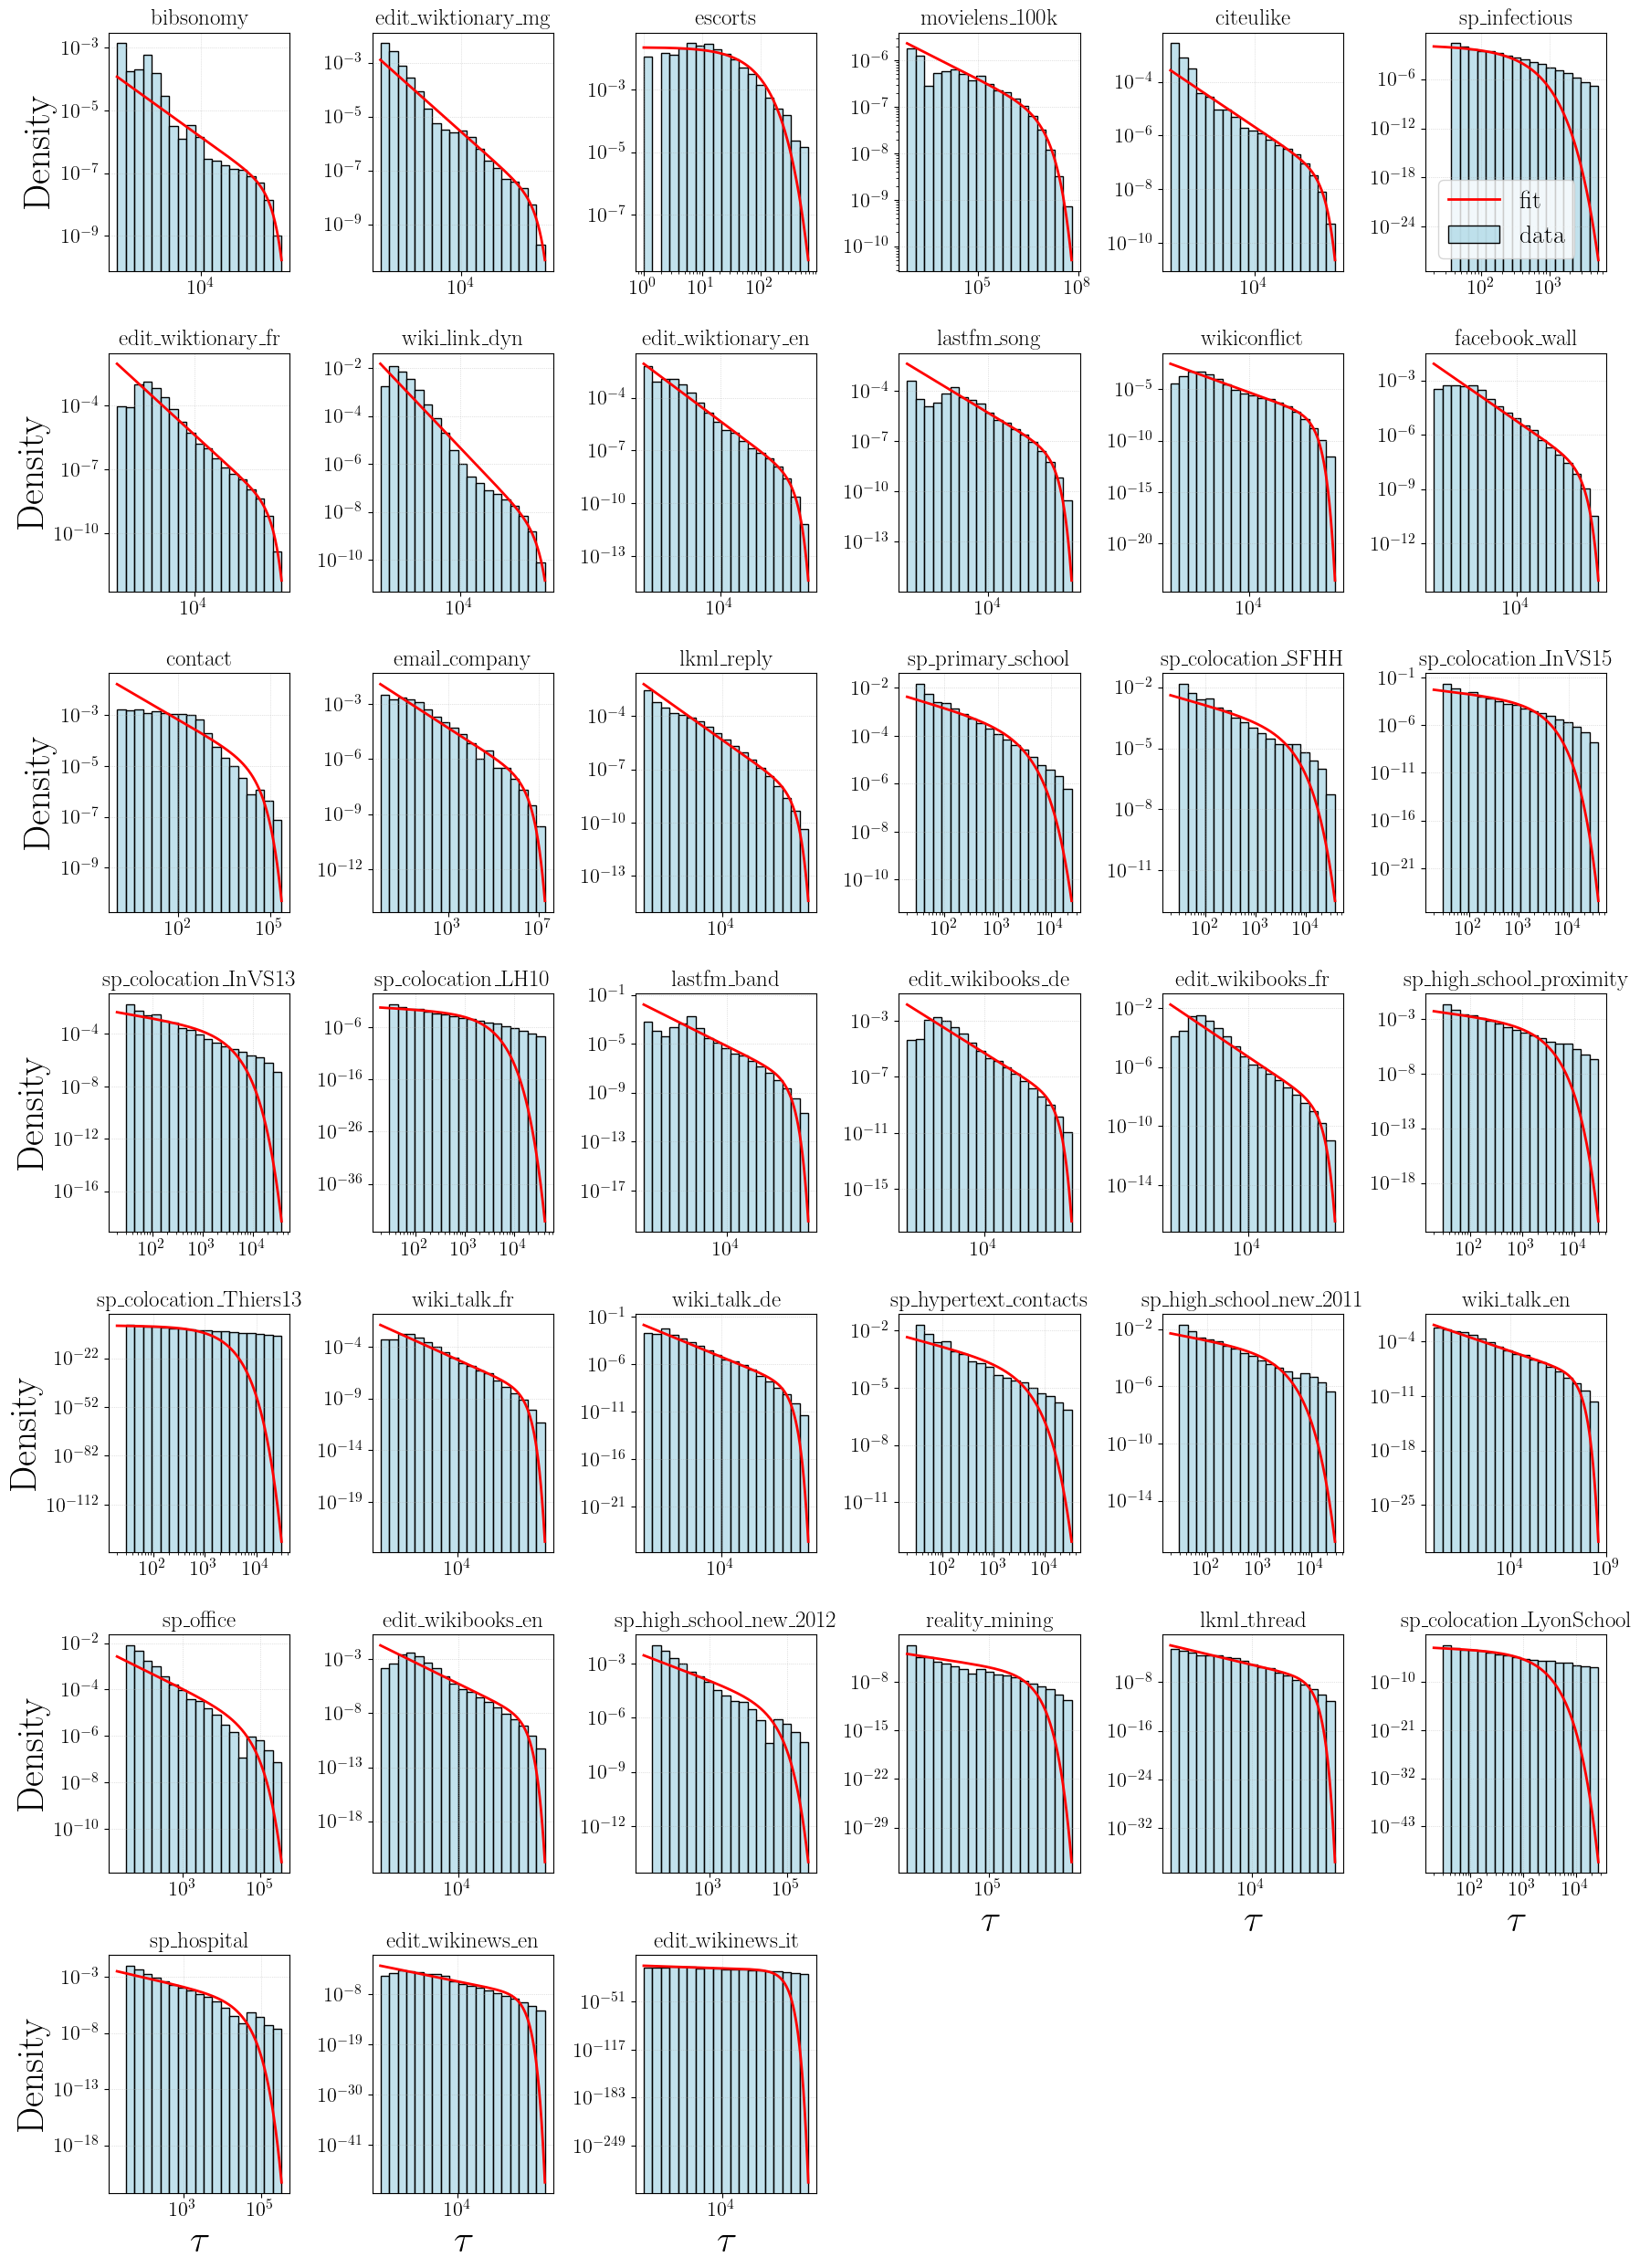
Figure 15: Empirical IET histograms and Gamma fits, with best agreement for Wikipedia datasets.
Implications and Future Directions
The demonstrated universality of the maximally dynamic aggregation scale (w∗=104), its analytical tractability, and its differentiation from percolation threshold (w∗=105) provide a principled methodology for temporal network analysis. Practical applications include setting aggregation windows for epidemiological modeling, social interaction studies, or communication analysis to maximize information on dynamical changes while preserving system-wide connectivity.
Theoretically, the findings motivate further generalization to correlated processes, heterogeneous topologies, and higher-order structures. Future work could expand to adaptive networks, multiplex dynamics, and interplay between burstiness, openness, and network controllability—crucial for understanding system resilience and criticality in complex temporal environments.
Conclusion
This paper establishes a unified quantitative framework linking topology and dynamics in temporal networks, by introducing universal time scales for aggregation dependent on empirical burstiness and openness measures. The results, grounded in broad empirical evidence and reinforced by renewal process models, offer actionable insights for setting aggregation parameters, understanding self-regulation, and analyzing global connectivity—all critical for advancing both applied and theoretical research on temporal systems.