- The paper demonstrates that a risk-aware, sequential POMDP framework integrating Bayesian updates significantly improves transit desert remediation compared to static planning.
- It shows that incorporating equity-weighted objectives and CVaR risk minimization substantially enhances resource allocation efficiency under uncertain, latent demand.
- Empirical tests across 25 cities reveal robust gains in coverage and cost efficiency, even under varying budgets and miscalibrated demand priors.
Problem Context and Motivation
Transit deserts—urban areas with public transportation access grossly inadequate for resident mobility needs—are widespread, affecting tens of millions in the Americas, with disproportionate impact on low-income and carless households. Conventional approaches to planning transit expansion, such as four-step travel demand models, fundamentally rely on observed ridership or derivative demand signals that are non-existent in unserved zones. This epistemic uncertainty leads agencies to favor expansion in locations with well-characterized demand, perpetuating inequitable service provision.
The paper "Risk-Aware Planning for Transit Desert Remediation Under Demand Uncertainty" (2606.08371) advances an empirical planning framework that integrates risk sensitivity and sequential learning into capital allocation decisions for transit desert remediation. The proposed method formalizes the city-scale resource allocation problem as a POMDP, explicitly modeling latent demand, observational feedback through new ridership signals, and financial tail risk in a unified, equity-weighted objective.
The core methodological contribution is the construction and empirical evaluation of a belief-aware, risk-constrained planning model:
- POMDP Representation: The state captures current service coverage, annualized budget, and a latent vector of per-zone transit demand. Actions are continuous budget allocations across city tracts, subject to annual capital limits. Observations consist of noisy realized ridership in newly served zones, while unserved tracts yield no additional signal, reinforcing the need to learn through deployment.
- Demand Prior and Bayesian Updating: Initial beliefs over tract-level demand are set via log-normal priors, with means parameterized by population, employment, median income, and car-access covariates. Spatial distance to existing transit modulates prior variance, capturing information sparsity at the network edge. Posterior updates use conjugate Bayesian inference as new ridership observations accrue.
- Financial and Equity Objective: The planner maximizes the gain in equity-weighted coverage (with weights inverse to median income), penalized by CVaR on net subsidy to control for financial shortfall in adverse demand scenarios. CVaR is computed at the 10th percentile, implementing tail-risk aversion in capital planning.
- Planning Algorithm: The solution proceeds via a myopic (one-step lookahead) belief planner augmented with an explicit information-value bonus proportional to zonal demand variance. The per-period problem is solved by sample-average approximation and linear programming, tractable even at full city scale.
- Baselines: Comparative evaluation includes a deterministic static planner using prior mean demand (strongest practical baseline without updating), a greedy coverage allocator, and a random policy as a lower bound.
Empirical Benchmarking: Data, Scope, and Results
The model is empirically grounded with data from 25 North and South American cities, covering a range of metropolitan scales, geographies, densities, and existing transit network maturities. All cities are represented via GTFS for transit topology, OSMnx for urban morphology, and granular tract-level U.S. Census microdata or analogs for non-U.S. contexts.
The experimental protocol instantiates the planning pipeline in the InfraLib framework, extracting zone geometries, computing accessibility metrics for desert identification, and simulating five annual allocation periods per city with Monte Carlo sampling of latent demand.
Spatial Patterns of Transit Deserts
Transit deserts are systematically concentrated in low-income and peripheral urban tracts, as evident in Chicago and across the 25-city benchmark.
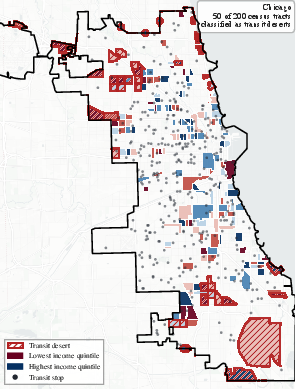
Figure 1: Chicago transit desert map: tracts classified as deserts are concentrated in the South/West side and low-income periphery.
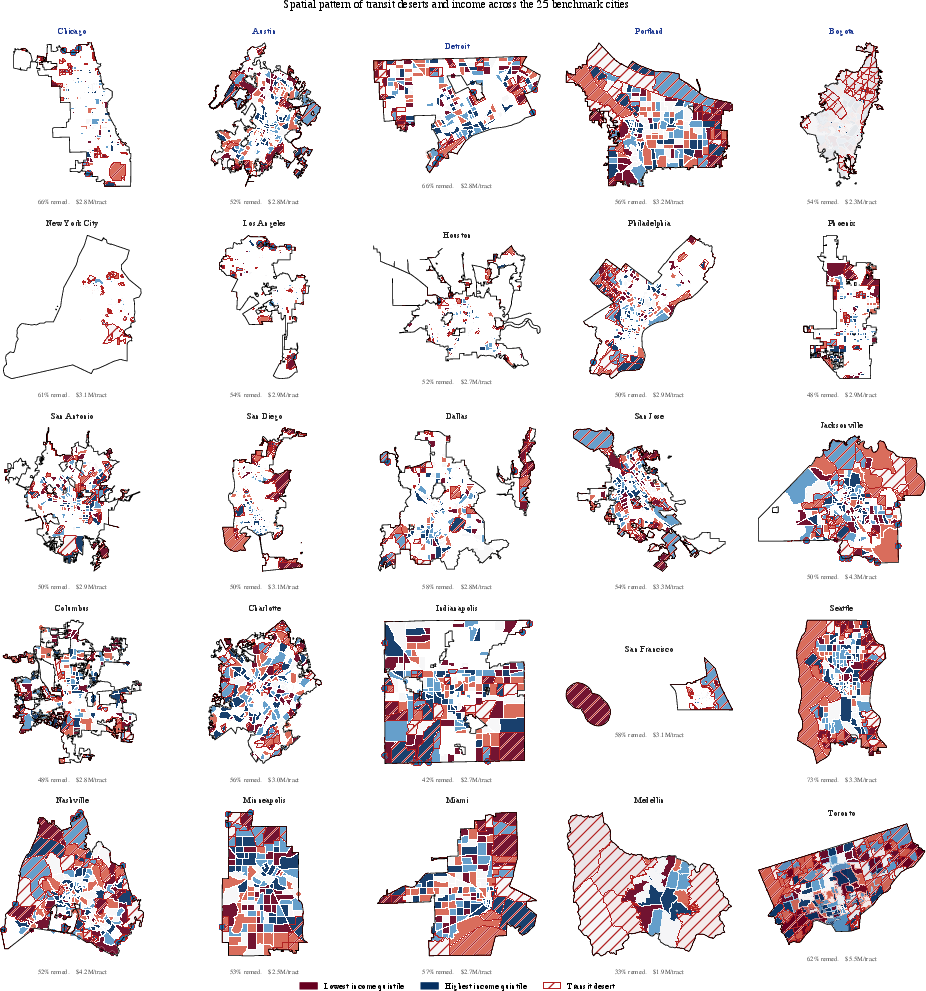
Figure 2: Spatial distribution of deserts and income across all cities: deserts consistently align with the lowest-income quintile across diverse urban forms.
Cost and Structural Determinants
Remediation cost per tract varies by more than 2× across the sample, with compact, high-density cities like Chicago and San Francisco achieving remediation at lower cost due to network extensibility, while Sun Belt sprawl (e.g., Phoenix, Houston) requires costlier expansions.
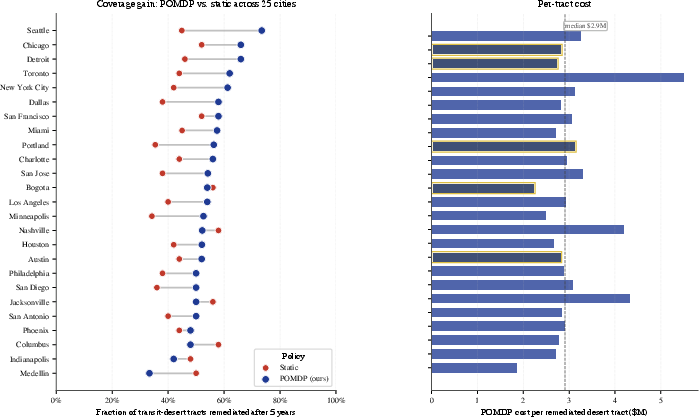
Figure 3: Cross-city benchmarking of coverage gains (POMDP vs. static) and per-tract remediation cost.
Population density is the strongest single predictor of per-tract cost, with a doubling in density reducing cost by roughly 30% (R2=0.41). Cost-of-living index is a secondary predictor, while the share of zero-vehicle households is weakly associated.
Sequential Planning vs. Static Baselines
The sequential POMDP planner exhibits consistent advantages over static allocation:
Notably, ablation of the explicit information-value bonus has only a minor effect, indicating that the main benefit arises from Bayesian updates on actual ridership rather than from exploration incentives.
Sensitivity and Generalization
Adaptive planning's benefits are budget-dependent, peaking when there is enough flexibility to apply information but not enough to saturate all tracts. At extreme low or high budget, the gap relative to static narrows significantly.
The POMDP approach remains robust to degraded initial demand models, maintaining nearly flat coverage while static approaches sharply degrade with noise. This demonstrates the value of a sequential, feedback-aware allocation process even when pre-existing data are poor.
Implications, Limitations, and Future Directions
This work provides a computationally tractable, empirically validated framework for risk-aware, adaptive transit investment under deep demand uncertainty. For agencies, it demonstrates that early deployments can be systematically exploited as demand probes, efficiently steering resources even without high-fidelity priors. The integration of explicit equity weighting in the objective ensures that adaptation does not drift from distributive justice goals.
Limitations include the use of a log-linear demand model (not capturing induced demand), reliance on national average costs where local data is unavailable, and omission of induced behavioral and regulatory constraints in planning. Extensions to incorporate induced ridership, multimodal substitution, and exogenous political feasibilities would further enhance practical realism.
Retrospective validation against actual transit expansions, and sensitivity of recommendations to the normative setting of equity weights, constitute promising avenues for both methodological and policy-driven research.
Conclusion
The study rigorously demonstrates that risk-aware, belief-updating sequential planners for transit desert remediation can substantially outperform static deployments, not only in coverage and efficiency but in the robustness of resource utilization, particularly under uncertain and noisy demand environments. These results support a policy shift towards explicit adaptive capital allocation strategies in public transit planning, with equity and risk sensitivity embedded at the algorithmic level (2606.08371).


