- The paper introduces a novel unbiased policy gradient estimator using order statistics to directly optimize non-mean, distribution-sensitive objectives.
- It leverages finite-sample L-statistics and precomputed combinatorial weights to efficiently target metrics like VaR, CVaR, and Top‑K performance.
- Empirical results demonstrate improved exploration, risk control, and robustness in LLM post-training, portfolio management, and robust regression tasks.
OrderGrad: Optimizing Beyond the Mean with Order-Statistic Policy Gradient Estimation
Motivation and Theoretical Foundation
Traditional policy-gradient methods in RL and LLM post-training are restricted to optimizing the expected return, compressing the reward distribution into a single scalar metric. This paradigm is suboptimal in applications where the reward distribution’s higher-order characteristics—such as tail risk, robustness, quantile behavior, or best-of-K performance—are operationally relevant, including safety-critical scenarios, robust learning under label corruption, and post-training for sampling strategies in generative models.
OrderGrad introduces a general class of unbiased, distributional policy gradient estimators rooted in order statistics. By leveraging finite-sample L-statistics—weighted averages of sorted rewards—OrderGrad enables direct optimization of objectives such as VaR, CVaR, trimmed means, medians, and Top-M/best-of-K selection. The key observation is that rank weights can specify an arbitrary distributional criterion over the reward sample, and a simple transformation of rewards suffices to adapt standard LR or RP estimators to these non-mean objectives.
OrderGrad’s gradient estimators are formalized for both likelihood-ratio (LR) and reparameterization (RP) settings, providing unbiasedness for any rank weight and sample size configuration. The method’s computational complexity is governed by a single sort and linear scan, with batch operations scaling as O(NlogN).
The central formula for the L-statistic objective, over a sample of k rewards {Ri}, is:
Jk,α(θ)=E[j=1∑kαjR(j:k)]
where R(j:k) is the jth order statistic, and α denotes the rank-weight vector. The selection of M0 places optimization emphasis across distributional features of the reward.
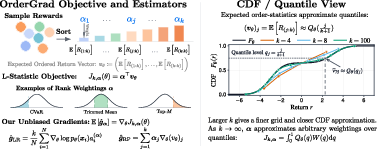
Figure 1: OrderGrad transforms reward samples into rank-weighted objectives, supporting various distributional criteria via the choice of rank weights.
The unbiased LR and RP estimators for order-statistics employ batch-level inclusion-exclusion combinatorics. Batch values, include-one values, and leave-one-out values are defined as subset averages over the sample batch. The batch advantage for each datapoint is computed as the difference between the include-one and leave-one-out values, linearly combined according to M1. For runtime efficiency, weight tables for all required combinatorial events are precomputed, and the bulk of computation is amortized across batches.
Diagnostic experiments confirm that, with practical batch sizes (M2), the additional wall-clock cost of OrderGrad’s reward transformation is negligible relative to the overall iteration time.
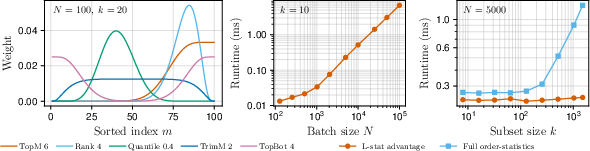
Figure 2: Runtime scaling and visualization of different rank-weight choices for M3 demonstrate negligible computational overhead and expressive objective specification.
Variance, Bias, and Signal-to-Noise Analysis
Empirical investigation into the bias and variance properties of the LR and RP estimators demonstrates that increasing the sample size M4 improves the fidelity of the gradient to the underlying distributional objective (e.g., CVaR) at the expense of estimator variance. For Top-M5@M6 objectives, larger M7 smooths the estimator and yields a favorable bias-variance tradeoff.
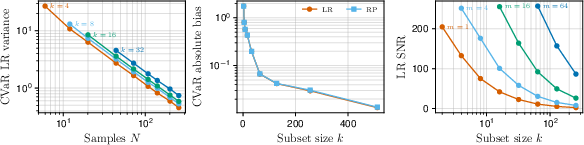
Figure 3: Gradient variance and bias analysis for order-statistic objectives; signal-to-noise improves with judicious selection of M8 and M9.
Application to LLM Post-Training: Improved Pass@K0 and Controlled Exploration
OrderGrad is evaluated on math reasoning tasks for LLMs, using Qwen2.5-Math-7B and Qwen3-4B-Base. The primary deployment metric is pass@K1 (the probability that at least one of K2 samples yields a correct solution).
- OrderGrad with Top-K3@K4 objectives improves pass@K5 over both Max@K6 (best-of-K7; previous SOTA for sampling-oriented objectives) and GRPO baselines, especially in the large-K8 regime. Notably, OrderGrad avoids the diversity collapse characteristic of conventional mean-based RL, maintaining sample diversity and hence pass@K9 performance as O(NlogN)0 increases.
- The hyperparameter analysis shows that increasing O(NlogN)1 encourages broader exploration (improved large-O(NlogN)2 pass@O(NlogN)3, but lower pass@O(NlogN)4), while increasing O(NlogN)5 (number of top samples averaged) improves small-O(NlogN)6 performance, highlighting a tunable exploration-exploitation tradeoff.
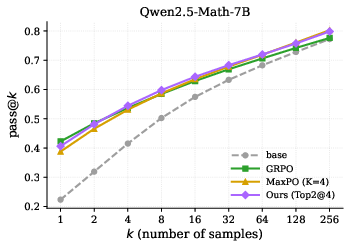
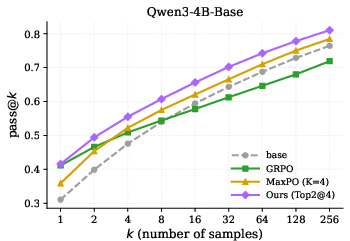
Figure 4: The effect of Top-O(NlogN)7@O(NlogN)8 objectives on Qwen2.5-Math-7B pass@O(NlogN)9; OrderGrad attains higher accuracy for large k0 and mitigates diversity collapse.
Multi-Reward Objective and Response Length Control
OrderGrad’s flexibility allows independent distributional criteria for multiple reward signals. Experiments combining correctness reward (optimizing Top-k1) and a length penalty (optimizing Bottom-k2, i.e., discouraging particularly long responses) demonstrate that a naive scalarization (e.g., GRPO) leads to degenerate output (severely shortened and poor performance), while OrderGrad successfully controls response length without sacrificing correctness, mitigating overthinking in LLM output.
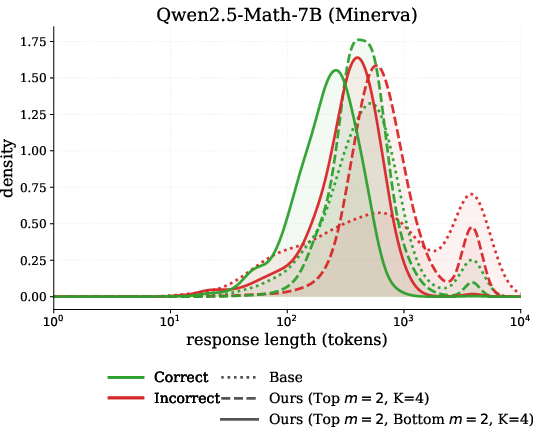
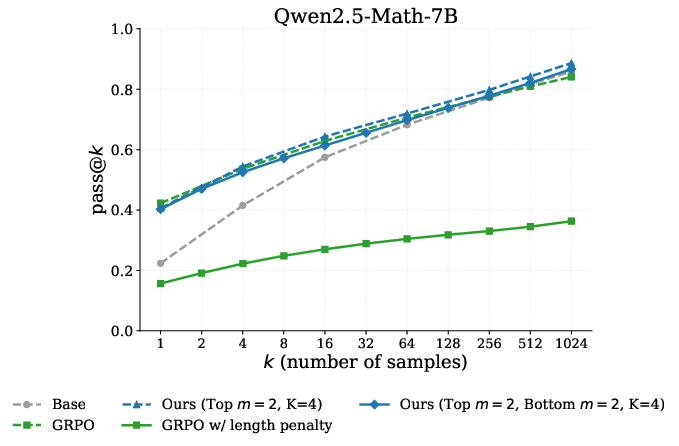
Figure 5: Response length distribution analysis: OrderGrad suppresses extreme output lengths and reduces overthinking on incorrect samples.
Portfolio Risk Management and Robust Regression Illustrations
OrderGrad demonstrates its generality in non-LLM domains:
- Static portfolio allocation with OrderGrad-CVaR: Standard REINFORCE maximizes expected return, leading to excessive allocation to high-yield, tail-risk assets and frequent large losses. OrderGrad with a lower-tail CVaR objective reallocates toward more balanced and defensively-hedged portfolios, substantially improving reliability metrics (e.g., worst-case drawdown, loss probabilities) despite a moderate reduction in mean return.
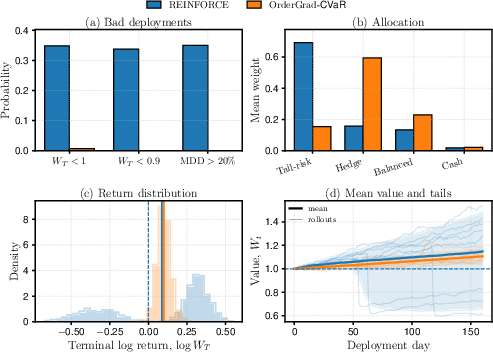
Figure 6: High-yield tail-risk trading—OrderGrad-CVaR yields superior reliability, shifting portfolio weights and reducing catastrophic outcomes compared to mean-return optimization.
- Robust regression: Training linear regression under label corruption with an order-statistic (median/trimmed) objective recovers clean-data parameters and outperforms the mean-squared-error loss, validating the efficacy of L-statistic-based training under distribution shift or contamination scenarios.
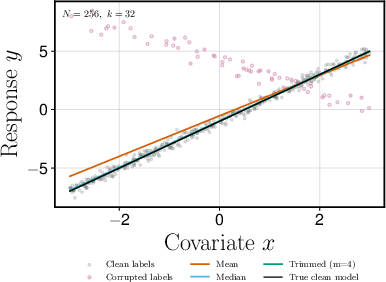
Figure 7: Fitted regression lines—trimmed objective recovers the clean ground truth, highlighting OrderGrad’s robustness to label noise.
Policy Optimization in RL with Controlled Exploration
OrderGrad is instantiated in on-policy PPO for MinAtar environments, demonstrating that Top-k3@k4 objectives modulate exploration without explicit entropy regularization. Tuning k5 provides precise control over the exploration-exploitation spectrum, as reflected by the policy entropy dynamics and aggregate task returns. Empirically, k6 achieves the best normalized aggregate performance, with smaller k7 maintaining persistent exploration and larger k8 accelerating entropy decay.
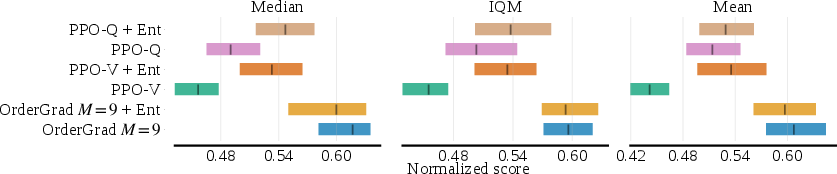
Figure 8: Aggregate MinAtar performance—OrderGrad PPO with intermediate k9 outperforms value- and standard Q-based PPO in the absence of explicit entropy bonuses.
Visualization of Weight Schemes
OrderGrad's expressive power is further evidenced by its support of a wide range of rank-weight schemes via L-statistics, from Top-{Ri}0/Bottom-{Ri}1, quantile objectives, trimmed and winsorized means, to signed schemes such as the Gini mean difference. Visualization of these profiles clarifies their influence on the optimization target.
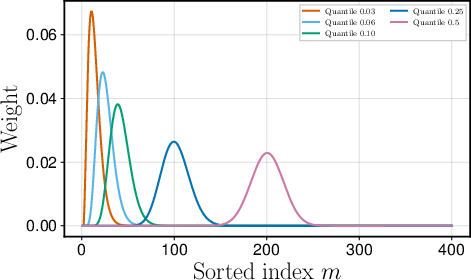
Figure 9: Quantile weight profiles—OrderGrad can focus optimization on arbitrary quantiles (e.g., median, lower-tail), controlled via {Ri}2.
Theoretical and Practical Implications
OrderGrad offers a unified and extensible framework for direct optimization of deployment-aligned metrics in both RL and generative modeling. Unlike mean-return or value-based methods, OrderGrad’s capacity to optimize arbitrary monotonic, robust, and tail-focused objectives enables a broad spectrum of distributional design choices. The decomposition of algorithmic contributions (LR, RP, combinatorial batch operations) ensures unbiasedness and practical computational feasibility. Empirically, OrderGrad consistently achieves better tradeoffs when there is objective mismatch between training and deployment, and exposes a novel mechanism to control sample diversity, risk, and robustness in deep models.
There remain limitations: optimal calibration of {Ri}3 and {Ri}4 involves explicit tradeoffs between estimator variance and alignment with extreme deployment metrics; extensions to off-policy data and reward miscalibration require further investigation. Additionally, stability in ill-posed or heavily multimodal regimes and under reward-model mis-specification remains an open area.
Conclusion
OrderGrad generalizes policy-gradient optimization to arbitrary order-statistic objectives, offering a modular, computationally efficient route to robust, risk-aware, and exploratory learning. Its practical implementations in LLM post-training, robust regression, portfolio management, and RL demonstrate superior deployment performance, improved sample diversity, and resilience to objective misspecification. The method’s generality suggests significant further applications wherever mean-based objectives fail to capture operational desiderata, motivating future study into scalable and off-policy extensions, richer reward structure modeling, and principled deployment-selection frameworks.