- The paper establishes that for independent sensors, the Shapley value is equivalent to using the marginal classifier score, yielding identical error probabilities.
- It rigorously derives analytical proofs for independent and dependent sensor scenarios, demonstrating how sensor correlation alters decision boundaries.
- Empirical simulations validate the theory and suggest an adaptive hybrid approach combining both methods for enhanced performance in correlated settings.
Statistical Analysis of Shapley Value for Sensor Anomaly Localization with Accurate Classifiers
Introduction and Motivation
This paper provides a rigorous statistical investigation into the efficacy of the Shapley value as a feature attribution mechanism for sensor anomaly localization, under the realistic and practically meaningful assumption that optimal (Bayes-optimal) binary classifiers are used in the Shapley value calculation. Although the Shapley value is widely adopted in ML explainability and recent works have advocated its use in the context of anomaly localization, its theoretical statistical performance—particularly in comparison to using a single classifier output directly—lacks in-depth study. This work addresses that gap, providing both mathematical proofs and empirical results across independent and dependent observation regimes.
Consider N sensors each providing a scalar observation x1,...,xN. The task is to localize which sensor(s) are anomalous or under attack. The Shapley value for each sensor is computed using a set function v(⋅) representing the output of a soft classifier, engineered here as the log-likelihood ratio (i.e., the Bayes-optimal classifier). Sensor i’s Shapley value is then computed via a summation over all subsets S not containing i, giving a computational complexity that is exponential in N. The alternative is simply to use v(i), i.e., the optimal anomaly score for xi marginally.
Analytical Results: Independent Sensors
The central result for independent observations is that the Shapley value and the marginal classifier test are provably identical in separation power. Theorem III.1 formalizes this: the decision regions for ϕ(xi) and x1,...,xN0 thresholds are equivalent, implying identical error probabilities.
This result has significant practical implications: Shapley value, despite its popularity and theoretical appeal, adds no additional localization power over using x1,...,xN1 for independent sensors—but requires exponentially more computation.
Analytical Results: Dependent Sensors
When sensor observations are not independent, the analytical results are substantially different. The paper demonstrates (Theorems III.3–III.5) that for several widely encountered dependent distribution scenarios—specifically, bivariate Gaussian and bivariate Laplacian settings with additive and Gaussian attack models—the Shapley value test and the marginal classifier test yield distinct decision regions and error probabilities.
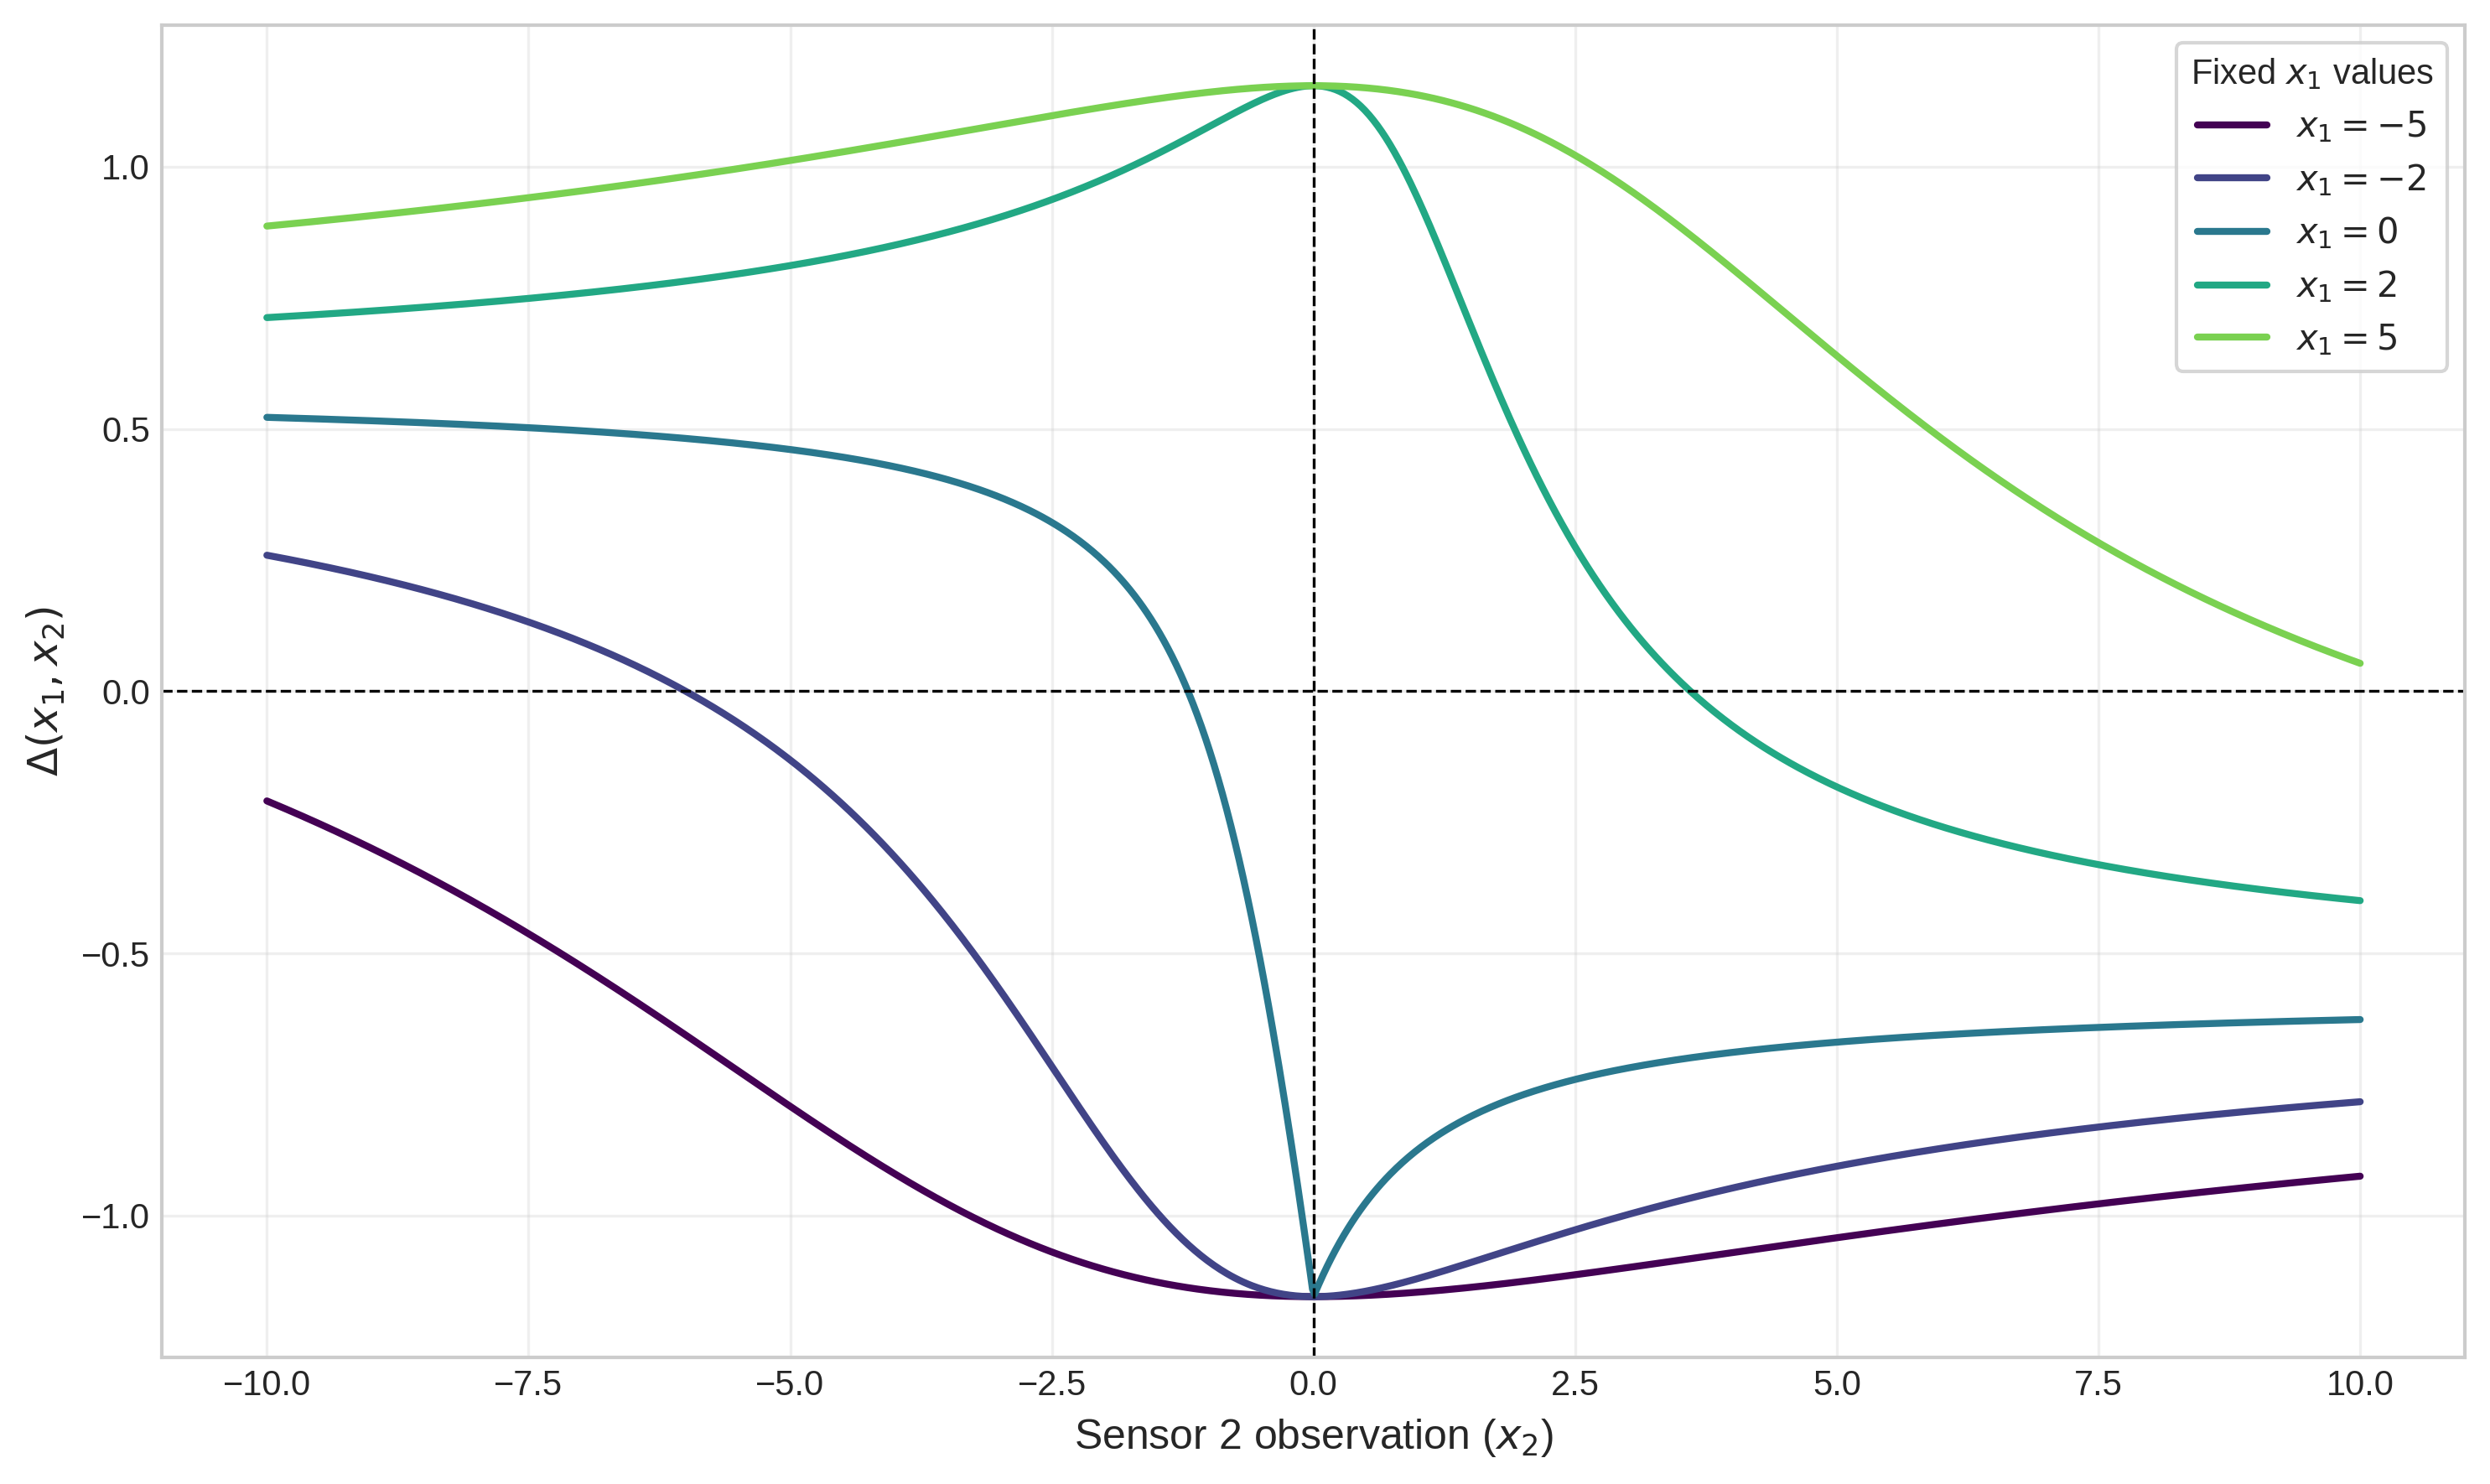
These results are proven by showing that the two test statistics, as functions of the sensor observations, have fundamentally different dependencies in the joint observation space. For example, the Shapley statistic x1,...,xN2 in the bivariate Gaussian setting depends on both x1,...,xN3 and x1,...,xN4 due to the correlation x1,...,xN5, whereas x1,...,xN6 depends only on x1,...,xN7. As a result, their decision boundaries diverge except in the independent case (x1,...,xN8).
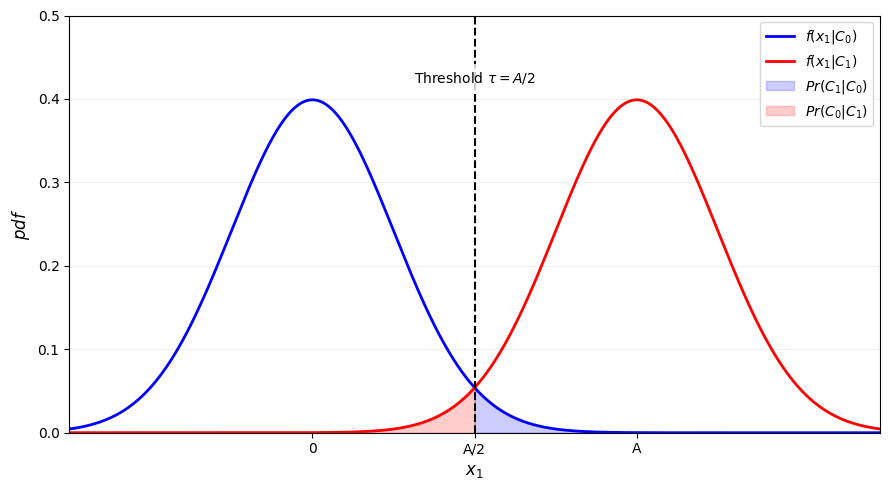
Figure 1: Statistical error probabilities for the binary hypothesis test discussed in Theorem III.6, illustrating decision boundaries for the considered tests and highlighting their divergence under dependency.
Moreover, Theorem III.6 establishes that the relative performance of the Shapley test versus the marginal classifier test depends on the sign and magnitude of the correlation:
- For high positive correlation (x1,...,xN9 close to v(⋅)0), the Shapley value can outperform the marginal test.
- For high negative correlation (v(⋅)1 close to v(⋅)2), the Shapley value is strictly inferior.
Empirically, combining both test statistics based on a learned sign of v(⋅)3 achieves strictly better results than either alone in those extreme regimes.
Numerical Results
Extensive Monte Carlo simulations corroborate the theoretical findings:
Detailed error probabilities for numerous settings (see tables in the original text) underscore the claim that neither method is universally superior in the dependent case.
Implications and Future Directions
The findings have several direct consequences:
- Practical efficiency: For independent sensors, practitioners should use the marginal likelihood ratio v(⋅)8 for anomaly localization since it is simpler and incurs much lower computational cost.
- Caution with dependence: In correlated settings, the use of the Shapley value must be justified by the specifics of the sensor distribution; uncritical adoption can yield suboptimal outcomes.
- Hybrid testing: An adaptive method that switches between statistics based on learned or estimated correlation structure can outperform either classical approach.
Theoretically, this work underlines the need for further research into feature attribution and localization statistics under dependency, a critically under-explored area in explainable AI and signal processing. There is potential for designing new statistics that combine strengths of both Shapley-based and marginal approaches for general dependency models.
Conclusion
This study delivers a comprehensive mathematical and empirical assessment of the Shapley value in the context of sensor anomaly localization with optimal classifiers. While the Shapley value offers no advantage in independent data regimes and incurs significant computational burden, its performance is not uniformly superior, nor inferior, in dependent regimes. The results highlight the necessity of tailored statistical analysis before employing complex attribution measures and motivate further work on adaptive and hybrid strategies for robust sensor anomaly localization.