- The paper introduces persistent homology pipelines that quantify tissue thinning and CSF expansion directly in subject space.
- It employs L1 curves from H1 persistence and H2 cycle analysis to capture biologically relevant atrophy patterns in MRI.
- Results demonstrate superior AD discrimination and reliable longitudinal tracking compared to traditional volumetric techniques.
Homology-Based Morphometry of Brain Atrophy: Methods and Applications
Introduction
This work introduces two structurally interpretable pipelines for quantifying brain atrophy in structural MRI via persistent homology (PH), a core technique in topological data analysis (TDA). Current morphometric methods—voxel-based morphometry (VBM), atlas-based regional volumetrics, and deep learning classifiers—all face limitations relating to template registration, spatial resolution, interpretability, and reproducibility. The proposed PH-based pipelines circumvent these issues by operating directly in subject space using standard tissue segmentation masks, thereby preserving subject-specific geometric features without nonlinear normalization.
The central innovation is the use of homological cycles (loops and voids encoded in H1 and H2 persistence, respectively) as primary morphometric objects, replacing conventional voxel-wise summaries. This yields robust, biologically motivated biomarkers sensitive to tissue thinning and CSF cavity expansion, two canonical consequences of neurodegeneration.
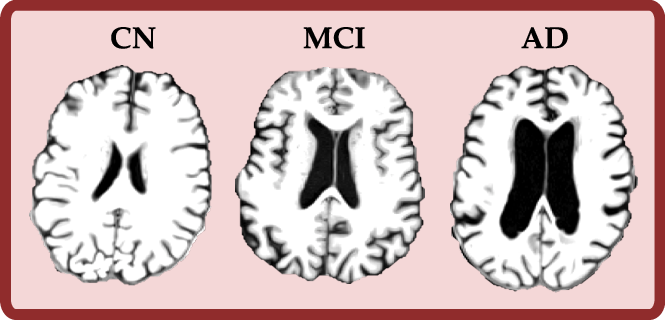
Figure 1: Visualization of brain atrophy progression in T1w MRI, illustrating preserved tissue in CN, intermediate atrophy in MCI, and advanced atrophy in AD.
Methodological Framework
Pipeline 1: Tissue Thinning via EDT and H1 Persistence
Pipeline 1 quantifies parenchymal thinning from binary union masks of gray matter (GM) and white matter (WM). For each major anatomical view (sagittal, coronal, axial), the Euclidean distance transform (EDT) is computed slice-wise, assigning each voxel its distance to the nearest tissue boundary. Cubical H1 persistence diagrams are constructed for each slice’s superlevel filtration, capturing ring-like cycles whose persistence directly encodes tissue depth.
Persistence landscapes for each diagram are summarized by L1 norms, generating anatomical L1 curves per axis. These curves provide localized, registration-free descriptors anchored at anatomical landmarks (e.g., hippocampus, ventricles).
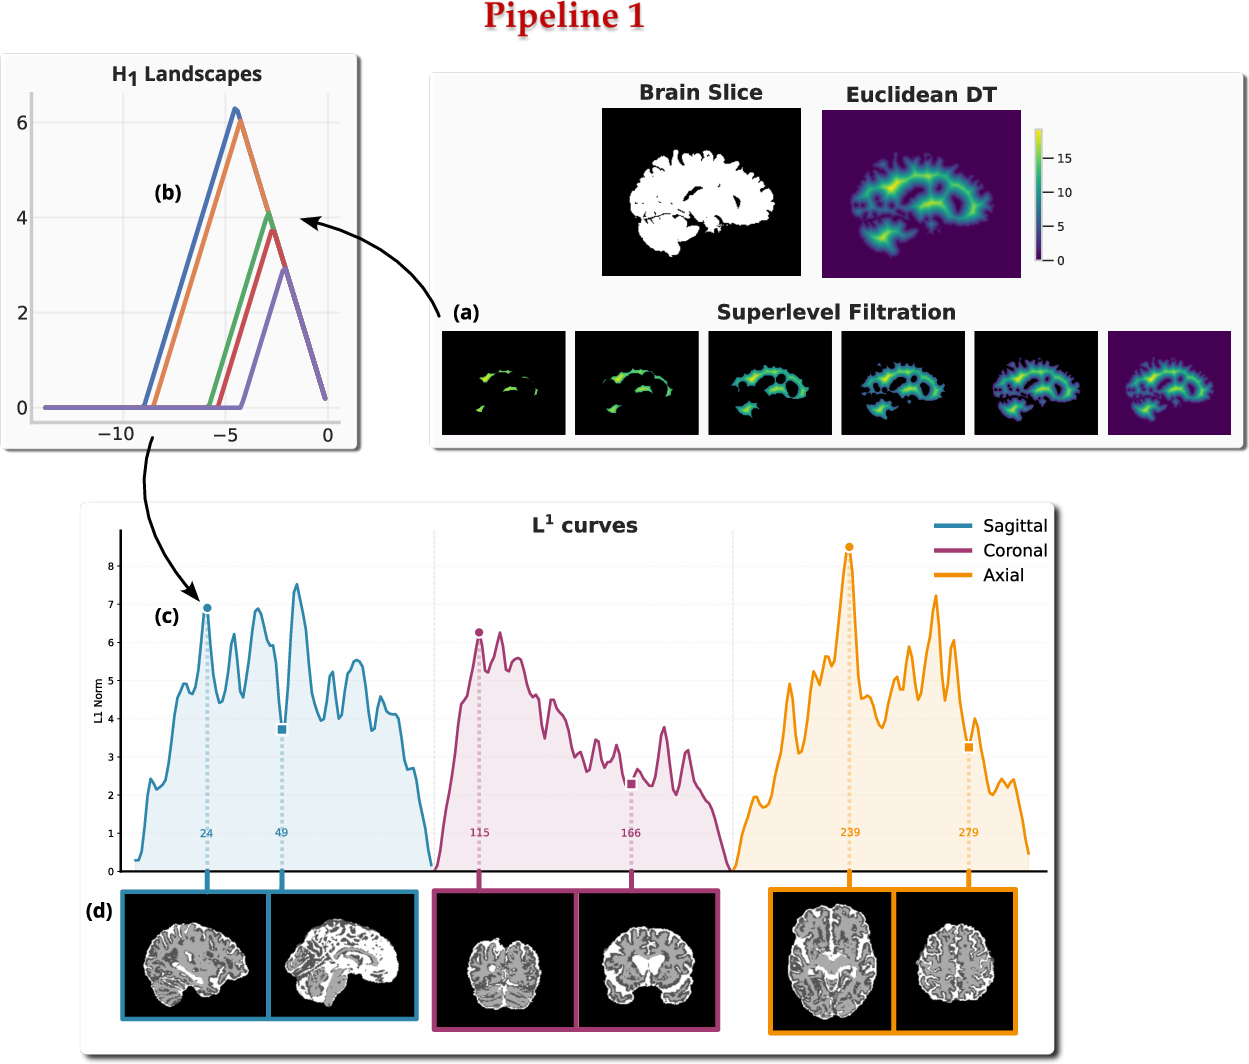
Figure 2: Pipeline 1 schematic showing EDT filtration, H1 landscape extraction, and generation of L1 curves across anatomical axes.
Pipeline 2: CSF Expansion via α-Complex Filtration and H2 Persistence
Pipeline 2 targets CSF cavity enlargement using the CSF complement mask within a minimal bounding box. Point clouds of non-CSF tissue are analyzed via H20-complex filtrations; persistent H21 cycles correspond to enclosed voids shaped by ventricle and sulcal geometry.
Longitudinal within-subject comparisons leverage bottleneck distances between H22 persistence diagrams, quantifying morphological changes in CSF cavity systems, which are highly sensitive to short-interval disease progression.
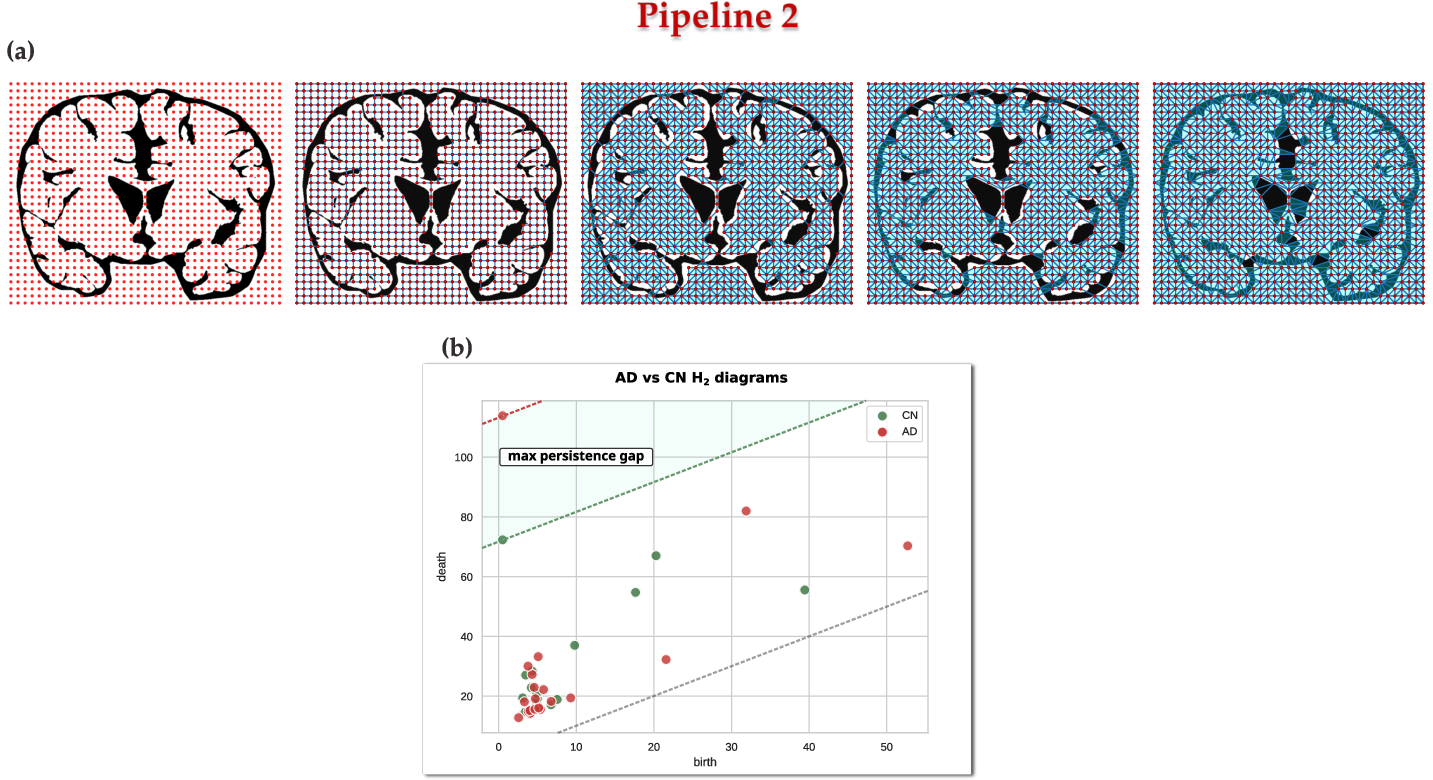
Figure 3: Pipeline 2 schematic illustrating point cloud H23-complex filtration and H24 persistent diagrams for representative diagnostic groups.
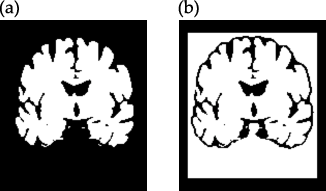
Figure 4: Input masks for the two pipelines: parenchymal mask for tissue thinning (Pipeline 1) and CSF complement mask for cavity expansion (Pipeline 2).
Experimental Validation
Synthetic Erosion Confirms Topological Sensitivity
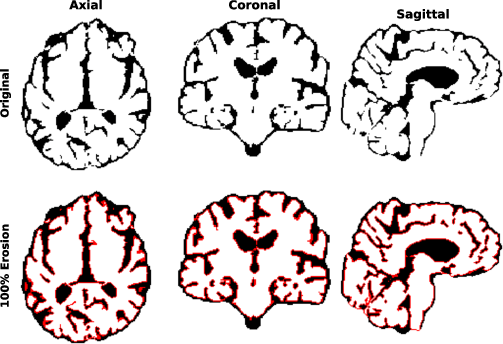
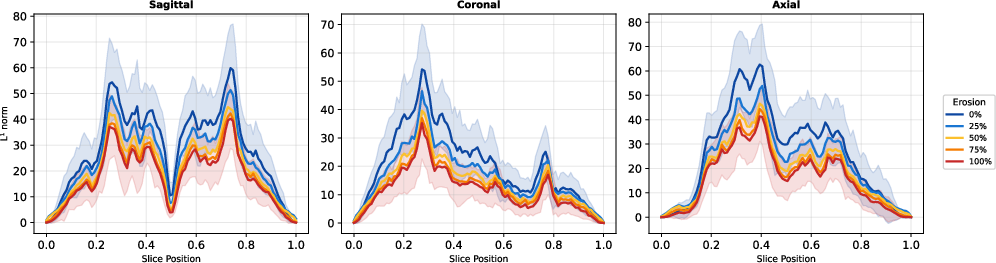
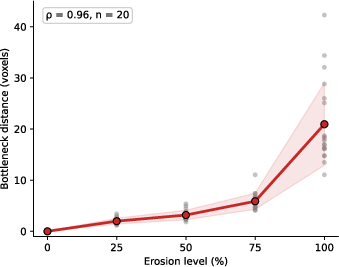
Controlled partial erosion of parenchymal masks from CN subjects validates the response of both pipelines:
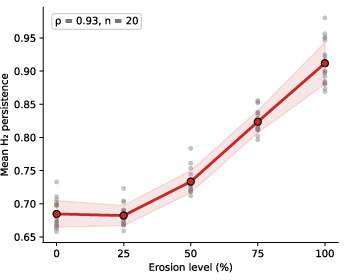
Figure 7: Pipeline 2 synthetic validation: left panel shows bottleneck distance increase, right panel shows mean H11 persistence scaling with erosion.
Clinical Results: AD Diagnosis and Disease Progression
Cross-Sectional Group Separation and Anatomical Localization
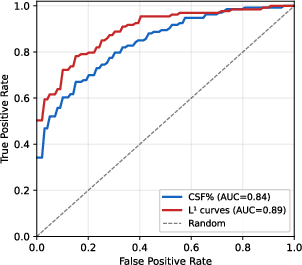
Pipeline 1 achieves robust AD vs CN separation using H12 curves:
- ROC-AUC = 0.895, balanced accuracy = 0.814.
- Peak effect sizes localize to medial temporal structures (hippocampus, parahippocampal cortex, amygdala), consistent with early pathological changes.
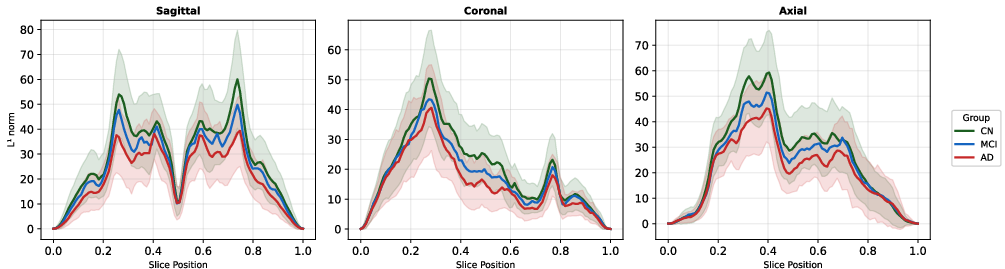
Figure 8: Diagnostic H13 curves for CN, MCI, and AD groups show progressive decline across axes.
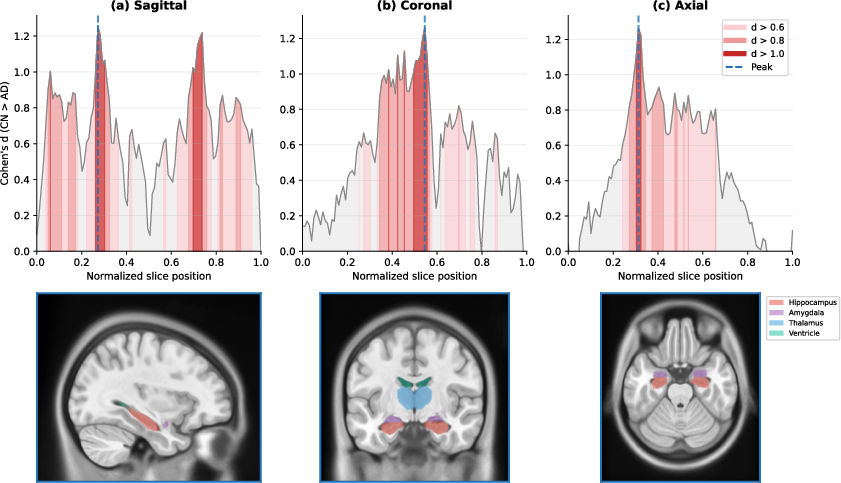
Figure 9: Slice-wise localization of H14-based effect sizes; anatomical peaks align with AD target regions.
Pipeline 2 maintains subject-specific morphometric fingerprints over six months:
- Within-subject bottleneck distances (median H15 mm²) are H16–H17 smaller than between-subject distances.
- AD subjects show H18 greater within-subject variability, reflecting accelerated CSF expansion.
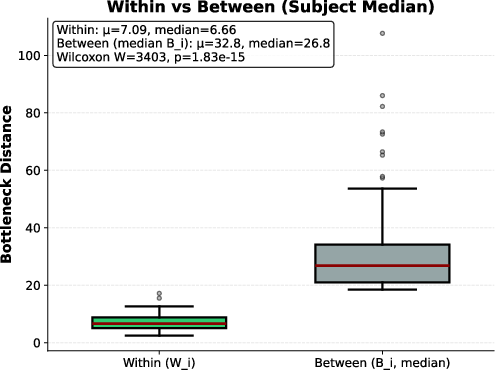
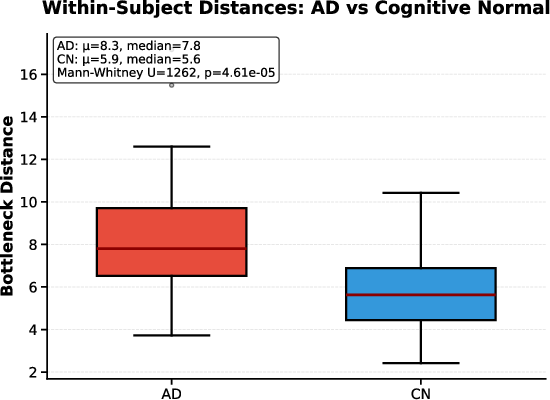
Figure 10: Within-subject vs between-subject bottleneck distances illustrate longitudinal fingerprint stability.
Comparison to Volumetric Baselines
Topological features consistently outperform CSF volumetrics:
Practical Considerations
- Both pipelines require only standard tissue masks, minimal preprocessing, and run efficiently on commercial hardware.
- PH stability guarantees robustness to segmentation noise; repeated runs are deterministic or controlled by seed.
- Applicability extends beyond AD: pipelines reflect general geometric consequences of atrophy, suitable for other neurodegenerative and traumatic conditions.
Quality control exclusions were necessary to prevent segmentation artifacts from introducing spurious cycles, but rates were comparable across groups and did not bias diagnoses.
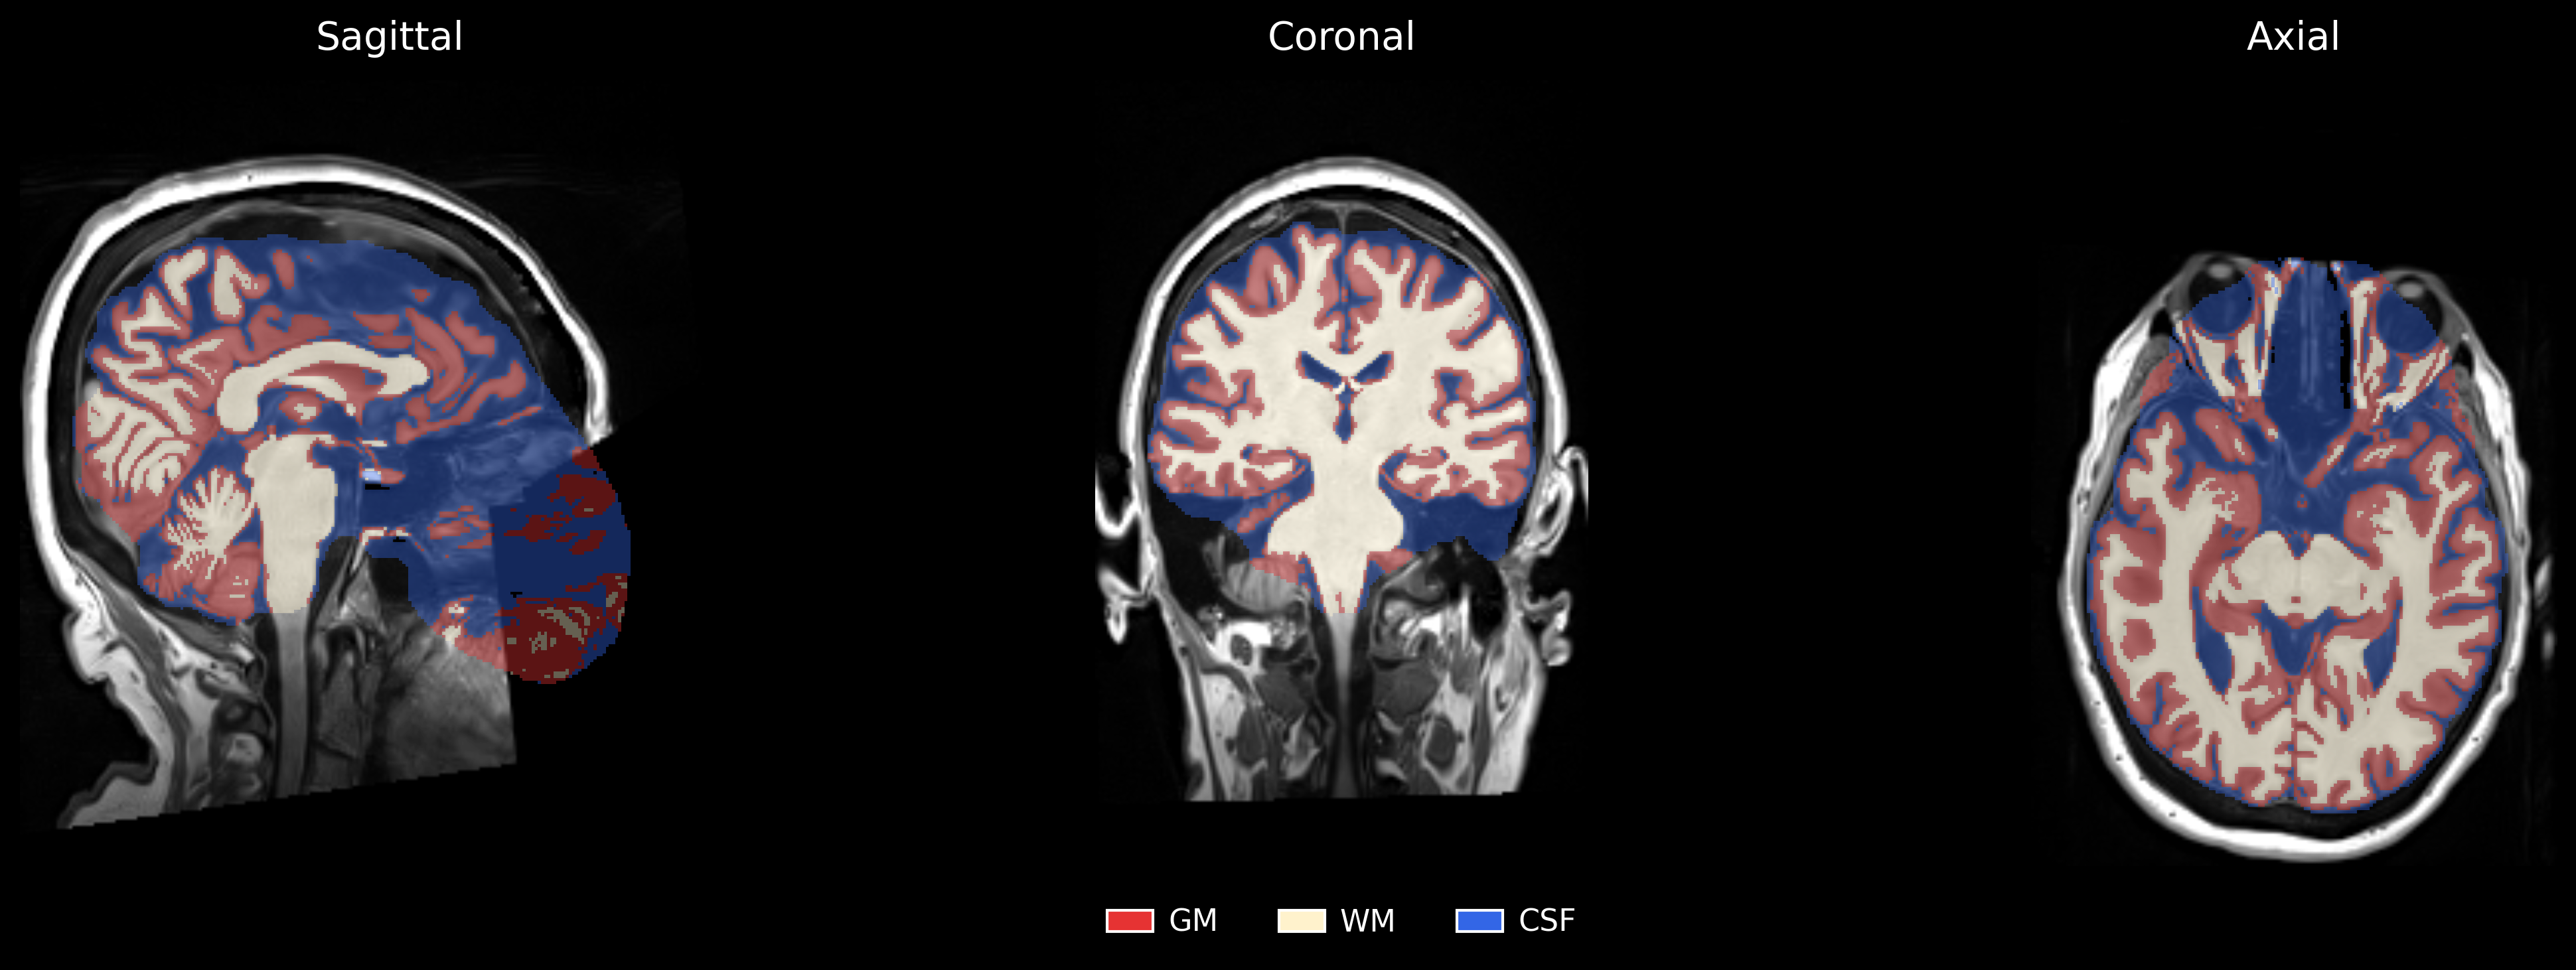
Figure 12: Example segmentation failure excluded in quality control.
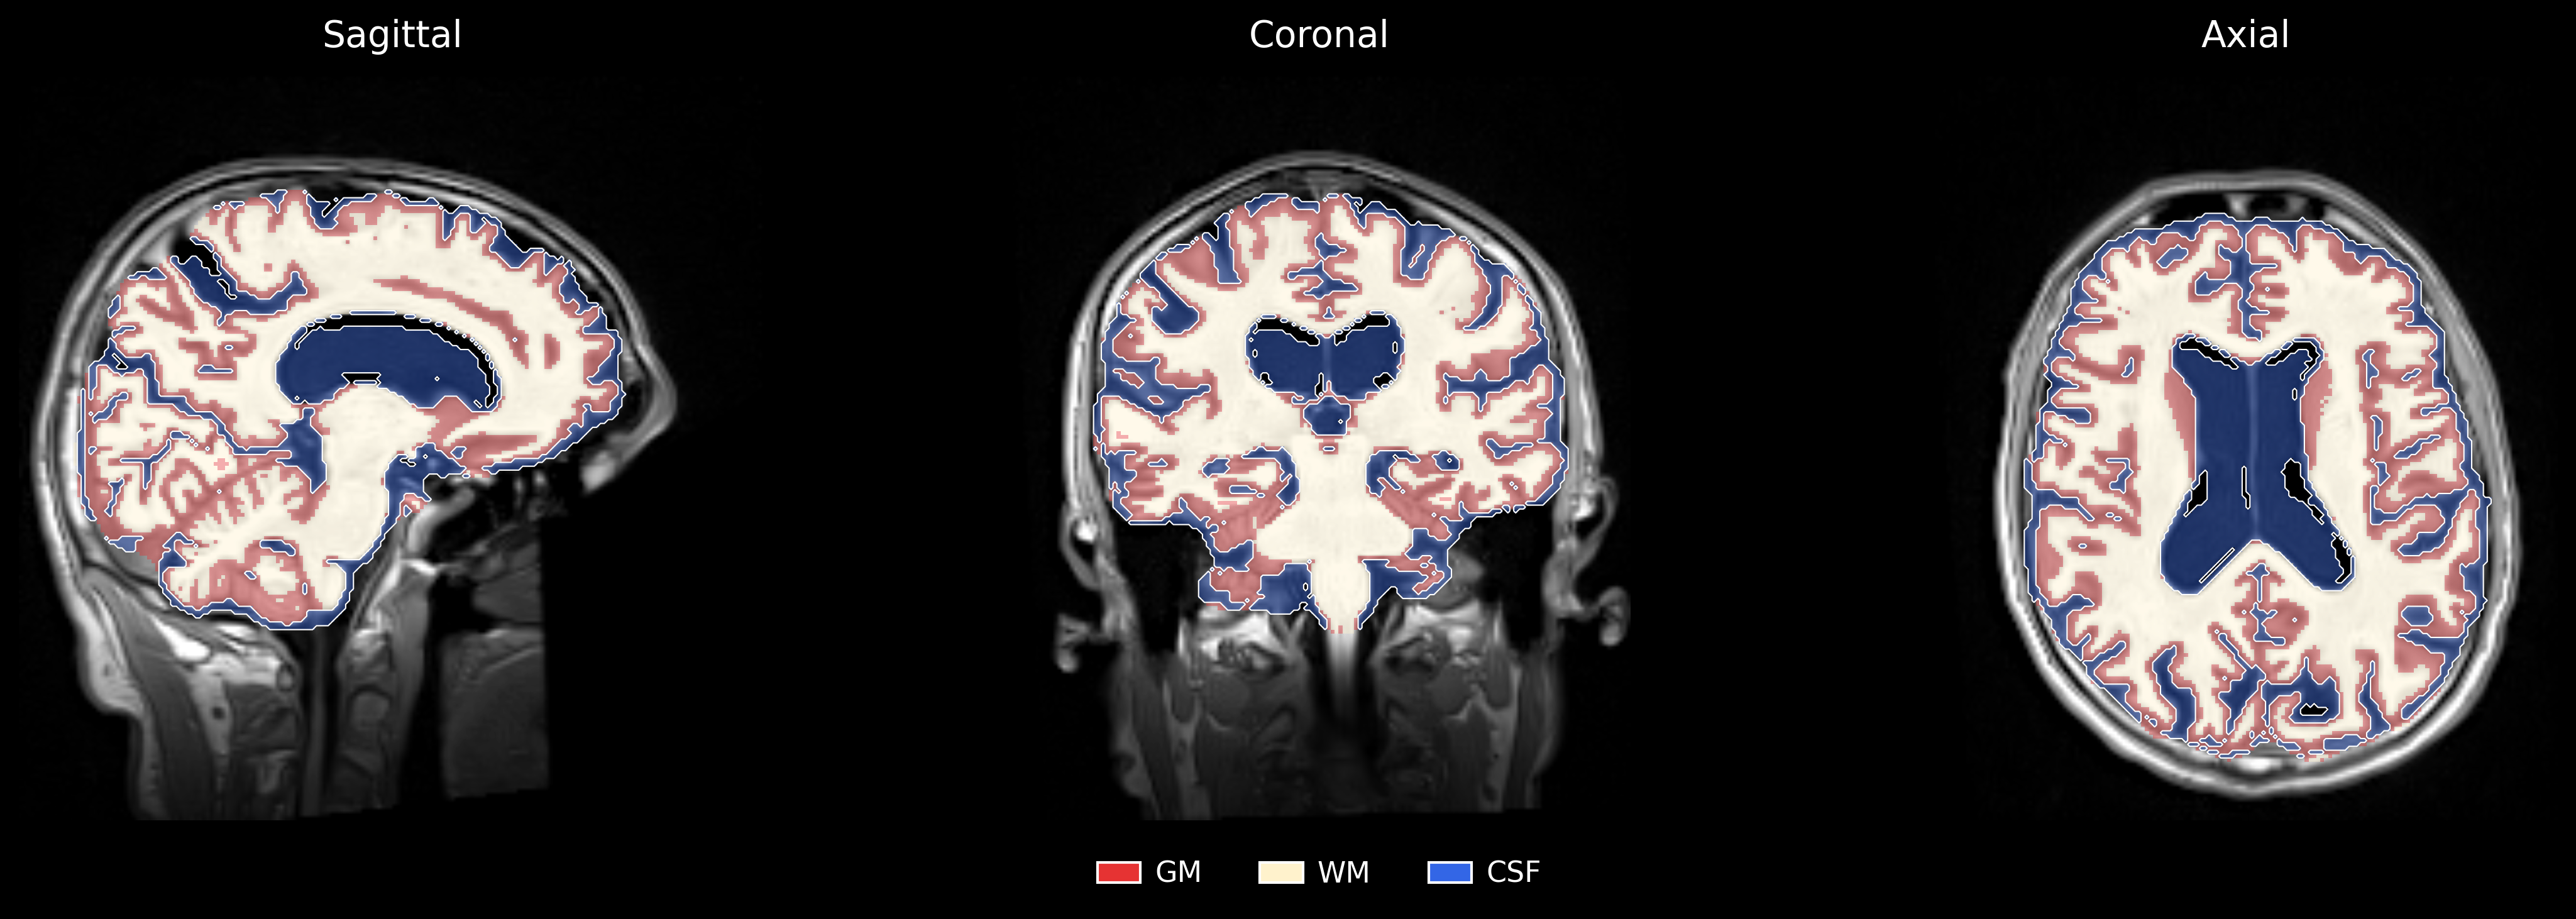
Figure 13: Example CSF mask discontinuity excluded from analyses.
Theoretical Implications and Future Directions
This framework challenges the standard morphometric assumption that structural change is best measured via template normalization or regional scalar volumes. By leveraging topological invariants, it enables direct inference in subject space, supports anatomical localization, and provides both cross-sectional and longitudinal biomarkers.
Future directions include:
- Integration with other modalities (PET, fMRI, EEG) for earlier-stage biomarker development.
- Application to diverse etiologies (trauma, Parkinson’s, multiple sclerosis).
- Modified filtrations or multi-scale fusion to probe finer-grained morphometric changes.
Conclusion
Homology-based morphometry establishes cycles as primitive objects for brain shape analysis, yielding interpretable, reproducible biomarkers for atrophy. Persistent homology-based features capture both magnitude and distributional aspects of tissue loss and CSF expansion, outperforming conventional volumetric metrics in both cross-sectional discrimination and longitudinal tracking. These pipelines offer a robust alternative to template-based morphometry, with broad implications for structural neuroimaging and clinical diagnostics.