- The paper introduces a realistic DES model that simulates EMS missions by modeling triage, dispatch, travel, treatment, and ED selection with empirical accuracy.
- It employs calibrated travel times and stage-specific durations to ensure response time distributions and base utilization metrics closely match historical data.
- Scenario analysis shows that adding an H24 ambulance can improve urgent-call coverage by up to 8.12%, offering actionable insights for EMS strategic planning.
Realistic Discrete Event Simulation for Regional EMS Ambulance Location and Deployment
Introduction
The paper "A Realistic Discrete Event Simulation model for Ambulance Location and Deployment within a regional Emergency Medical Service" (2604.24394) introduces a comprehensive DES model that accurately captures the stochastic behavior and operational workflow of regional emergency medical services (EMS), with a particular focus on ambulance location and deployment optimization. Unlike conventional approaches relying on over-simplifying assumptions, the presented framework explicitly incorporates empirical operational delays, calibrated travel times on real road networks, spatial-temporal demand heterogeneity, and nuanced ED selection criteria, to faithfully replicate system dynamics and support actionable scenario analysis.
Operational Modeling Innovations
The model accommodates the full complexity of ambulance emergency missions by explicitly modeling all critical stages: telephone triage, dispatch, travel, on-site treatment, ED selection, patient handover, possible ambulance ramping due to ED crowding, and vehicle turnaround and sanitization. Notably, the framework integrates empirically estimated distributions for triage and ambulance preparation times—parameters frequently neglected in prior literature. The handling of ambulance ramping and offload delays, grounded in separate empirical distributions for each ED, directly addresses a significant source of resource unavailability that most simulation studies ignore.
Scenario-specific dispatch policies allow the incorporation of real-world decision rules such as proximity constraints and pathology-driven ED selection, consistent with hub-and-spoke referral networks.
(Figure 1)
Figure 1: Map of ambulance bases illustrates the spatial distribution of EMS resources across the territory.
The demand generation employs a hierarchical spatial model based on "generation zones" and "call squares," balancing statistical robustness with spatial heterogeneity. Temporal factors (hour, day, season, etc.) are incorporated only if statistically significant in historical data, avoiding unnecessary complexity while maintaining realism.
Data Integration and Calibration
Travel time estimation leverages OpenRouteService API or analogous routing services, calibrated with historical data via multiplicative scaling factors segregated by segment, urgency, and temporal slot. This calibration ensures simulation-derived response times accurately reflect observed operational variability.
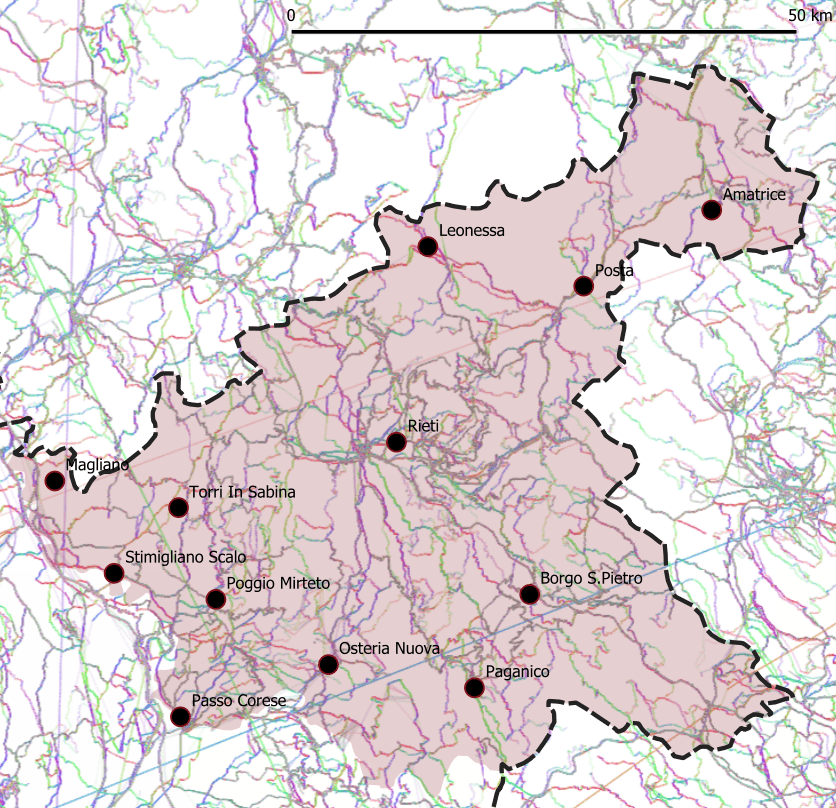
Figure 2: Total number of calls heatmap highlights spatial demand concentration, notably in urban hubs versus rural zones.
All task durations—triage, dispatch, treatment, transport, ED handover, ramping, sanitization—are individually fitted to empirical distributions differentiated by urgency level and facility, minimizing structural bias. Comprehensive operational data from a full year of ARES 118 missions inform model parameterization.
Case Study: Lazio Region, Italy
The model is instantiated on a heterogeneous region encompassing the city of Rieti and its province (Lazio, Italy), spanning urban and mountainous rural zones with disparate population densities and accessibility constraints. The existing configuration comprises 12 ambulance bases with mixed H24 and H12 coverage, not selected by data-driven criteria but rather by administrative expediency.
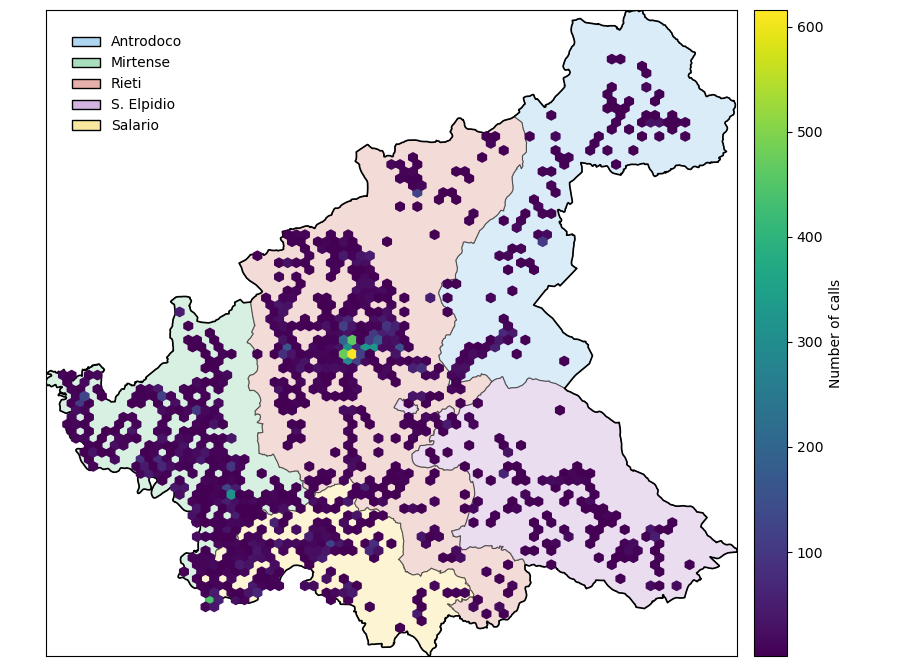
Figure 3: Demand points grid visualizes spatial discretization for accurate EMS call origin modeling.
The territory is partitioned into five generation zones and over 400 call squares. Demand and operational parameters are extracted from a cleaned dataset (>18,000 missions), including severity codes, timestamps, geolocations, base assignments, ED selection, ramping times, and outcomes.
ED selection reflects real clinical protocols, distinguishing between general and specialized hubs per WHO's tiered care guidelines. Only 13 EDs were realized as patient destinations, despite many facilities across Lazio.
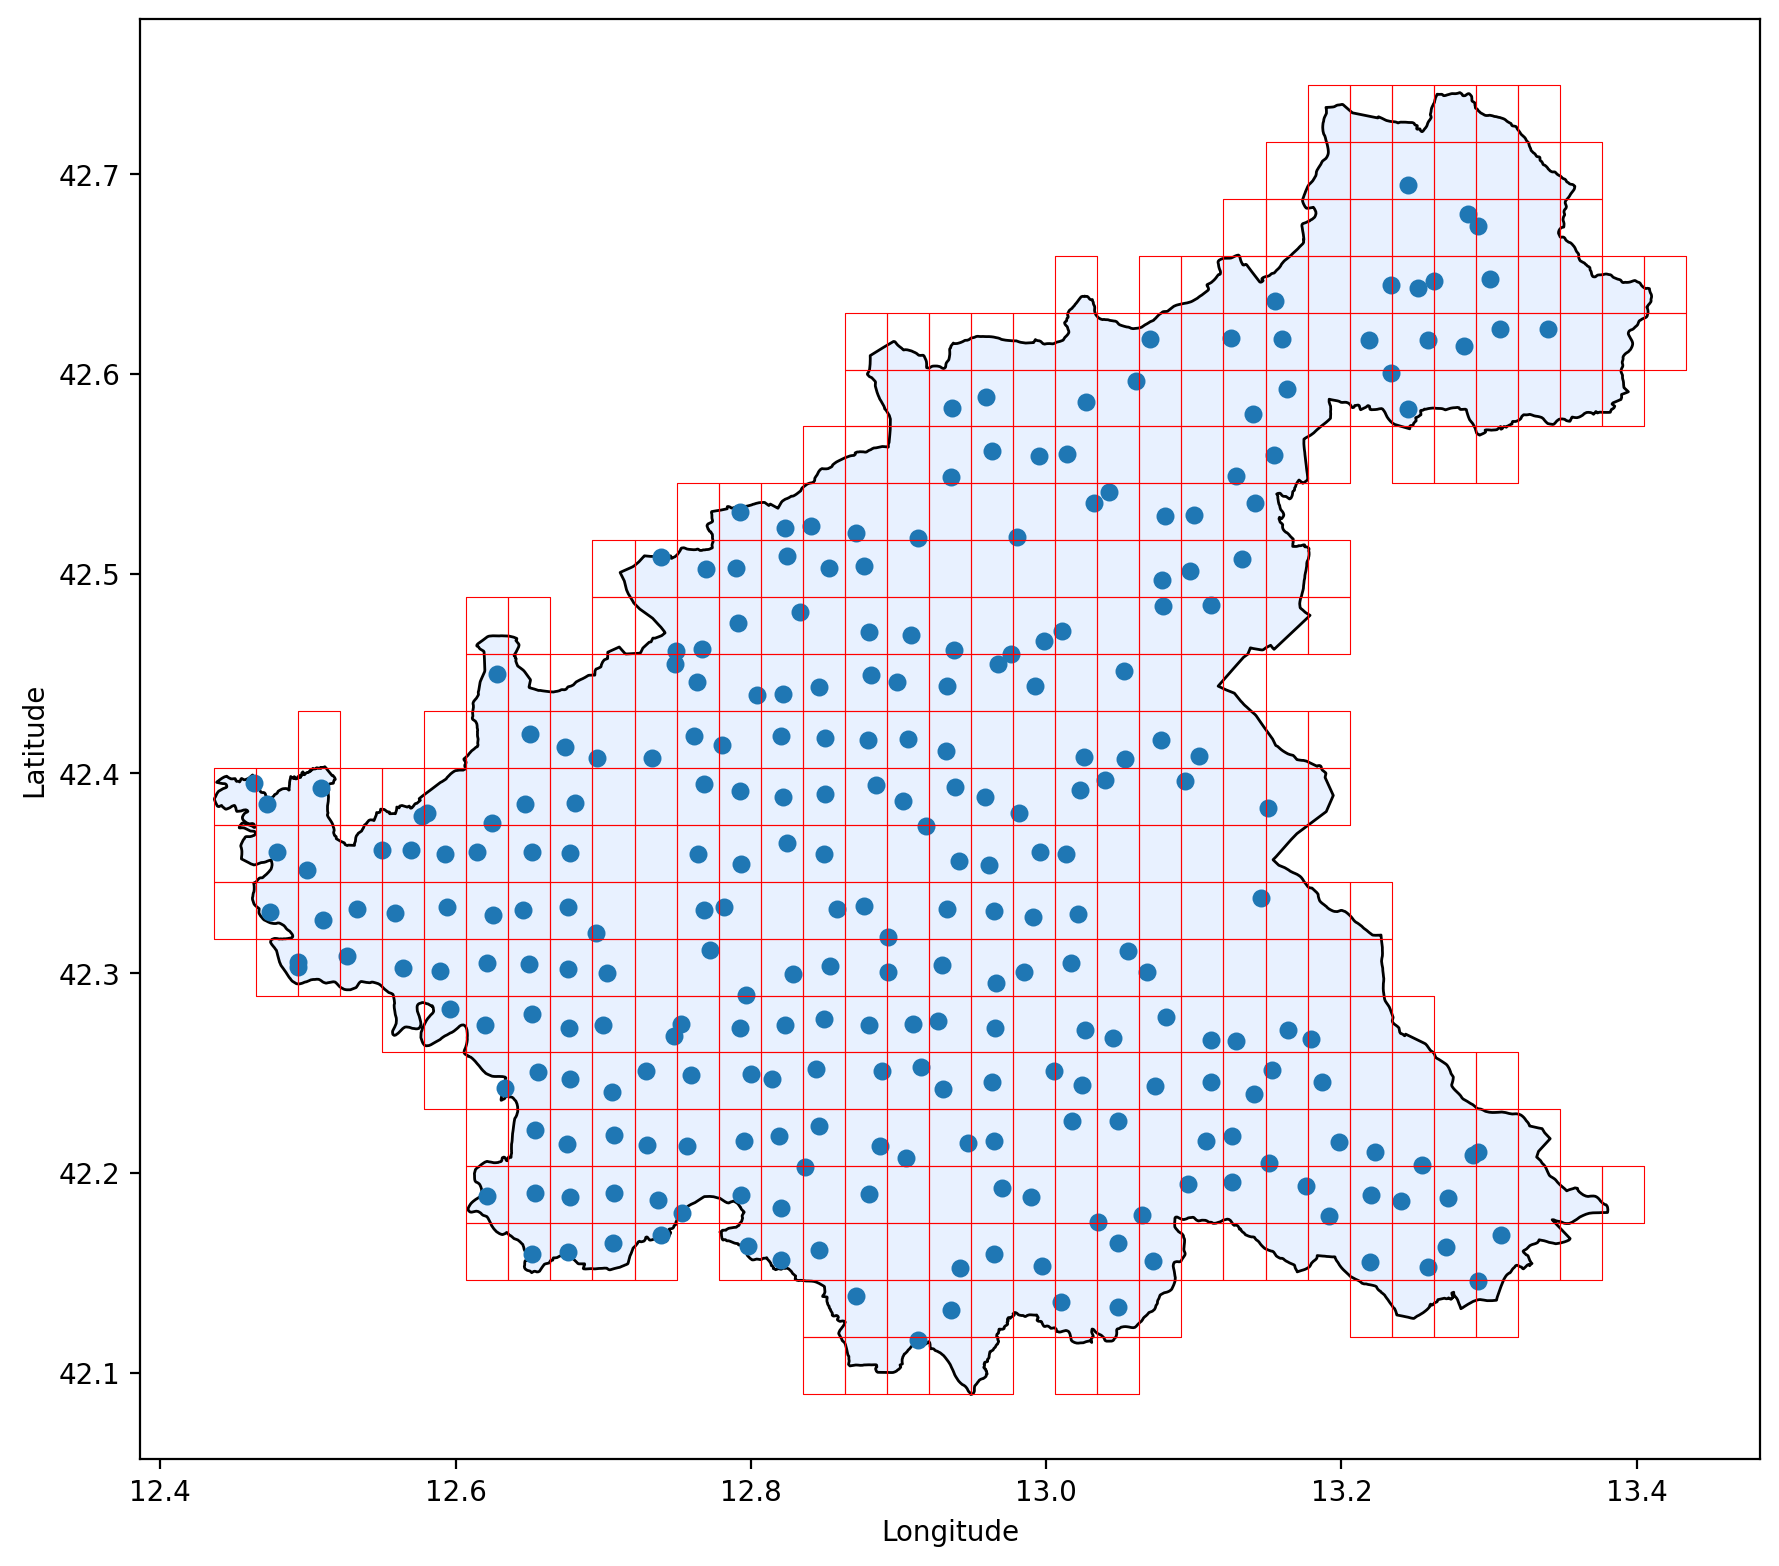
Figure 4: Map of ambulance bases and fire stations (FS) denotes candidate deployment sites for scenario analysis.
Model Validation and Numerical Evidence
Rigorous verification and validation procedures benchmark simulated KPIs against historical data over multiple replications. Aggregate call numbers, urgency-class coverage (percentage of responses within target threshold), and base utilization percentages are compared, with simulation discrepancies consistently within 3% of empirical values. Coverage curves, response time distributions, and utilization patterns are statistically indistinguishable from operational data.
Scenario testing evaluates deployment options such as adding/removing H24/H12 ambulances at key bases and exploring FSs as candidate base locations. For each scenario, the model simulates a one-year horizon with 30 replications, comparing coverage against baseline via paired t-tests at multiple response-time thresholds.
Scenario 5—adding an H24 ambulance at Rieti FS—generates the largest, most robust gains, improving urgent-call coverage by up to 8.12% across all threshold values. Redistributive scenarios without net resource addition yield neutral or ambiguous effects; capacity reduction consistently degrades coverage.
(Figure 5)
Figure 5: Map of the Lazio Region of Italy depicting all the EDs used as patient destinations in the case study.
Practical and Theoretical Implications
The DES model is validated as a reliable decision support tool for EMS planners, enabling performance-neutral scenario analysis and optimizing resource allocation under operational realism. Managers can directly estimate the system-wide impact of spatial and temporal resource shifts, consider ED closure or overload contingencies, and explore adaptive configurations. Results underscore the criticality of demand-driven deployment—resource concentration in high-demand central locations yields dominant efficiency improvements, while peripheral redistribution offers minimal gains.
Theoretically, the model establishes a modular, scalable foundation for simulation-based optimization (SBO), combining advanced data-driven demand forecasting, real-time monitoring, and dynamic redeployment for adaptive EMS management. Future extensions may include integration with predictive AI models for anomaly detection and capacity planning, and algorithmic exploration of conflicting objectives (e.g., efficiency vs. equity).
Conclusion
This work presents a detailed, empirically driven DES framework that overcomes the structural limitations of prior models by faithfully reproducing every operational stage of regional EMS ambulance missions. Validation on real-world data demonstrates high fidelity and reliability, establishing the model as a robust platform for scenario analysis and strategic planning. Numerical results compellingly demonstrate that targeted capacity increases in central locations drive superior coverage outcomes, providing direct quantitative evidence to inform EMS deployment policy. The modular design supports easy extension to other operational contexts, facilitating future development of adaptive, optimization-driven EMS management systems.