- The paper demonstrates that combining 163 MWA pointings via TTGE and SCF techniques yields a joint 2σ upper limit of (98.67)² mK² at k = 0.156 Mpc⁻¹.
- The methodology effectively mitigates foreground leakage and systematic artifacts by filtering smooth spectral components, ensuring cleaner retrieval of the EoR window.
- Field selection and incoherent power spectrum combination provide a factor-of-three improvement over previous single-pointing limits, guiding future EoR and SKA-Low survey strategies.
Enhanced Upper Limits on the 21-cm Power Spectrum from MWA Drift-Scan Data Using Multiple Pointings
Introduction and Context
This work presents a comprehensive statistical analysis of the 21-cm brightness temperature fluctuations from the Epoch of Reionization (EoR) using zenith-pointing drift scan observations from the Murchison Widefield Array (MWA). The authors leverage and advance the Tracking Tapered Gridded Estimator (TTGE) methodology, with integrated smooth component filtering (SCF) to mitigate foreground leakage and systematic artifacts associated with missing frequency channels. By analyzing all 163 pointing centers (PCs) available in a contiguous drift scan dataset and systematically combining the results, the study achieves the tightest 2σ upper limit for the EoR 21-cm power spectrum (PS) to date from the MWA at z=8.2, specifically (98.67)2 mK2 at k=0.156 Mpc−1. This represents approximately a factor of three improvement over earlier MWA results, with detailed spatial and spectral assessments guiding optimal field selection for future EoR and SKA-Low campaigns.
Data and Methodology
The dataset consists of 55 hours of zenith drift scan observations with MWA Phase II compact configuration at a central frequency of $154.2$ MHz, spanning right ascension 349.0∘≤α≤70.0∘ in 0.5-degree increments. A total of 163 PCs are identified, each corresponding to a unique instantaneous pointing. The observational strategy addresses both Galactic and extragalactic foreground contamination, as well as instrumental artifacts such as radio frequency interference (RFI) and non-uniform spectral sampling.
The TTGE approach convolves visibilities with a Gaussian window, suppressing the side lobe contribution from bright point sources, and performs gridding for computational efficiency and robustness to flagged frequency channels. The SCF method is incorporated at the pre-estimation stage, filtering out spectrally smooth components and minimizing spurious Fourier power leaking from flagged or missing channels—thereby restoring the EoR “window” in k-space for reliable upper limits.
Foreground Characterization: Angular Power Spectrum
The two-dimensional angular power spectrum Cℓ is estimated for each PC to assess the spatial and spectral structure of foreground emission. The mean-squared brightness temperature fluctuation Dℓ=ℓ(ℓ+1)Cℓ/(2π) exhibits expected ℓ2 scaling at high multipoles (ℓ≳200), consistent with Poisson fluctuations from unresolved point sources Figure 1. Notably, (98.67)2 mK20 demonstrates significant enhancement in PCs for which the main lobe of the MWA primary beam intersects the bright extended source Fornax A, most prominently at (98.67)2 mK21, and a smaller enhancement around (98.67)2 mK22 attributed to a combination of Fornax A and diffuse Galactic synchrotron emission via side lobes.
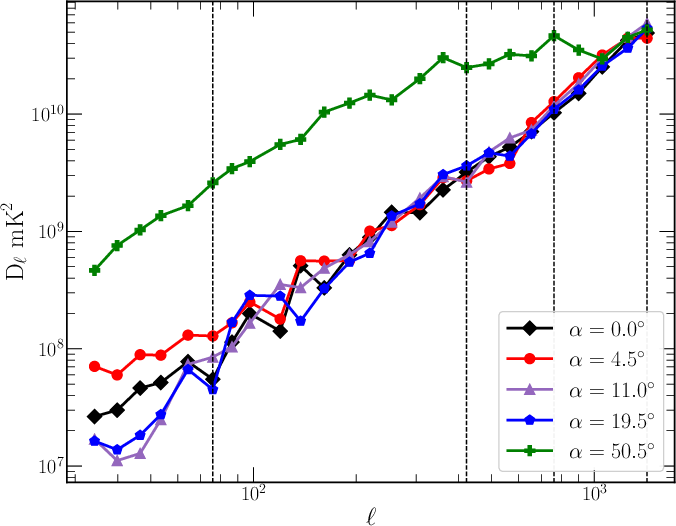
Figure 1: The measured (98.67)2 mK23 for selected pointing centers, illustrating the sharp amplitude increase at (98.67)2 mK24 (Fornax~A crossing).
The full (98.67)2 mK25 dependence further reveals that at high multipoles, field-to-field variations converge as the Poisson component dominates, while at lower (98.67)2 mK26, the foreground peaks become more pronounced and spatially coherent.
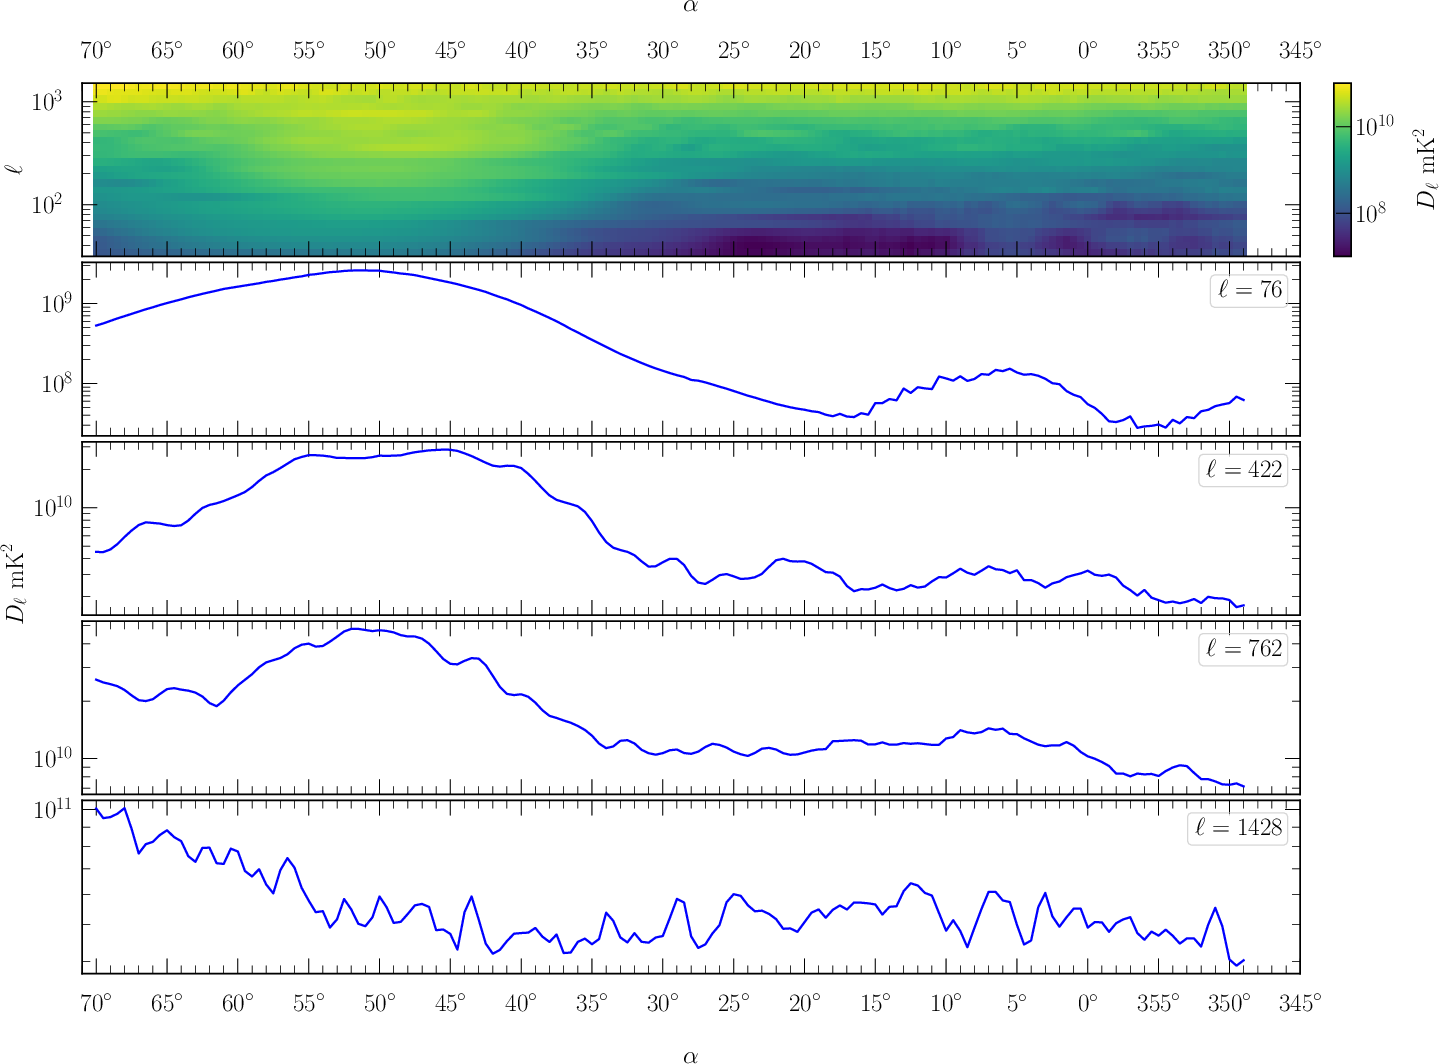
Figure 2: (98.67)2 mK27 as a function of (98.67)2 mK28 and (98.67)2 mK29, with maximal contamination corresponding to Fornax~A and secondary contamination at lower right ascensions.
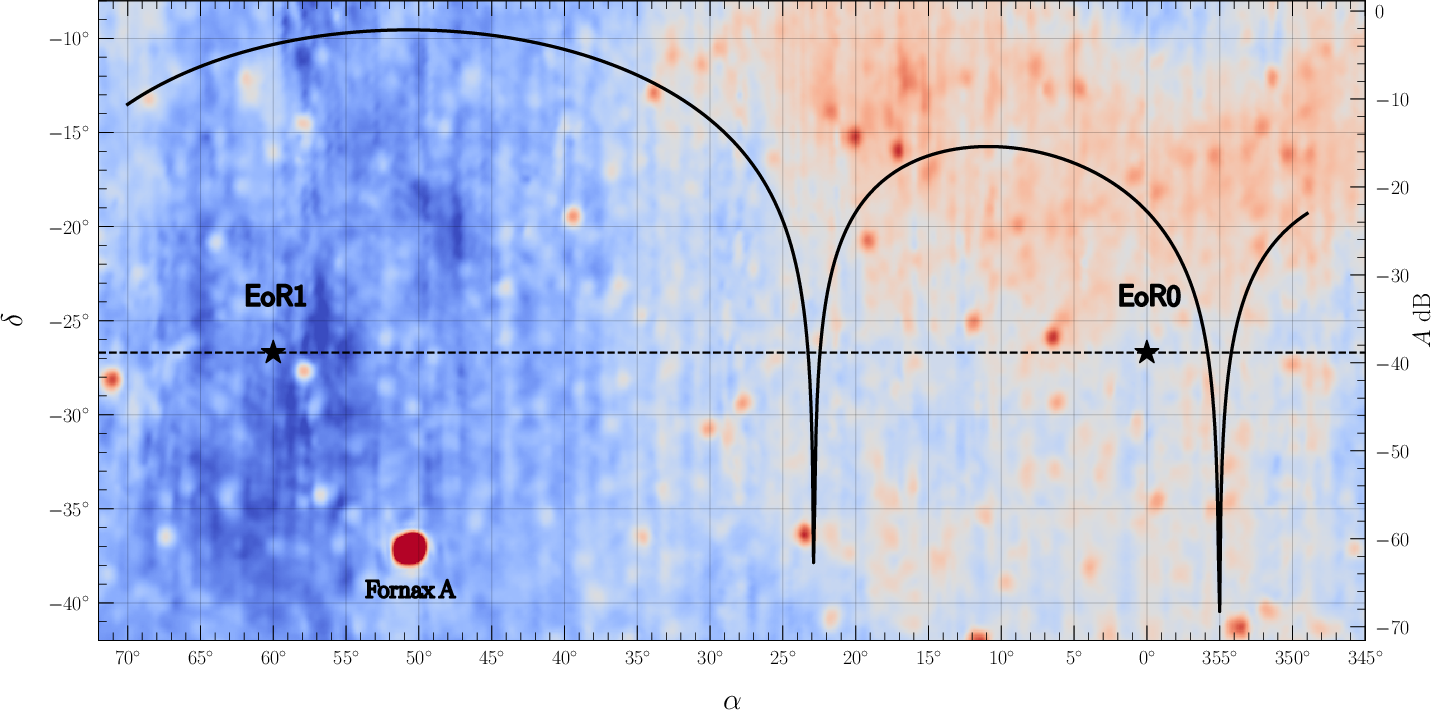
Figure 3: Sky map of the drift scan region over the Haslam map, overlaid with primary beam response and positions of EoR “cold” fields, situating the main contamination sources spatially.
Power Spectrum Estimation and Systematic Mitigation
The spectral analysis focuses on the three-dimensional power spectrum k=0.156 Mpc−10 using the TTGE, with the SCF rigorously eliminating spectral artifacts associated with missing channels. In the absence of SCF, periodic flagging across coarse bands generates horizontal streaks in the cylindrical power spectrum k=0.156 Mpc−11, with periodicity corresponding to the flagged channel pattern. Application of SCF at a 2 MHz smoothing scale efficiently suppresses these streaks for k=0.156 Mpc−12, enabling robust foreground and noise discrimination.
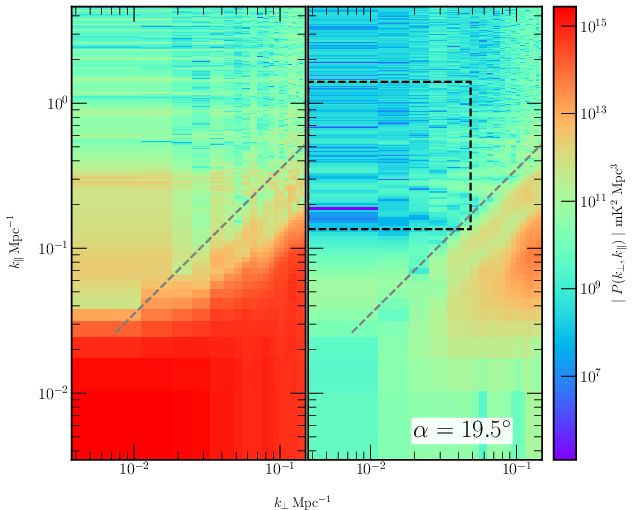
Figure 4: Cylindrical power spectrum before and after application of SCF, illustrating dramatic reduction of foreground leakage and streaks post-filtering.
To avoid residual contamination, certain k=0.156 Mpc−13 spacings exhibiting non-negligible foregrounds are additionally masked Figure 5.
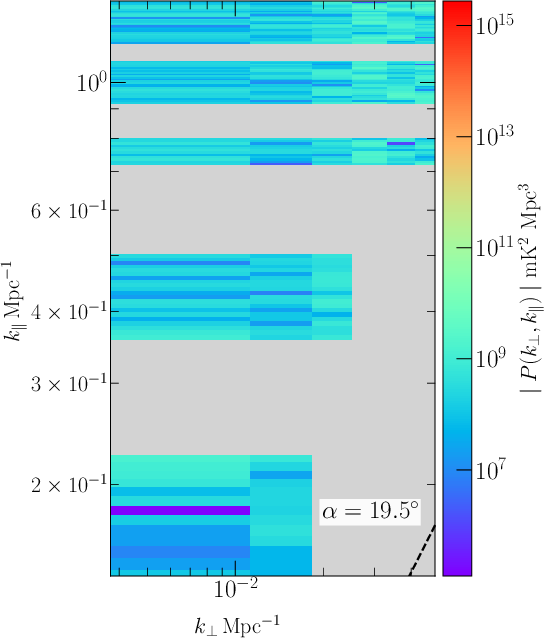
Figure 5: Explicit visualization of masked regions in k=0.156 Mpc−14 space, enabling clean spherically averaged PS estimation.
Field Selection and Statistical Results
Representative PCs are examined in detail, highlighting the diversity of contamination levels. PCs such as k=0.156 Mpc−15 demonstrate near-Gaussian, noise-dominated statistics, with k=0.156 Mpc−16 and k=0.156 Mpc−17 for the normalized k=0.156 Mpc−18 variable, and yield the tightest single-pointing upper limit k=0.156 Mpc−19 at $154.2$0 Figure 6. In contrast, PCs overlapping with Fornax A exhibit large positive deviations, non-Gaussianity, and orders-of-magnitude larger inferred power.
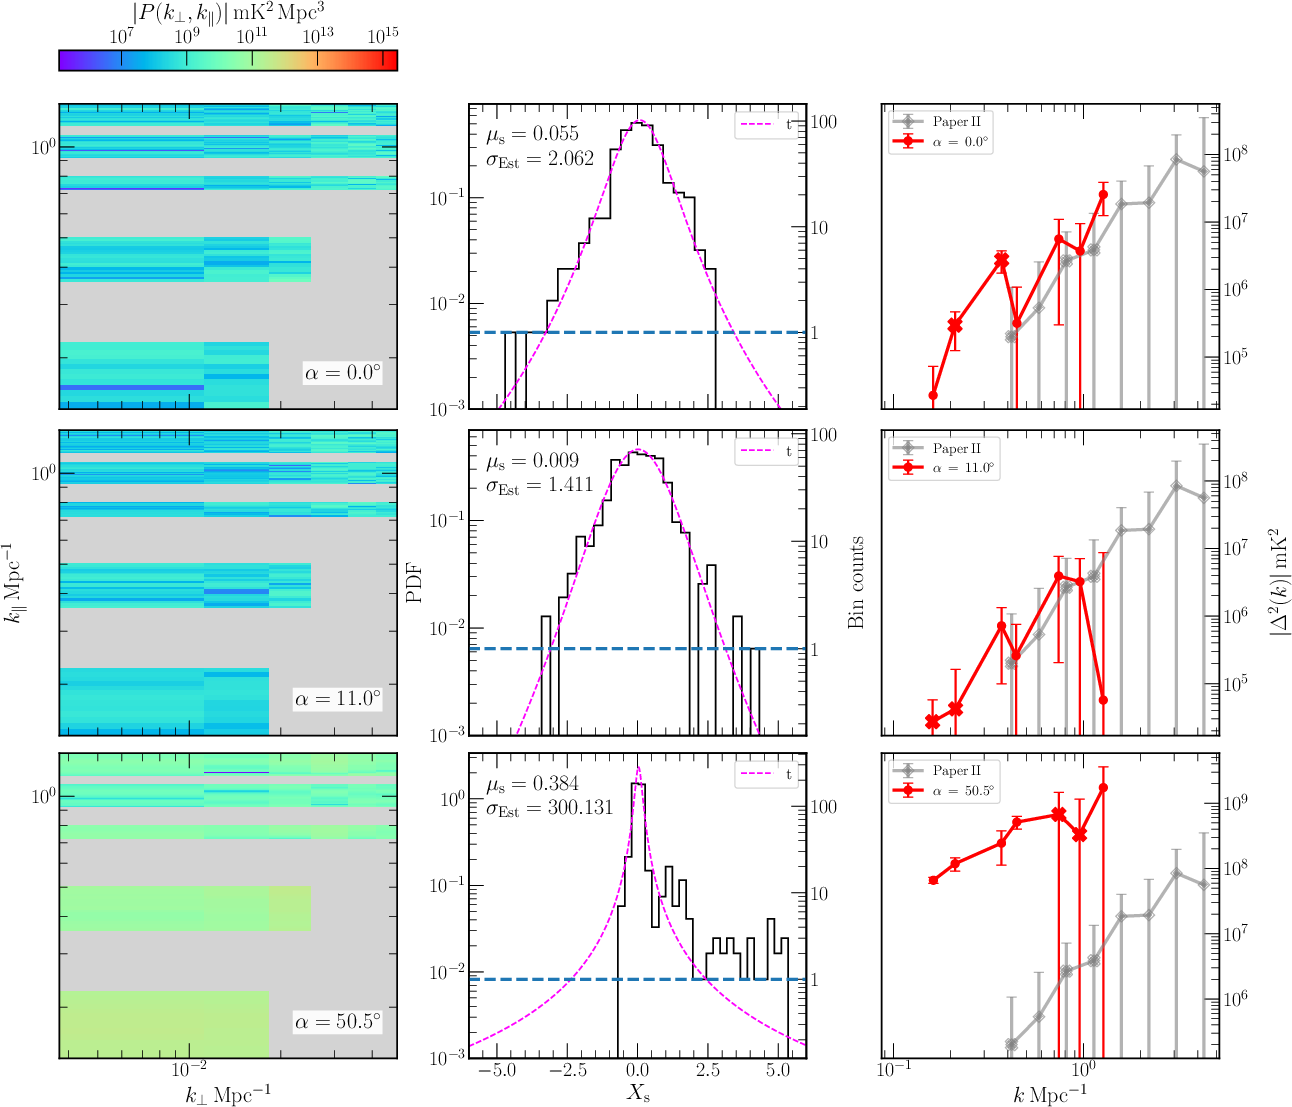
Figure 6: Comparative analysis of $154.2$1, $154.2$2 distribution, and resulting $154.2$3 for several representative PCs.
A full survey of all 163 PCs Figure 7 reveals the tightest upper limits are achieved in the range $154.2$4, which is relatively free of residual foregrounds and is optimal for EoR science, matching conclusions from recent field-suitability studies.
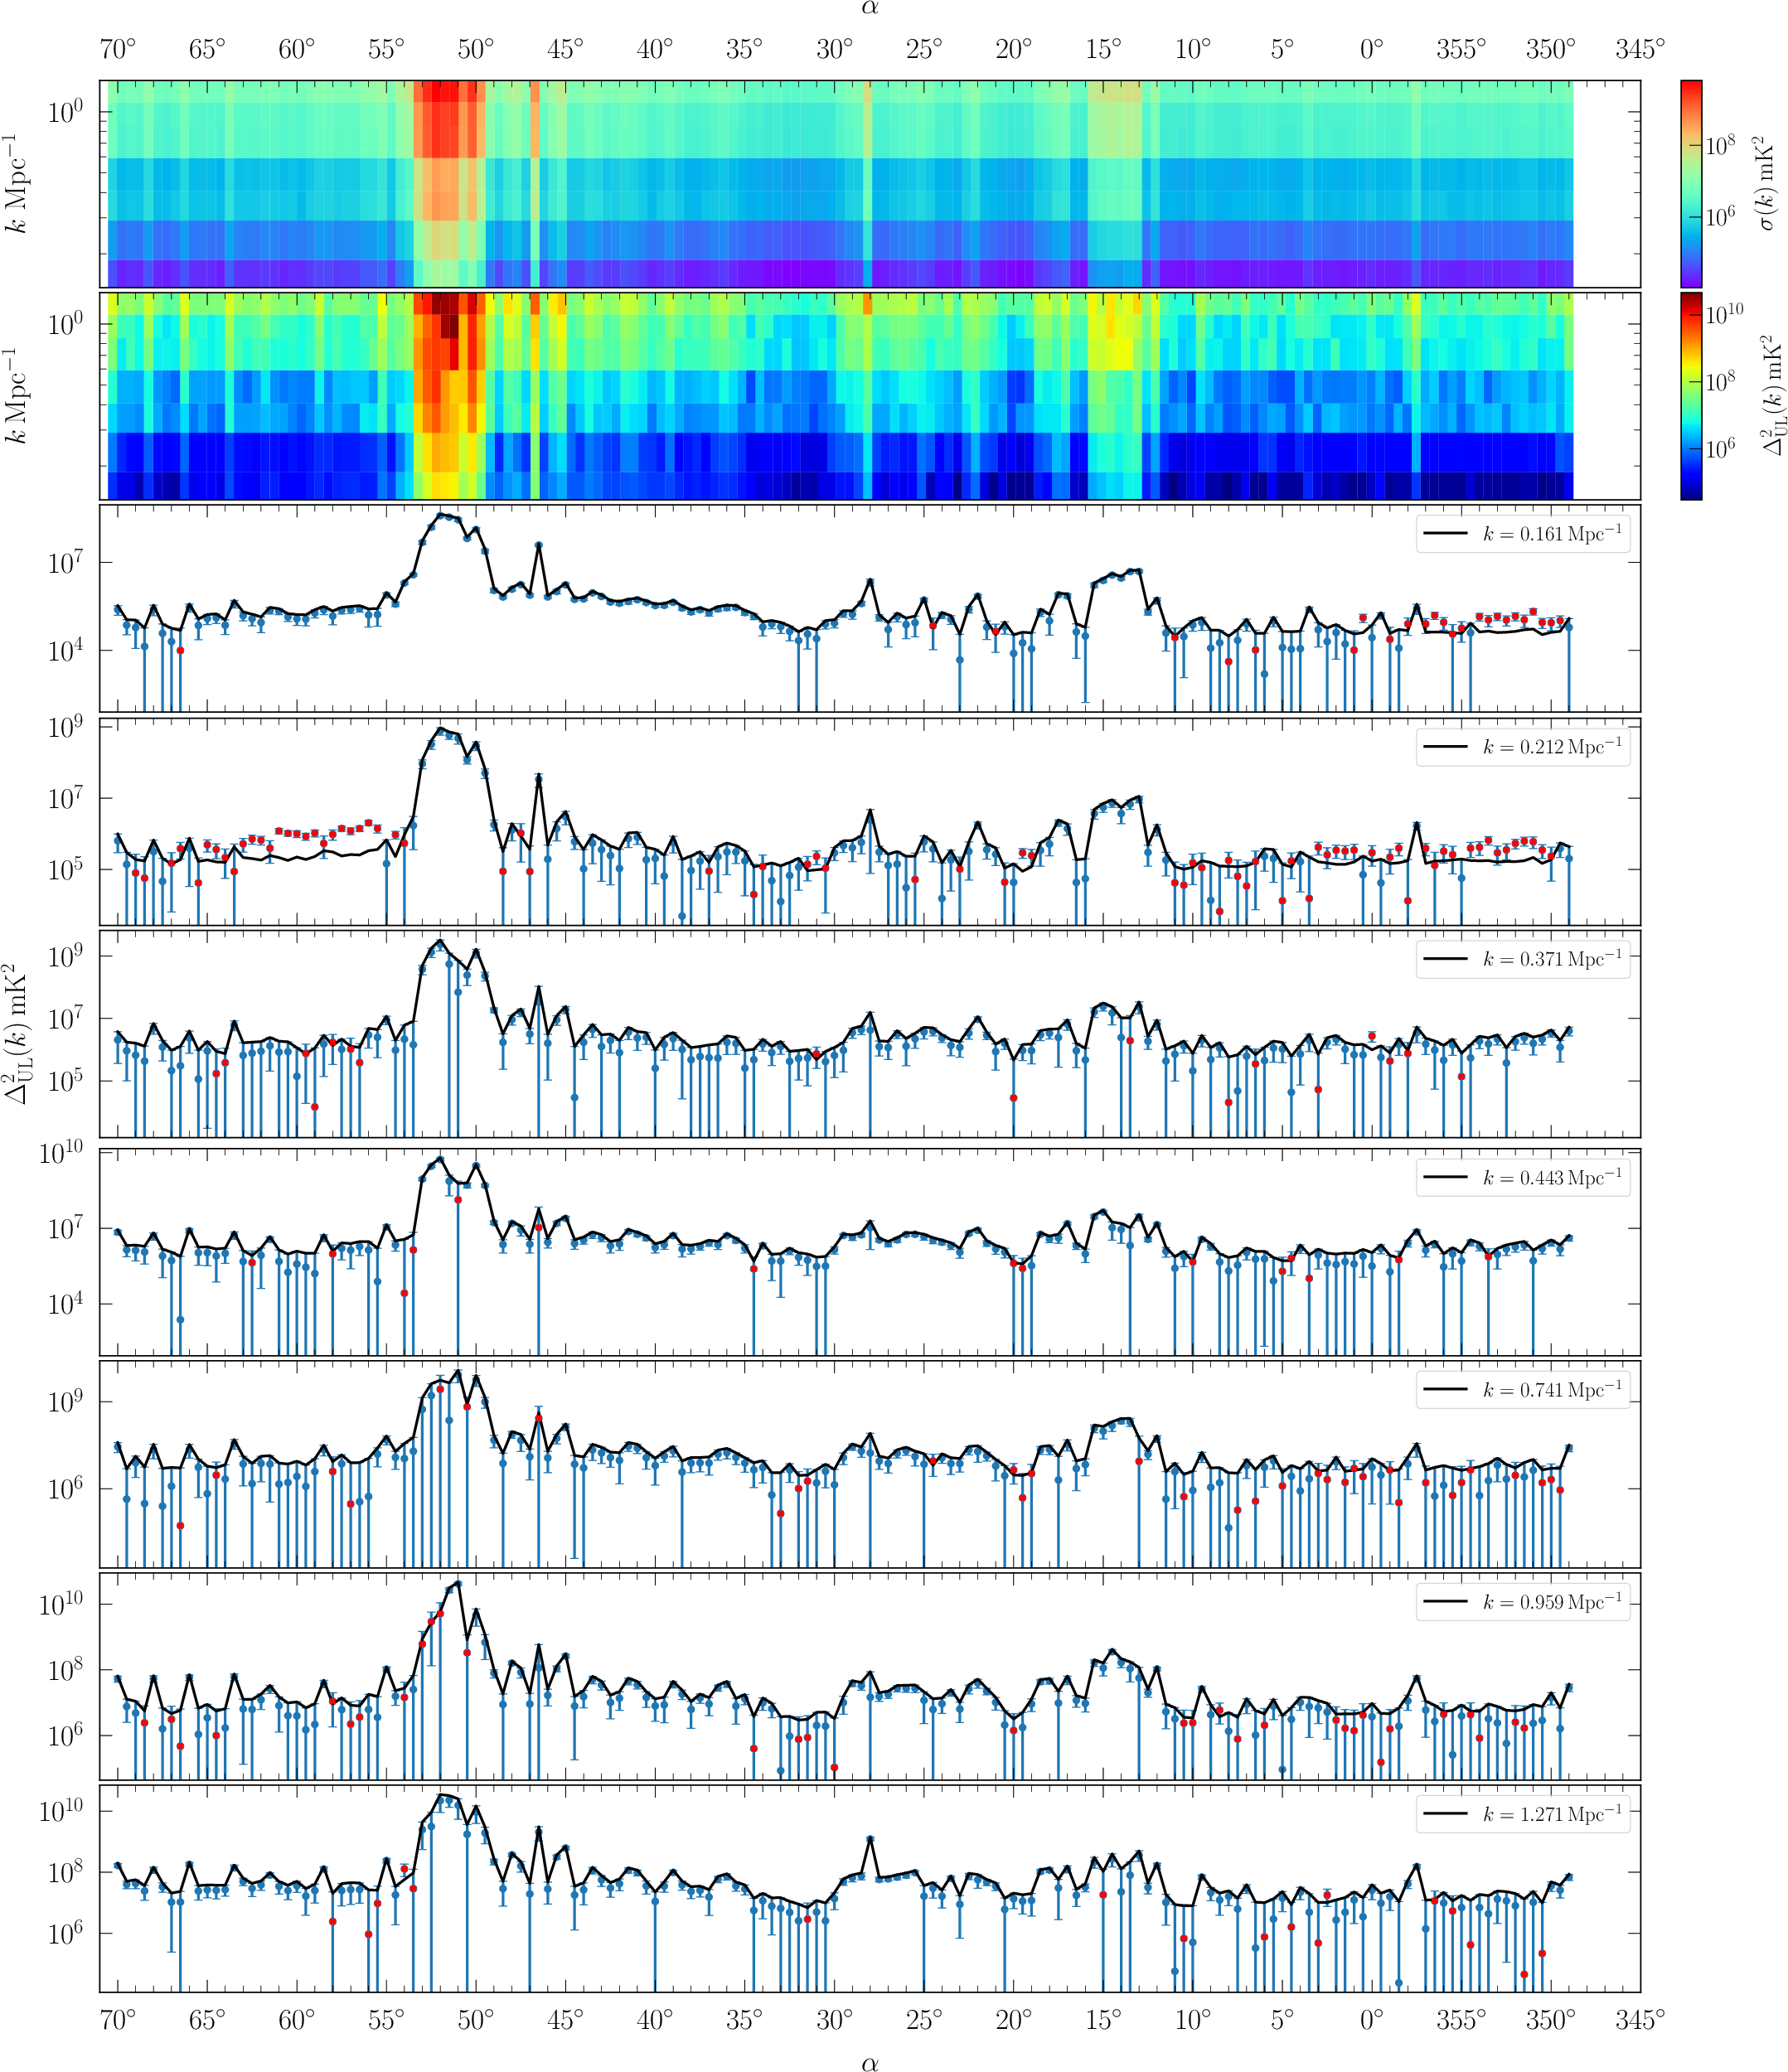
Figure 7: Heatmaps and line cuts showing the dependence of uncertainty $154.2$5 and upper limits $154.2$6 as a function of $154.2$7 and $154.2$8, illustrating the impact of foregrounds and effectiveness of field selection.
Incoherent Combination and Upper Limit Synthesis
The major advancement in this study is the incoherent combination of $154.2$9 from multiple uncontaminated PCs, yielding a factor-of-three improvement in the 349.0∘≤α≤70.0∘0 upper limit over any single field. PC selection for combination is based on cumulative minimization of the upper limit, evaluated in multiple 349.0∘≤α≤70.0∘1-ranges. The resulting joint limit is 349.0∘≤α≤70.0∘2 at 349.0∘≤α≤70.0∘3 from 23 PCs. This is approximately three times lower than previous MWA constraints, and 349.0∘≤α≤70.0∘4 and 349.0∘≤α≤70.0∘5 times higher than LOFAR and HERA results, respectively, at comparable redshift and 349.0∘≤α≤70.0∘6. The combined limit remains 349.0∘≤α≤70.0∘7 orders of magnitude above standard theoretical expectations for the EoR 21-cm PS, indicating residual barriers due to instrument sensitivity and systematic suppression.
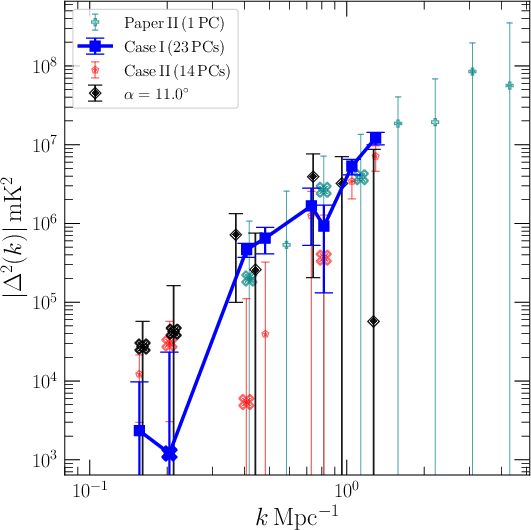
Figure 8: Best-fit 349.0∘≤α≤70.0∘8 with 349.0∘≤α≤70.0∘9 uncertainties for the joint analyses, alongside earlier one-pointing and literature values for reference and context.
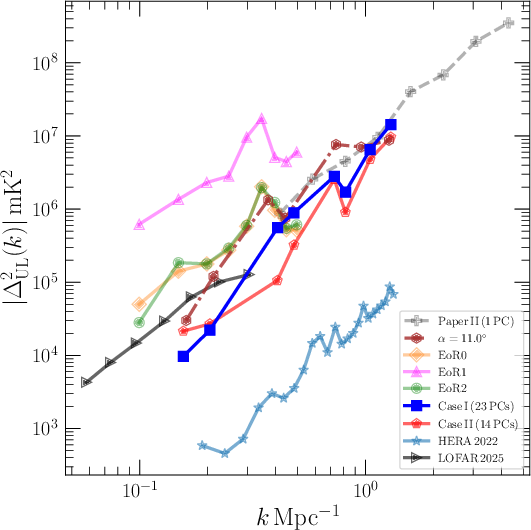
Figure 9: k0 upper limits in k1, demonstrating the improvement of this study relative to all prior MWA constraints, and situating the result among those from LOFAR and HERA.
Implications and Prospective Developments
The achievements in this study, particularly the joint-field upper limit and realization of robust field-selection strategies, provide compelling guidance for future EoR survey design, both for ongoing MWA operations and SKA-Low deployments. The application of the TTGE with SCF—particularly its resilience to missing channels and ability to recover uncontaminated EoR window Fourier modes—is validated at scale, with implications for other low-frequency arrays facing similar systematic challenges.
Furthermore, the explicit mapping of field-to-field foreground contamination at high angular resolution informs field selection not only for EoR PS measurements but also for higher-order cosmological statistics, such as the 21-cm bispectrum. While the combined upper limits are not yet sensitive enough to constrain standard reionization scenarios, these results impose constraints on non-standard or exotic models invoking, for example, a strong excess radio background.
Future prospects include implementation of coherent combination strategies (including phase information), further enhancement of foreground removal via direction-dependent calibration and improved beam models, and the extension of statistical techniques for joint estimation incorporating deeper integration or expanded frequency coverage. Given the overlap of MWA and SKA-Low survey regions, these procedures and findings set the stage for event deeper upper limits and ultimately, detection of the EoR 21-cm signal.
Conclusion
By systematically applying the TTGE with advanced smooth component filtering to 163 drift-scan pointings and optimally averaging multiple uncontaminated fields, this study establishes a new benchmark k2 upper limit for the EoR 21-cm power spectrum from the MWA at k3. The analysis underscores the critical importance of meticulous field selection, robust estimator design resilient to instrument systematics, and judicious combination of independent fields. These results not only improve the empirical constraints on EoR signal amplitudes but also deliver key methodological and observational guidance to the next generation of cosmological 21-cm surveys.