- The paper presents Tempov, a satellite foundation model that uses bi-temporal self-supervised pretraining to robustly map wealth indices in low-data settings.
- It employs a custom Vision Transformer with multispectral embedding and probabilistic regression, outperforming traditional methods on both static and dynamic predictions.
- Results show high R² scores across African nations, demonstrating scalable, cost-efficient wealth monitoring and effective handling of temporal shifts.
Satellite Foundation Modeling for Dynamic Wealth Monitoring: The Tempov Framework
Introduction and Context
The measurement and monitoring of economic well-being in low- and middle-income countries are persistently impeded by the scarcity, expense, and temporal lag of traditional ground-based surveys and censuses. Satellite imagery has emerged as a scalable alternative, but existing approaches exhibit diminished performance under temporal shifts and limited capacity to model dynamic, fine-grained socioeconomic variation. The paper "A satellite foundation model for improved wealth monitoring" (2604.23166) introduces Tempov, a multimodal satellite foundation model, to address these gaps. Tempov leverages large-scale bi-temporal self-supervised pretraining, robust multispectral embedding, and parameter-efficient fine-tuning to enable high-resolution, continent-scale mapping of both static and dynamic wealth indices.
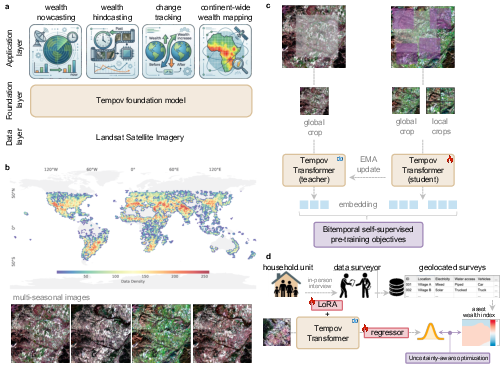
Figure 1: Tempov framework showcasing global pretraining, diverse application regimes (nowcasting, hindcasting, change-tracking), dataset distribution, pretraining paradigm, and downstream pipeline.
Model Architecture and Training Paradigm
Tempov employs an enhanced Vision Transformer (ViT-Large) architecture customized for six-channel Landsat surface reflectance inputs. Patch embedding weights for RGB bands are initialized from conventional pre-trained models, whereas extraspectral bands (NIR, SWIR-1, SWIR-2) begin as zero to preserve the feature distribution. The model is pretrained using bitemporal self-supervised objectives on a curated dataset of three million image pairs spanning multiple seasons and years, constructed to maximize radiometric (phenological) variance and enforce temporal invariance in learned representations.
The self-supervised framework utilizes teacher-student DINO and iBOT losses, adapted to focus on seasonal, rather than geometric, variation, facilitating semantic disentanglement of structural socioeconomic changes from transient environmental noise. Performance is further enhanced by a probabilistic regression head during fine-tuning, optimizing Gaussian negative log-likelihood to dynamically attenuate noise from label uncertainty inherent to household survey and census data. Fine-tuning employs low-rank adaptation (LoRA) to mitigate overfitting and accommodate low-label regimes.
Benchmarking Static and Dynamic Wealth Estimation
Tempov is evaluated against a suite of supervised and foundation model baselines, including DOFA, Prithvi-v2, DINOv3, CLAY-v1.5, CNN, XGBoost, and SwinV2-T. In static wealth estimation conducted on 2008/2018 Malawi and 2007/2017 Mozambique census datasets, Tempov consistently achieves the highest R2 (85–87% for Malawi; 73–74% for Mozambique), outperforming both geospatial and traditional baselines.
Critically, Tempov exhibits strong resilience in longitudinal tracking tasks where conventional models sharply degrade, often attaining near-random predictive power. Tempov maintains robust dynamic prediction with decadal-change R2 of 69% for Malawi and 46% for Mozambique (Figure 2). Embedding visualizations reveal that learned representations correspond with salient urban and agricultural features and maintain superior temporal consistency, underpinning dynamic wealth change estimation.
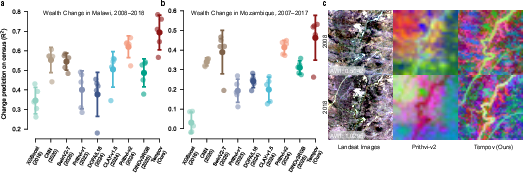
Figure 2: Decadal wealth change prediction benchmarking in Malawi/Mozambique; PCA visualization highlights semantic embedding structure.
A key contribution is Tempov’s adaptability in scenarios with severely limited ground truth. In zero-shot settings (training on historical labels, direct prediction on novel imagery), Tempov retains substantial predictive power and outperforms alternatives. Few-shot adaptation (incorporating only 5% of contemporary census labels) rapidly restores accuracy beyond competing models, many of which suffer from negative transfer across temporal shifts (Figure 3).
Retrospective hindcasting (training on current year, sparse historical adaptation) further demonstrates Tempov’s temporal bidirectionality, achieving R2=0.62 (Malawi) and $0.51$ (Mozambique) for reconstructing past wealth, and R2=0.31/$0.29$ for decadal change. Even under the most resource-constrained regime (5% historical plus 5% current labels, no census), Tempov maintains reasonable accuracy where alternatives collapse (R2∼0). Joint scaling of historical census priors and contemporary survey fractions reveals synergistic cost-efficiency, with Tempov matching full-sample baseline models using only 10% of survey data.
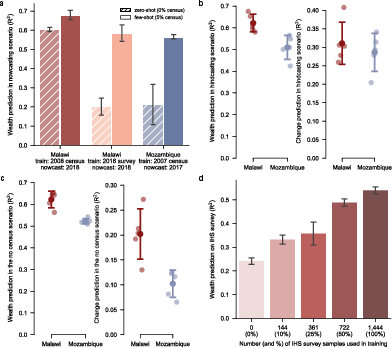
Figure 3: Wealth prediction and change benchmarking under extreme data scarcity, showing zero-shot, few-shot, hindcasting, and sample size scaling robustness.
Scalability and Global Generalization
Tempov’s capacity to generalize spatially and temporally is validated in Kenya, Nigeria, and Bangladesh, using sparse DHS survey clusters. Fine-tuned models achieve the highest R2 across states and demonstrate flexible spatial resolution deployment. Predicted maps delineate known intranational socioeconomic gradients, readily transforming sparse ground points into interpretable, country-scale asset wealth distributions (Figure 4).
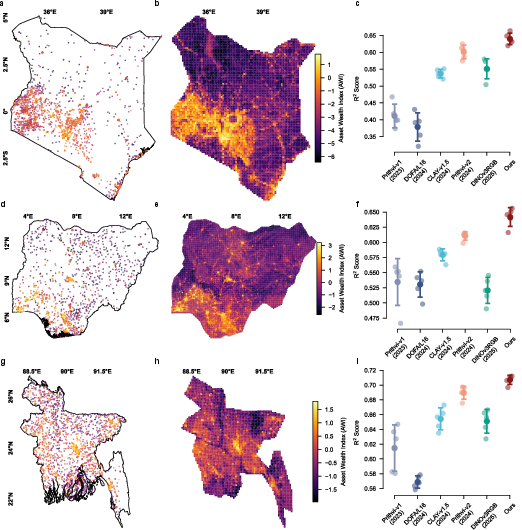
Figure 4: Ground truth and predicted Asset Wealth Index (AWI) maps for Kenya, Nigeria, and Bangladesh, with performance benchmarking against geospatial foundation models.
Continental-Scale Wealth Mapping for Africa
Leveraging harmonized, multi-country DHS datasets and efficient inference pipelines, Tempov is scaled to continent-wide, high-resolution asset wealth mapping across Africa. A unified model achieves cross-country R2=0.63, matching specialized single-country deployments. Wealth maps for 2015 and 2025 reveal substantial within- and cross-country heterogeneity; Theil decomposition shows 80% inequality is within-country. Decadal wealth change maps indicate spatially diverse gains and losses aligned with macroeconomic trends (GDP per capita), but also expose finer spatial heterogeneity not captured by national aggregates (Figure 5; Supplementary Figure 1).
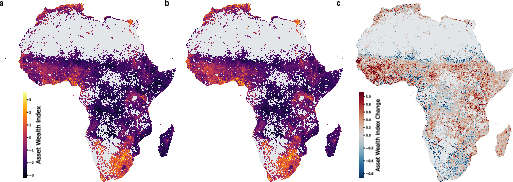
Figure 5: Predicted static wealth in 2015/2025 and decadal change across Africa with population density masking.
Analysis of Growth Determinants
Tempov’s decadal wealth changes display modest evidence for β-convergence (poorer areas marginally outpace richer), consistent with recent national account analyses. Decomposition analyses indicate local-level determinants (temperature trends, conflict intensity) explain more variance in wealth change than country-level institutional factors or remoteness (Supplementary Figure exfig:6). This points to the critical importance of integrating environmental and conflict granularity into future socioeconomic modeling.
Methodological and Practical Implications
Tempov demonstrates that satellite foundation modeling, anchored by robust seasonal and spatial invariance in representation learning, provides an efficient framework for high-frequency, high-resolution wealth monitoring. Its resilience to label scarcity, temporal drift, and spatial transfer positions it as a practical backbone for evidence-driven development targeting, disaster response, and evaluation, especially amid declining coverage of ground surveys.
Future work may focus on integrating multimodal auxiliary signals (e.g., mobile-phone metadata, object-level commercial imagery), explicit temporal modeling for richer sequence-based inference, and generalizing beyond asset wealth to more direct poverty statistics (income/consumption). Design-consistent calibration and uncertainty quantification remain central requirements for deployment in policy settings.
Conclusion
Tempov advances the state-of-the-art in dynamic wealth monitoring, unifying static and decadal measurement in resource-constrained environments, and scaling robustly to global deployments. Its methodological innovations facilitate accurate, timely, and scalable asset wealth mapping, enabling policy-relevant socioeconomic surveillance and targeted interventions using accessible satellite-based data. The paradigm represents a significant step toward democratized, low-cost, spatially-detailed economic evidence infrastructure for the global South.

