Can SOC Operators Explain their Decisions while Triaging Alarms? A Real-World Study
Abstract: Security Operations Centers (SOCs) are pivotal in modern enterprises. Tasked to monitor complex network environments constantly under attack, SOCs can be active 24/7 and can include hundreds of operators supported by state-of-the-art technologies. Abundant research has studied the internal processes of SOCs, highlighting their pros and cons, as well as the challenges faced by SOC analysts -- such as dealing with the overwhelming number of false alarms triggered by automated security mechanisms. In this context, we wonder: given that "someone" must triage the alarms, and that such triaging must be grounded on established knowledge or evidence-based reasoning, can SOC employees justify why a certain decision was taken while triaging alarms? Answering such a research question (RQ) can better guide future efforts. We hence tackle this RQs. First, via a systematic literature review across 257 research documents, we provide evidence that such RQ received limited attention so far. Then, we partner-up with a real-world SOC and carry out a field study (n=12) with SOC employees. We show them real alarms raised in their SOC, and inquire whether such alarms are indicative of true security problems or not. Then, we ask to explain their decision. We found that while most analysts were able to separate "true from false" alarms (the decision was correct in 83% of the cases), a correct justification was hardly provided (only 39% of the provided explanations reflected the actual root cause). Ultimately, our results highlight the need for decision-support systems that help SOC analysts not only make the right call -- but also understand and articulate why it is right.

Paper Prompts
Sign up for free to create and run prompts on this paper using GPT-5.
Top Community Prompts
Explain it Like I'm 14
What this paper is about
This paper looks at people who work in Security Operations Centers (SOCs) — teams that watch company computers and networks for cyberattacks. The big question is simple: when these analysts decide whether an alarm is a real threat or a false alarm, can they clearly explain why they made that decision?
What the researchers wanted to find out
The study focused on two main questions:
- Can SOC analysts explain their decisions when sorting (triaging) alarms?
- Are some types of alarms consistently harder to judge and explain than others?
Before running their own study, the authors also checked past research to see if anyone had already answered these questions.
How the study worked (in everyday terms)
Think of a SOC like a control room full of screens and sensors. Those sensors sometimes raise alarms. Some alarms point to real dangers (true positives), and some are false alarms (false positives), like a motion detector going off because of a cat instead of a burglar. Triaging is the act of quickly sorting which alarms matter and which don’t.
Here’s what the researchers did:
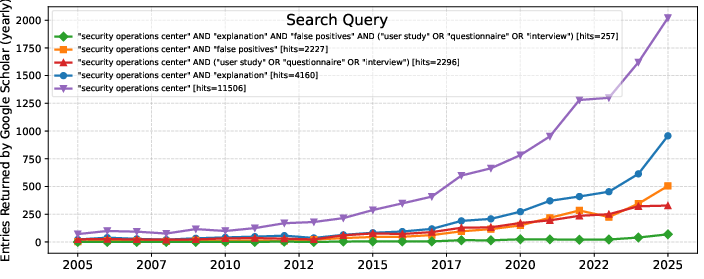
- First, they reviewed 257 previous research papers. They found very little work that tested whether real SOC analysts can explain their decisions, not just make them.
- Then they partnered with a real SOC in Europe.
- They asked 12 full-time SOC analysts to look at six different real alarm “cases” pulled from their actual system. These covered over 30,000 related log entries.
- For each case, analysts had to: 1) decide if it was a real threat or a false alarm, and 2) write, in their own words, why they decided that.
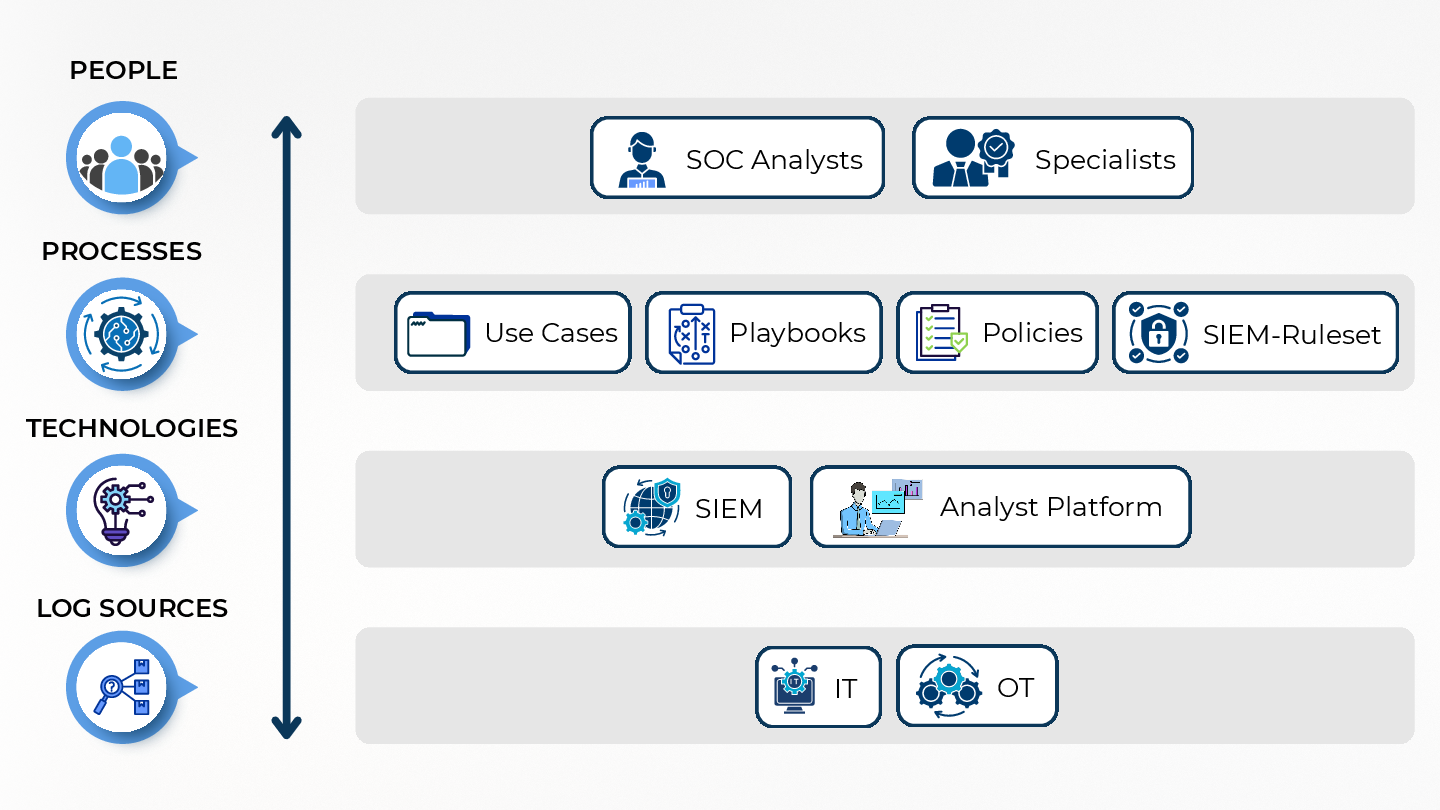
- The analysts used the same tools they normally use at work, including a SIEM system (a big log collector and analyzer that gathers lots of security data) and the company’s asset database (which says what devices are, who owns them, and what they’re supposed to do).
- The researchers then checked whether the decisions were correct and whether the explanations matched the real underlying cause.
Some technical terms explained simply:
- SIEM: like a huge inbox that gathers messages from all devices and helps spot suspicious patterns.
- True positive: a real threat caught by the system.
- False positive: an alarm that looks scary but is actually harmless.
- Triage: quickly sorting “urgent and real” from “not urgent or not real.”
What they found and why it matters
Big picture:
- Most analysts picked the right answer: about 83% of the decisions were correct.
- But only around a third of the time did analysts also give a correct, specific explanation of the true cause.
What that means:
- Many analysts could tell “this is fine” or “this is bad,” but often struggled to clearly explain why in a way another person could follow.
- This suggests that some decisions may be based on experience or gut feeling rather than on evidence they can point to and describe.
What was easy vs. hard:
- Easier cases: For example, alarms caused by a scheduled internal scan or developer-approved traffic. With a clear clue (like a known scanner’s ID in the asset database), analysts could both decide and explain well.
- Harder cases: Alerts involving network hiccups (like Wi‑Fi retransmissions) or misclassified routine Windows checks (traffic to “msftconnecttest,” which Windows uses to test internet access). Many analysts guessed correctly that these were harmless, but couldn’t tie their explanation to the real reason.
- Real threats: Some true-attack cases (like a malicious PowerShell script or communication to a “command-and-control” server used by malware) were identified correctly by many analysts, but explanations were often vague (e.g., essentially repeating the alarm’s title) rather than showing what evidence made it truly suspicious.
Other interesting patterns:
- More experience or higher confidence didn’t always mean better explanations.
- The best explanations came from people who:
- Cross-checked multiple clues (e.g., IP addresses, domains, user names),
- Matched what they saw in the SIEM with the asset database,
- Looked for patterns over time, not just one event,
- Wrote down clear reasoning, not just conclusions.
- Some participants said they felt key context was “missing,” even though the normal tools were available—hinting that information might be hard to find or connect quickly under time pressure.
What the literature review showed:
- There’s surprisingly little prior research that tests whether SOC analysts can explain their decisions in real settings. The authors found only one somewhat similar small study.
Why this research matters
If analysts can’t easily explain their decisions, even when they’re correct, that can cause problems:
- It’s harder to train others or review past decisions.
- It’s tougher to communicate with customers about what happened and why.
- It may hide risky habits (like relying too much on intuition).
The study suggests we should:
- Build better decision-support tools that don’t just flag alarms, but also show clear, evidence-based “why” explanations (for example, linking an alarm to known device roles or to earlier events).
- Use automated rules to filter out the simplest, repeat false alarms (like scheduled scans), so analysts can spend time on the tricky cases.
- Improve training and playbooks to teach how to collect and write down evidence clearly.
- Design SIEM views that make the right context easier to find quickly.
In short: Analysts are good at spotting what’s real and what’s not, but they often struggle to explain their reasoning. Helping them explain better can improve trust, reduce mistakes, and make SOCs more effective.
Knowledge Gaps
Knowledge gaps, limitations, and open questions
Below is a focused list of what the paper leaves unresolved, uncertain, or unexplored, formulated to be actionable for future research:
- Generalizability: Single-SOC, single-region sample (n=12, DACH) limits external validity; replicate across diverse SOCs (sizes, sectors, geographies, maturity levels, SIEM vendors) to assess robustness.
- Sample size and selection: Small volunteer sample may introduce selection bias; expand participant pool and include non-volunteers and multiple shifts to capture variability (fatigue, workload, handovers).
- Collaborative realism: Triaging was individual and communication was disallowed, whereas real SOC triage often involves collaboration and escalation; study the effect of collaboration on explanation quality.
- Time pressure effects: Fixed 30-minute cap (~5 minutes/case) may skew reasoning toward heuristics; manipulate time budgets systematically to quantify how time pressure impacts explanation depth and accuracy.
- Case coverage and balance: Only six cases (4 FPs, 2 TPs) selected qualitatively; broaden and balance case taxonomy (alert types, benign triggers, misconfigs, malware, insider, OT, cloud) with formal difficulty ratings.
- Case order and learning effects: Case ordering and counterbalancing are not reported; randomize and counterbalance to control for order and learning effects.
- Ground-truth clarity: Internal inconsistencies (e.g., Case 4 footnote suggests TP despite table labeling as FP) raise ambiguity; ensure unambiguous, independently validated ground truth and publish a clear adjudication protocol.
- Anonymization and context loss: Sanitization may remove context critical for explanation; quantify the impact of anonymization on analysts’ ability to reason and evaluate mitigation strategies (synthetic context fields).
- Tooling scope: Participants were restricted to the SOC’s standard stack and prohibited AI use; evaluate how additional resources (threat intel portals, vendor consoles, LLM copilots) affect explanation quality.
- Ecological validity vs. instrumentation: No clickstream/telemetry of analyst actions; instrument the environment (queries, pivots, fields viewed) to locate breakdowns in the reasoning workflow.
- Base-rate knowledge: Participants were not told TP/FP base rates; experimentally vary base-rate information to measure its effect on triage and justification.
- Measurement construct for “explanation quality”: Binary/tri-level coding (correct/incorrect/vague) may not capture partial correctness or utility for different stakeholders; develop and validate a granular, multi-criteria rubric (specificity, evidence use, reproducibility, stakeholder utility).
- Dependence of explanation on classification: Automatically marking explanations “incorrect” when classification is wrong conflates constructs; assess explanation quality independently to analyze reasoning even in misclassifications.
- Coder bias and reliability: R1 had final adjudication and extra context; report inter-rater reliability metrics (e.g., Cohen’s kappa) and test whether access to proprietary context systematically shifts coding outcomes.
- Language/translation effects: Cross-language coding (machine translation for one coder) may introduce interpretation error; assess translation impact or standardize coding in a single language.
- Statistical power and analysis: Claims about (non)correlation with confidence/experience are based on small n without inferential stats; increase sample size and use appropriate models (e.g., mixed-effects logistic regression).
- Outcome breadth: Study focuses on immediate justification quality but not downstream outcomes (escalation correctness, MTTR, incident containment); link explanation quality to operational and business outcomes.
- Training interventions: No evaluation of whether targeted training (explanation templates, cognitive debiasing, playbook scaffolds) improves justification quality; design controlled training studies.
- Decision-support requirements: Conclusion calls for decision-support but does not elicit concrete user requirements; conduct requirement engineering (e.g., card sorting, think-aloud, diary studies) to specify features that aid explanation.
- Human vs. machine explanations: Paper does not compare human-generated explanations with SIEM/XAI-generated rationales; run head-to-head studies to quantify complementarity and trust effects.
- Cognitive load: Cognitive load was not measured; integrate validated instruments (e.g., NASA-TLX) to relate load to explanation performance and tool usability.
- Experience gradients: Prior roles varied, but the study lacks fine-grained analysis of domain-specific expertise (networking, EDR, Windows internals) on case-type-specific explanation accuracy; stratify analyses by skill domains.
- Case attributes and predictability: No modeling of which alert features (e.g., number of events, diversity of log sources, enrichment depth) predict explanation difficulty; build predictive models to target decision-support.
- Documentation norms: Open-text explanations may differ from real case-management documentation practices; compare explanations produced under routine documentation workflows vs. study conditions.
- Reproducibility and data sharing: Proprietary data and anonymization constraints hinder replication; provide shareable synthetic-but-faithful datasets, schemas, and coding guidelines for community benchmarking.
- SLR scope and completeness: SLR relied mainly on Google Scholar and specific keywords; extend to multiple databases (ACM DL, IEEE Xplore, Scopus), include grey literature where appropriate, and publish full inclusion/exclusion criteria with reliability metrics.
- Consistency of reported metrics: Discrepancy between 31%, 37%, and 39% figures for explanation correctness appears in text/tables; standardize metric definitions and report confidence intervals.
- Ethical and Hawthorne effects: Onsite, synchronous setting may induce observation effects; compare results with remote/asynchronous settings and blinded facilitation to control for reactivity.
- Shift and fatigue effects: Study timing (single session) does not capture circadian or fatigue influences; sample across shifts and after high-alert-volume periods.
- Impact of playbooks and asset context: Participants noted “missing information” despite access; audit which contextual fields/playbooks are actually consulted and test augmentations (e.g., asset role cards, policy overlays).
- Minimal viable explanation (MVE): The study assumes an explanation useful to other analysts; define and validate MVE criteria for different audiences (peers, customers, auditors) and use them as outcome measures.
- Compliance and auditability: Unclear how explanation quality aligns with regulatory/audit requirements (e.g., ISO 27001); map explanation rubrics to compliance controls and test audit acceptability.
- Longitudinal learning: No assessment of whether explanation practice improves over time; run longitudinal studies to capture learning curves and retention.
Practical Applications
Overview
The paper investigates whether SOC (Security Operations Center) analysts can both classify alarms correctly and explain their triage decisions. In a real-world field study (n=12, 6 representative cases, >30k events), analysts correctly classified 83% of alerts but provided correct, root-cause explanations only 39% of the time (31% across all decisions). Explanation quality did not track seniority or self-confidence; success correlated with deliberate evidence use (multiple log fields, asset context, pattern triangulation). Certain alerts (e.g., scheduled scans) were easy to explain; others (e.g., developer-allowed traffic, connectivity checks, retransmissions) were frequently “guessed right” but poorly justified. The study underscores a gap: current SOC workflows/tools support decision accuracy more than justification quality, suggesting the need for decision-support and explanation-first processes.
Below are practical applications derived from the paper’s findings, methods, and innovations, grouped by deployment horizon.
Immediate Applications
These can be acted on now with existing SOC stacks (SIEM, case management, asset inventory) and incremental process or UI changes.
- Industry (SOCs/MSSPs): Explanation-centered triage templates and QA
- What: Add structured “explain-your-decision” sections to case management with required evidence fields (e.g., specific log attributes, asset role, correlation rule, alternative hypotheses rejected). Implement random QA sampling for “explanation adequacy.”
- Tools/workflows: Case-management plug-ins; mandatory fields with dropdowns + free-text; auditor dashboards for “explanation adequacy rate.”
- Sectors: All SOC-driven sectors; especially regulated (finance, healthcare, energy).
- Assumptions/dependencies: Analyst buy-in; tuned templates that don’t add excessive overhead; management support for QA.
- Industry (SOCs): Alert-hardness scoring and routing
- What: Tag classes of alerts as “trivial,” “context-dependent,” or “complex” based on empirical difficulty; route complex alerts to experienced analysts and adjust SLAs.
- Tools/workflows: Rule metadata in SIEM; triage queue routing logic.
- Sectors: Finance, energy/OT, telecom (high alert volumes).
- Assumptions/dependencies: Initial calibration based on internal historical performance; continuous review.
- Industry (SOCs): Context-aware suppression and rule refinements
- What: Adjust correlation rules to suppress predictable false positives when context confirms benign causes (e.g., scheduled scanners, developer-allowed egress, connectivity test domains, known retransmission patterns).
- Tools/workflows: SIEM rule tuning; asset-inventory joins; allowlists tied to change control.
- Sectors: Enterprise IT, software development orgs, OT/ICS environments.
- Assumptions/dependencies: Up-to-date asset database; effective change management to avoid over-suppression.
- Industry (Vendors/SOCs): “Evidence panel” in SIEM/Case UI
- What: UI panel that auto-aggregates context (asset role, recent changes, known benign triggers, similar past cases) and shows which fields support/contradict hypotheses.
- Tools/products: Lightweight SIEM UI extension; case-management widgets.
- Sectors: Software/SIEM vendors, MSSPs.
- Assumptions/dependencies: API access to SIEM and asset DB; privacy controls for sensitive fields.
- Industry (SOCs/MSSPs): Analyst coaching using real-case “explanation drills”
- What: Short, timed training using sanitized internal cases mimicking the study’s format; emphasis on justifying decisions with references to specific evidence.
- Tools/workflows: LMS modules; periodic tabletop drills; internal knowledge-base entries.
- Sectors: All; especially organizations onboarding junior analysts.
- Assumptions/dependencies: Availability of sanitized historical cases; protected training environment.
- Industry (SOCs): Ticket closure gates tied to explanation quality
- What: Require referenced evidence (e.g., IPs, rule IDs, asset roles) for closure; prevent closure if explanation fields are empty or generic (“tool flagged it”).
- Tools/workflows: Case-management validation rules; manager override for exceptions.
- Sectors: Regulated industries; customer-facing MSSPs (to improve report quality).
- Assumptions/dependencies: Policy alignment; UX that doesn’t impede urgent response.
- Policy/Compliance: Procurement criteria and audit readiness
- What: Include “explanation support” features in tool/vendor evaluations and internal audits (e.g., traceability from alert to evidence and rationale).
- Tools/workflows: RFP checklists; audit control mappings (ISO 27001, NIS2); SOC KPIs for “explanation adequacy.”
- Sectors: Finance, healthcare, critical infrastructure.
- Assumptions/dependencies: Clear internal definition of adequate explanation; auditor guidance.
- Academia/Training: Curriculum modules for evidence-backed triage
- What: Integrate exercises that separate decision accuracy from justification quality; grade on both metrics.
- Tools/workflows: University labs; CTF-style SOC scenarios with rubric for explanations.
- Sectors: Education; workforce development.
- Assumptions/dependencies: Access to realistic datasets or sanitized logs.
- Cross-domain Operations Centers (NOCs, OT operations, cloud SRE): “Explain your intervention” practices
- What: Adopt justification templates when acknowledging, suppressing, or escalating alerts/incidents in non-security OCs.
- Tools/workflows: ITSM tooling templates; runbook updates.
- Sectors: Cloud/SaaS, telecom NOC, energy OT monitoring.
- Assumptions/dependencies: Cultural adoption; minimal overhead in high-velocity environments.
Long-Term Applications
These require additional research, development, integration, or standardization.
- Industry/Vendors: Explanation-aware SIEM/SOAR with root-cause inference
- What: Build pipelines that surface likely benign triggers or root causes with provenance links (e.g., “scan from asset X, allowlisted change ticket #1234,” “Windows NCSI connectivity checks via msftconnecttest”).
- Tools/products: SIEM correlation upgrades; rule engines with causal graphs; SOAR playbooks suggesting explanations.
- Sectors: SIEM/EDR/SOAR vendors; large SOCs.
- Assumptions/dependencies: Robust asset and change data; explainability UX; evaluation on varied environments.
- Industry/Vendors/SOCs: Analyst-in-the-loop AI assistants for explanations
- What: On-prem LLMs or specialized models that draft explanations with citations to specific logs, assets, and rule IDs; analysts edit/approve.
- Tools/products: Secure LLM inference; retrieval-augmented generation from SIEM/case data; red-teaming for hallucination risks.
- Sectors: Regulated industries; MSSPs with strict data controls.
- Assumptions/dependencies: Data privacy; hallucination mitigation; provenance enforcement; user trust.
- Policy/Standards: Definitions and metrics for explanation quality
- What: Standardize what constitutes a “sufficient” explanation for alert handling (field references, hypothesis testing, context usage), and include it in frameworks (e.g., extensions to ISO 27001 controls, SOC maturity models).
- Tools/workflows: Industry working groups; audit checklists; benchmarking consortia.
- Sectors: Finance, healthcare, energy (regulators, standards bodies).
- Assumptions/dependencies: Community consensus; avoiding one-size-fits-all prescriptions.
- Research/Academia: Public benchmarks and datasets for SOC explainability
- What: Build anonymized, permissioned datasets with ground-truth labels and “gold” explanations to evaluate tools and training.
- Tools/workflows: Data-sharing agreements; synthetic-but-realistic scenarios; scoring rubrics (accuracy + explanation quality).
- Sectors: Academia, vendors, SOCs; cross-sector collaboration.
- Assumptions/dependencies: Legal/privacy approvals; representativeness across SOCs.
- Industry/Vendors: “Alert difficulty” prediction for workforce optimization
- What: Use historical performance to train models predicting explanation difficulty; inform staffing, training, and auto-escalation rules.
- Tools/products: ML pipelines; routing policies in case management.
- Sectors: Large SOCs/MSSPs with high alert velocity.
- Assumptions/dependencies: Sufficient historical labeled data; fairness and bias controls.
- UX/HCI Research: Low-cognitive-load triage interfaces
- What: Redesign SIEM/case UIs to guide evidence gathering (progressive disclosure, guided checklists, in-context asset summaries) and reduce cognitive overhead observed in the study.
- Tools/products: SIEM plugins; design systems; usability trials.
- Sectors: Software vendors; enterprise SOCs.
- Assumptions/dependencies: Vendor extensibility; measured impact on speed and accuracy.
- OT/ICS Security: Domain-specific explainability libraries
- What: Codify benign triggers and normal patterns unique to OT (e.g., PLC polling, scheduled maintenance) and their explanations, to reduce misclassification and improve justifications.
- Tools/products: OT-specific correlation packs; playbooks; knowledge bases.
- Sectors: Energy, manufacturing, utilities.
- Assumptions/dependencies: Vendor cooperation; asset fidelity; safety and change control constraints.
- Compliance/Customer Reporting: Explanation transparency as a service feature
- What: Offer customers structured, evidence-backed rationale in SOC reports; align with audit trails and SLAs (differentiation for MSSPs).
- Tools/products: Report generators using explanation templates; customer portals with evidence provenance.
- Sectors: MSSPs; B2B SaaS with managed detection.
- Assumptions/dependencies: Data sharing agreements; clarity on exposure of internal fields.
- Education/Certification: Dual-metric performance credentials
- What: Certify analysts on both decision accuracy and explanation quality using standardized labs; integrate into professional certifications.
- Tools/workflows: Certification bodies’ blueprints; proctored lab exams.
- Sectors: Cyber workforce development; government upskilling programs.
- Assumptions/dependencies: Industry adoption; defensible scoring.
- Cross-SOC Studies and Replication: External validity and generalization
- What: Multi-organizational studies replicating this methodology to identify universal vs. SOC-specific pain points; feed into best practices.
- Tools/workflows: Federated study protocols; shared IRB/ethics frameworks; meta-analyses.
- Sectors: Academia, large enterprises, government SOCs.
- Assumptions/dependencies: Participation incentives; standard case formats; confidentiality mechanisms.
Notes on Feasibility and Dependencies
- High-quality asset inventories and change management data are critical for context-aware suppression and explanation features.
- Vendor and tool extensibility (APIs, UI customization) will determine the speed of implementing explanation panels and closure gates.
- AI-based solutions must address privacy, provenance, and hallucination; on-prem deployments or robust data minimization may be necessary in regulated sectors.
- Organizational culture and incentives matter: explanation requirements must be balanced against triage speed to avoid analyst burnout.
- Definitions of false positives vs. benign triggers vary; converging on internal definitions is a prerequisite for consistent training and QA.
- Datasets for academia/benchmarks require careful sanitization and legal approvals; synthetic augmentation may be needed to ensure representativeness.
Glossary
- Alert fatigue: A state of desensitization and reduced responsiveness caused by an overwhelming volume of alerts. "Such processes lead to the well-known alert fatigue and decrease the efficiency of SOC employees"
- Asset database: An internal repository that stores contextual information about assets (e.g., device roles, owners, segments) to support investigations. "Accept; system role identified in asset database"
- Benign triggers: Events that superficially resemble malicious behavior but originate from legitimate causes. "so-called benign triggers"
- Botnet: A network of compromised machines controlled by an attacker, often used for coordinated malicious activities. "Suspected Botnet"
- Case-management platform: A system used to triage, track, and document alerts and incidents within a SOC. "a dedicated case-management platform where alarms are triaged and documented"
- Command and Control (C2): Infrastructure used by attackers to remotely control compromised systems. "Outbound C2 communication"
- Cognitive load: The mental effort required to process information and make decisions. "which increases the cognitive load and influence the analysis"
- Correlation pipeline: The processing chain that normalizes, enriches, and correlates events to produce alerts. "the production correlation pipeline"
- Data enrichment: Augmenting raw log data with contextual information (e.g., asset roles, threat intel) to improve analysis. "data normalization, enrichment, rule-based matching and temporal correlation"
- Data normalization: Transforming heterogeneous logs into a standardized schema for consistent analysis. "data normalization, enrichment, rule-based matching and temporal correlation"
- Decision-support systems: Tools that help analysts make, understand, and articulate decisions about alerts. "decision-support systems"
- DNS trap: A defensive technique (often a sinkhole) that intercepts DNS queries to block or observe suspicious domains. "DNS trap and malware action confirm C2 activity"
- Ecological validity: The degree to which a study mirrors real-world conditions, ensuring findings generalize to practice. "increasing the ecological validity of our study"
- Endpoint Detection and Response (EDR): Endpoint security tools that detect, investigate, and respond to threats on hosts. "recognised as malicious by the EDR"
- eXplainable AI (XAI): Methods that make AI model decisions understandable to humans. "assessing the quality of eXplainable AI techniques in a SOC context."
- False positive: An alert indicating a threat where none exists. "False Positive - trivial"
- Ground truth: The verified factual status of an event or label used to evaluate correctness. "to confirm its factual ground truth."
- Industrial control systems (ICS): Systems that monitor and control industrial processes and equipment. "industrial control systems"
- Likert scale: A psychometric scale for capturing attitudes or perceptions, typically with ordered response options. "5-point Likert scale"
- Nessus: A widely used vulnerability scanner that probes systems for known weaknesses. "scheduled Nessus vulnerability scan"
- Operational Technology (OT): Hardware and software that monitors or controls physical processes and devices in industrial environments. "Operational Technology (OT)"
- Playbooks: Predefined procedures and guidance documents that standardize incident handling. "playbooks"
- PRISMA guidelines: A methodology for conducting and reporting systematic literature reviews. "PRISMA guidelines"
- Programmable logic controller (PLC): An industrial digital computer used to automate electromechanical processes. "PLC"
- Security Information and Event Management (SIEM): Platforms that collect, normalize, correlate, and analyze security logs and events. "system information and event management (SIEM) platforms"
- Security Operations Center (SOC): A centralized unit responsible for monitoring, detecting, and responding to security incidents. "Security Operations Centers (SOCs) are pivotal in modern enterprises."
- Snowball method: A literature review technique that follows references from relevant papers to discover additional works. "snowball method"
- Syslog: A standard protocol for message logging from devices and applications. "(e.g., syslogs)"
- Temporal correlation: Linking events over time windows to identify patterns indicative of security-relevant activity. "data normalization, enrichment, rule-based matching and temporal correlation"
- Think-aloud approach: A usability and research method where participants verbalize their thought processes during tasks. "think-aloud approach"
- Triaging (alarms): The process of quickly assessing and prioritizing alerts for further action or dismissal. "triage the alarms"
- True positive: An alert that correctly indicates a real security issue. "True Positive"
- Windows Network Connectivity Status Indicator (NCSI): A Windows mechanism that checks for internet connectivity (often via msftconnecttest). "msftconnecttest is legitimate Windows Network Connectivity Status Indicator traffic, but in this case the host generating it should never have done so (a true alarm)."
Collections
Sign up for free to add this paper to one or more collections.