- The paper presents a post hoc XAI analysis of MicrobiaNet, revealing that visual ambiguity between colony classes primarily limits model accuracy.
- It demonstrates that class imbalance has minimal impact while reducing class granularity significantly improves F1 scores.
- The study suggests that non-discriminative methods, like density map regression, may better capture subtle inter-class differences in biomedical imaging.
Explainability for Cardinality Classification in Bacterial Colony Counting
Introduction
Automated counting of bacterial colonies is an essential tool in microbiology, underpinning applications in surface hygiene, product sterility, and infection diagnostics. Recent years have seen the proliferation of deep learning-based methodologies for bacterial colony counting, with state-of-the-art models such as MicrobiaNet reconceptualizing the task from object detection to cardinality classification: assigning each image segment to a discrete colony count class. However, persistent limitations remain, notably a systematic degradation in accuracy for segments containing three or more colonies. This study conducts a comprehensive investigation of the MicrobiaNet paradigm using post hoc explainable artificial intelligence (XAI) techniques, examining algorithmic behavior, the constraints imposed by high inter-class visual similarity, and the confounding role of class imbalance.
MicrobiaNet and Microbia Dataset Overview
MicrobiaNet is a relatively shallow CNN architecture (four convolutional layers plus a dense layer) optimized for cardinality classification on masked image patches extracted from culture plates. The Microbia dataset comprises 28,418 manually labeled segments, with classes for outliers (non-colonies), one- through six-colony clusters, reflecting both significant visual overlap between classes and a highly imbalanced label distribution (dominance of the one-colony class).
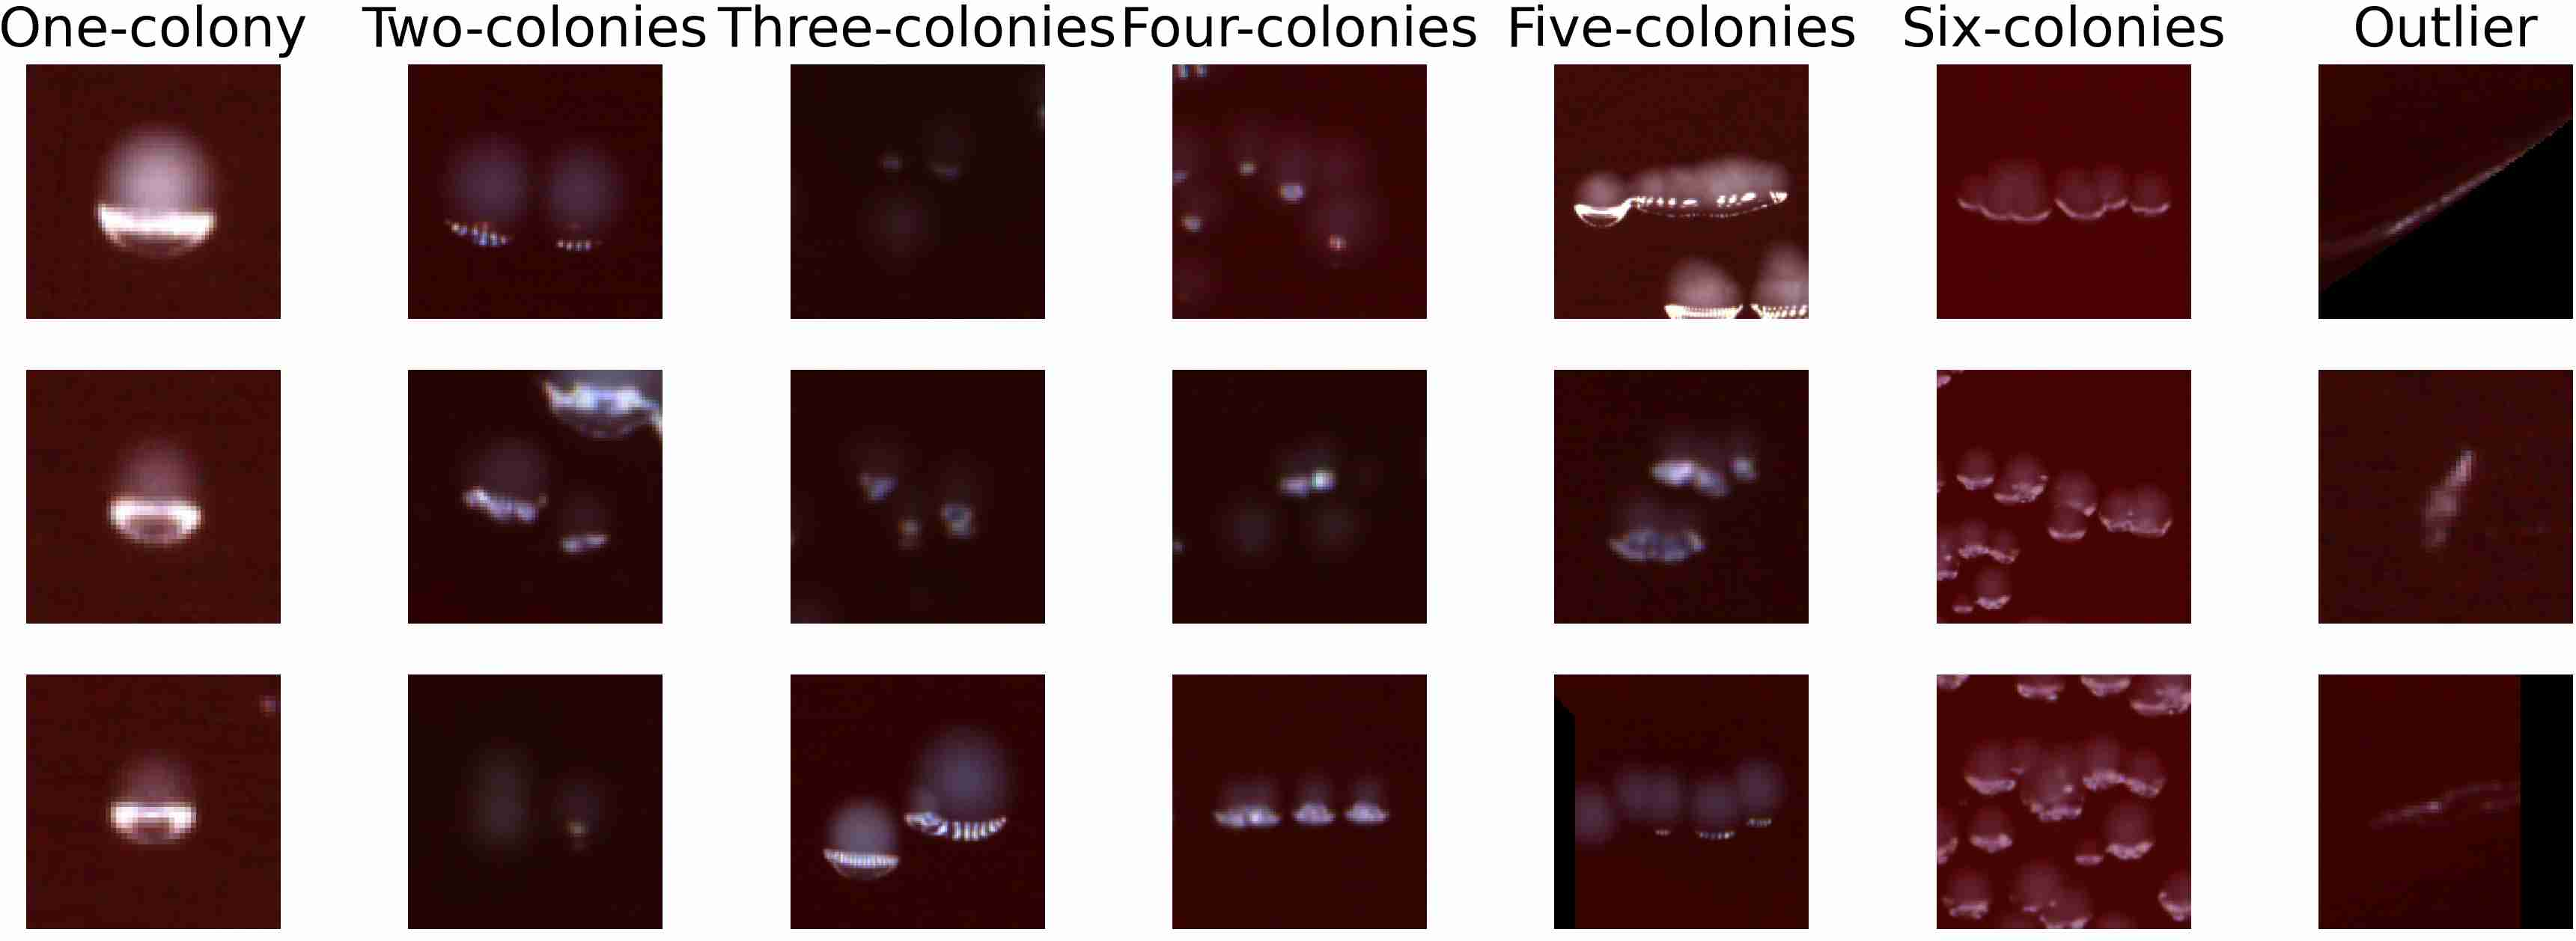
Figure 1: Example image segments from seven distinct classes demonstrating the visual ambiguity, especially among high-cardinality clusters.
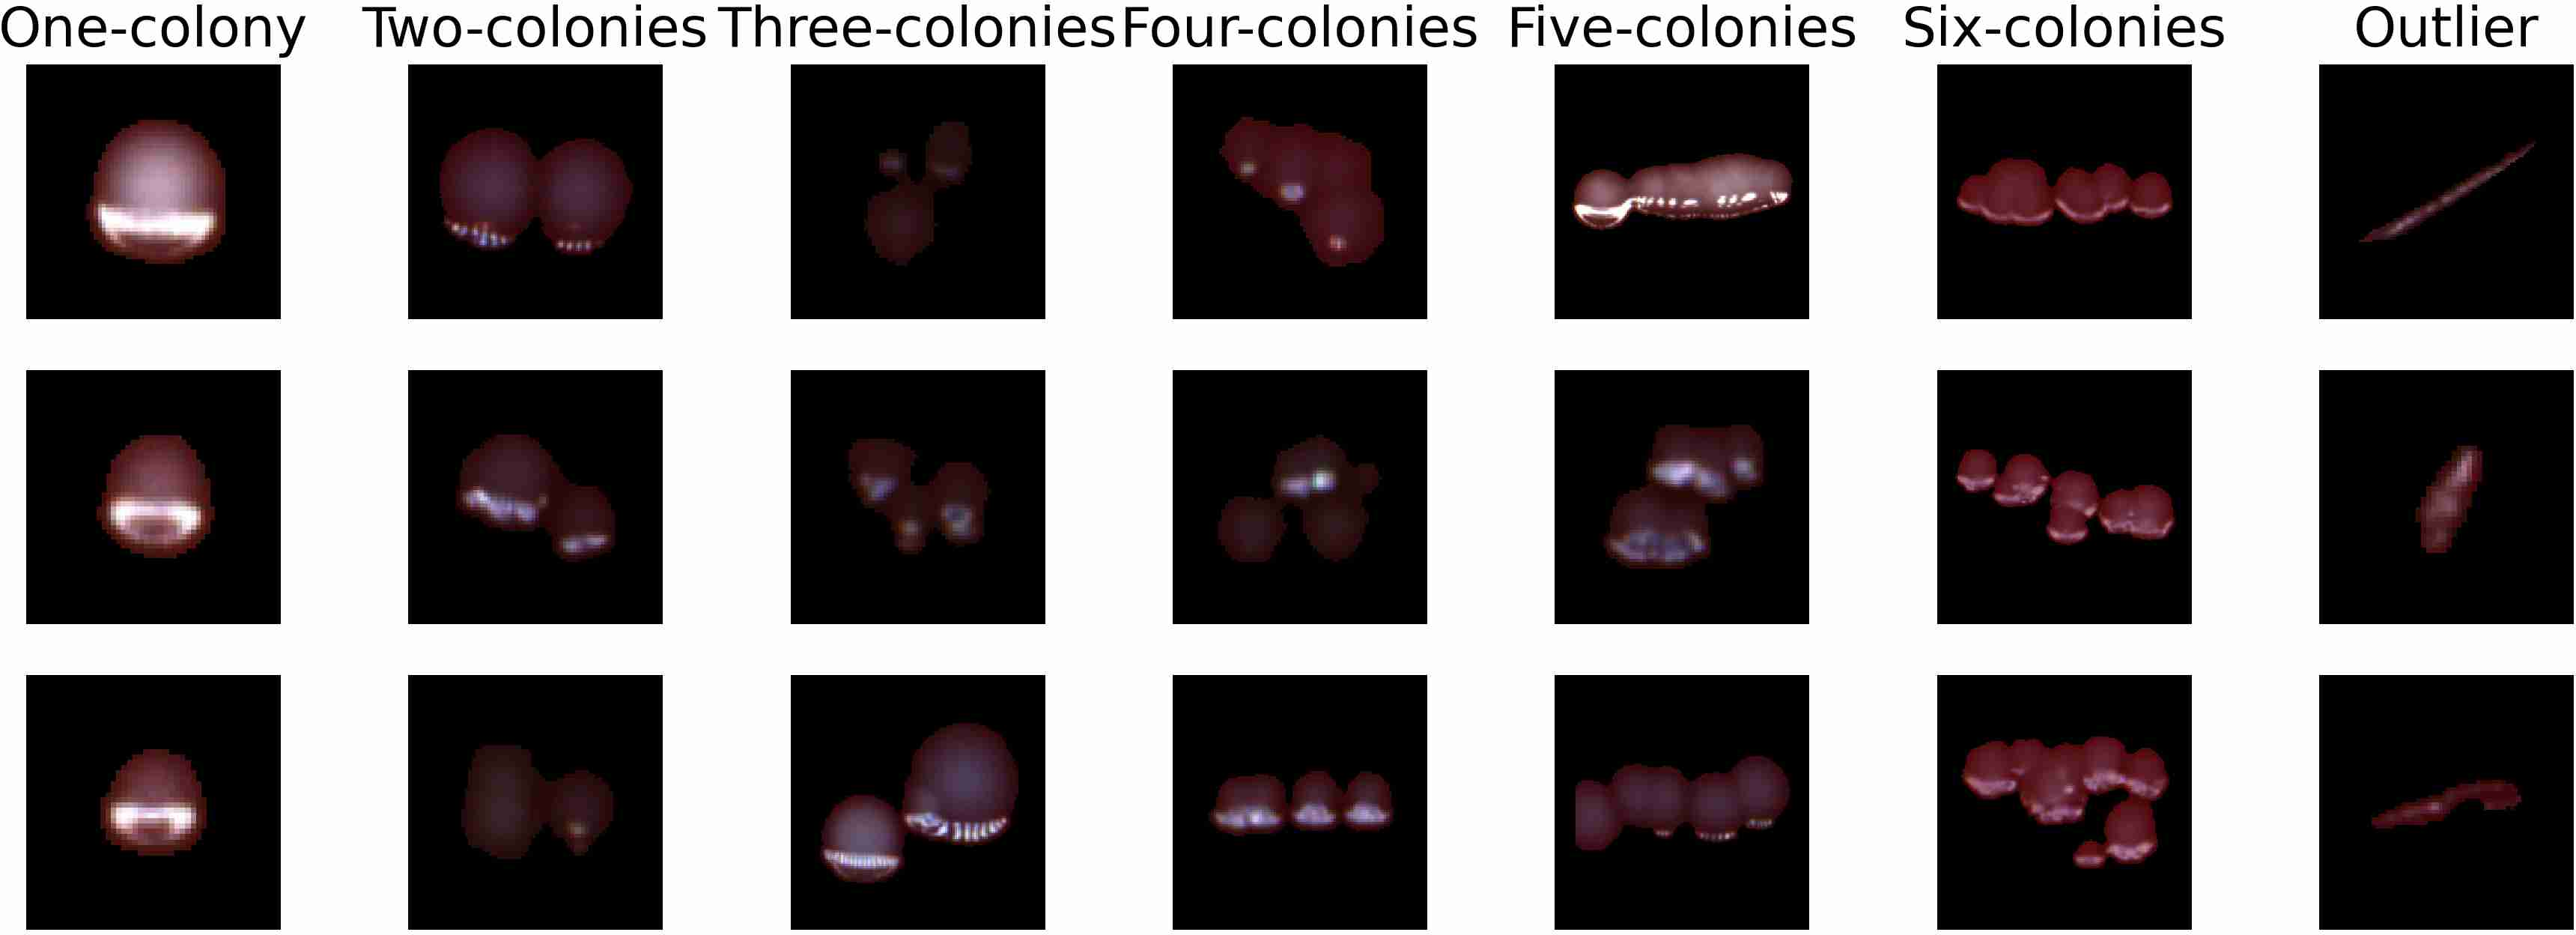
Figure 2: Masked segments after applying pixel-level masks to remove neighboring interference, clarifying the core colony group.
MicrobiaNet achieves stable performance: average training F1 of 0.85 and validation F1 of 0.82 across five stratified data splits, with minimal variance. The most pronounced source of error is confusion between adjacent classes (e.g., three versus four colonies), rather than a general bias toward the majority class.
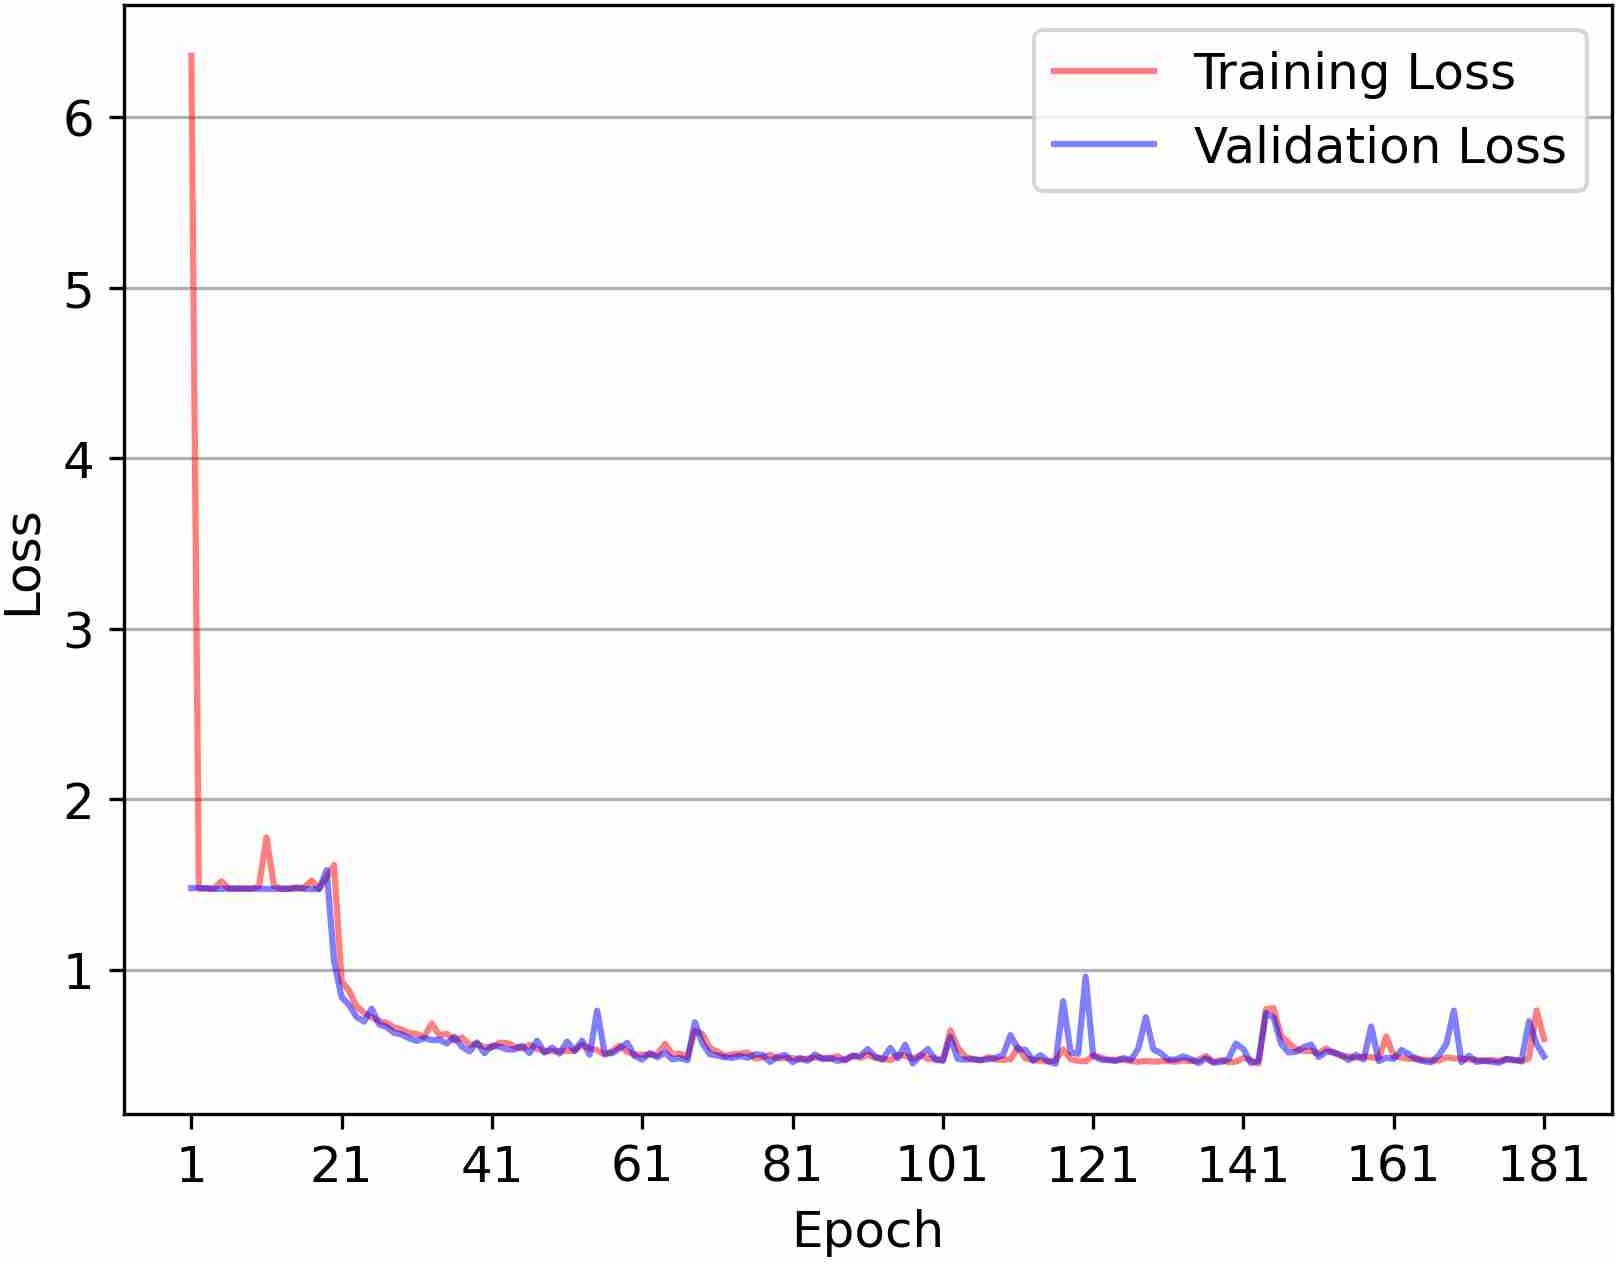
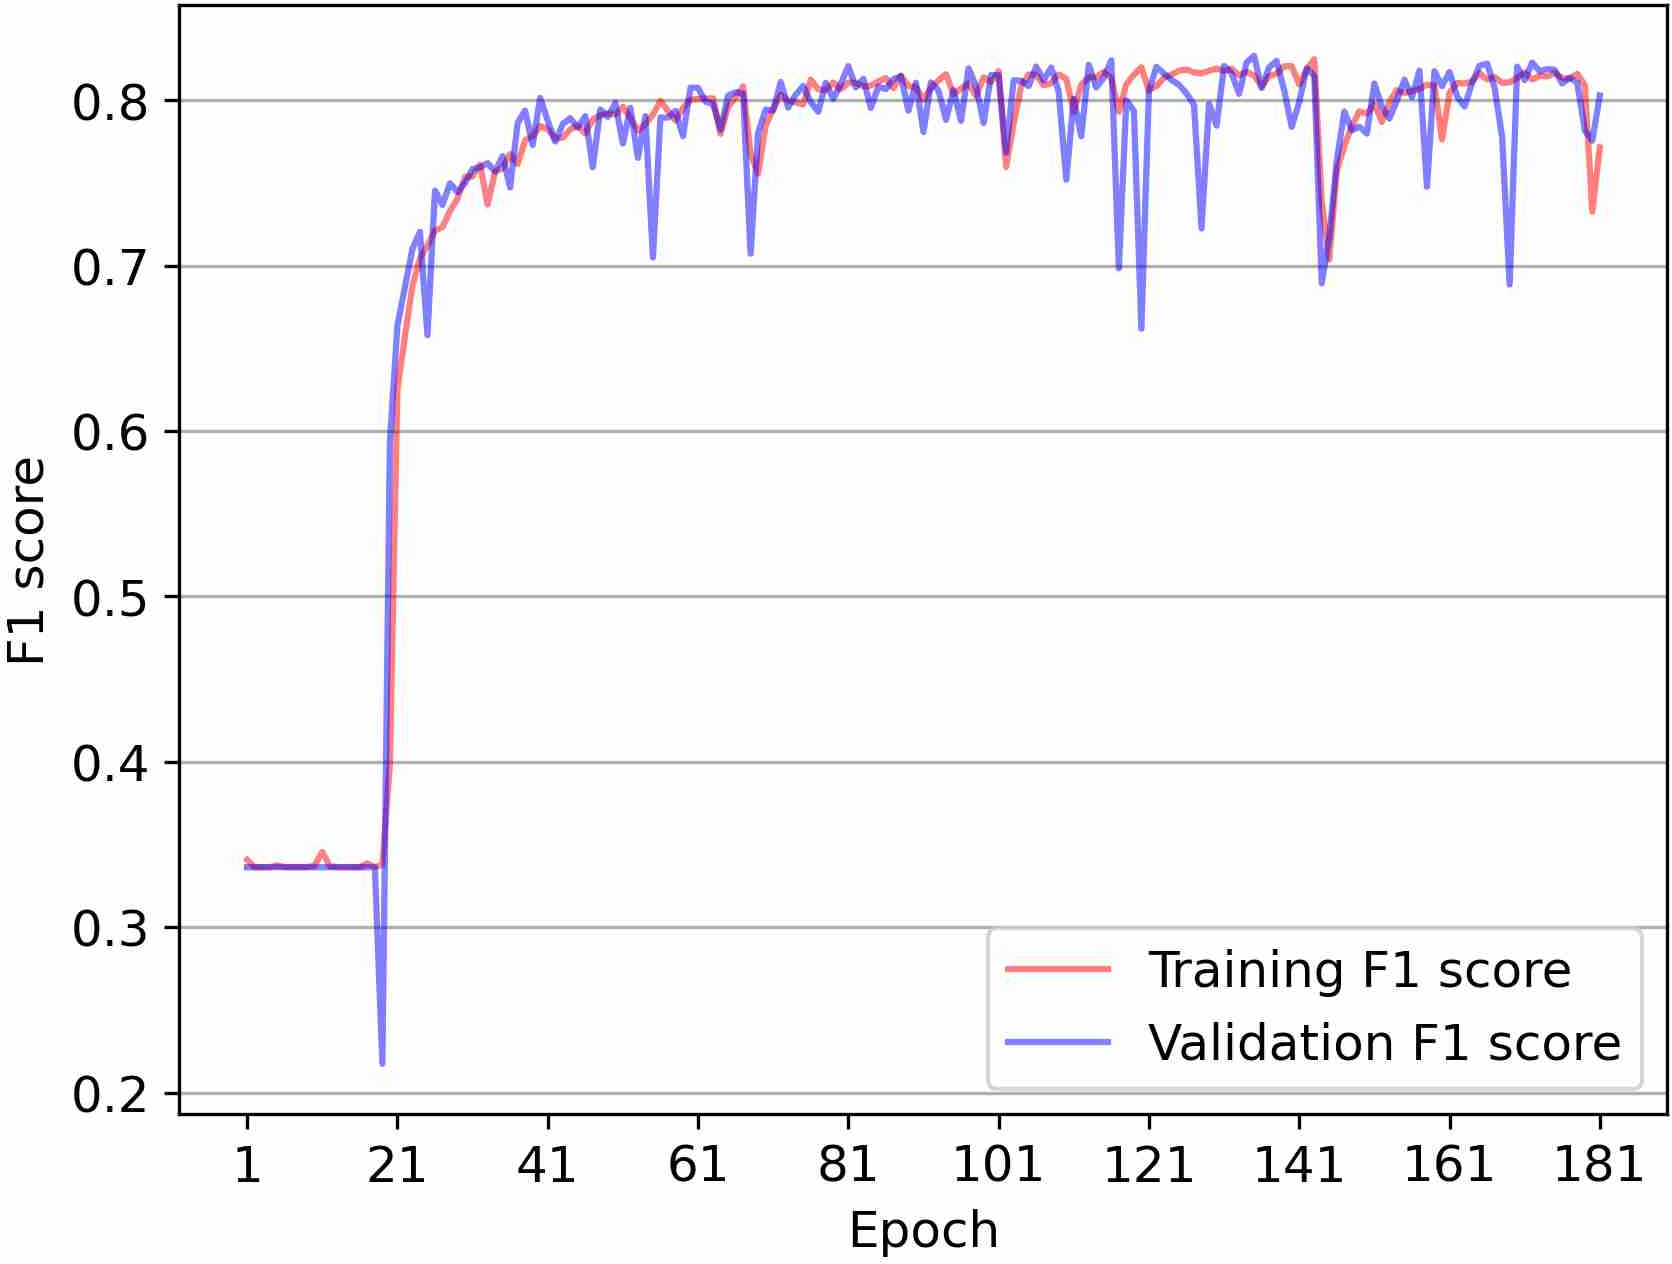
Figure 3: Loss and F1 score progression during training; the model exhibits no evidence of overfitting, as train/val gaps remain minimal.
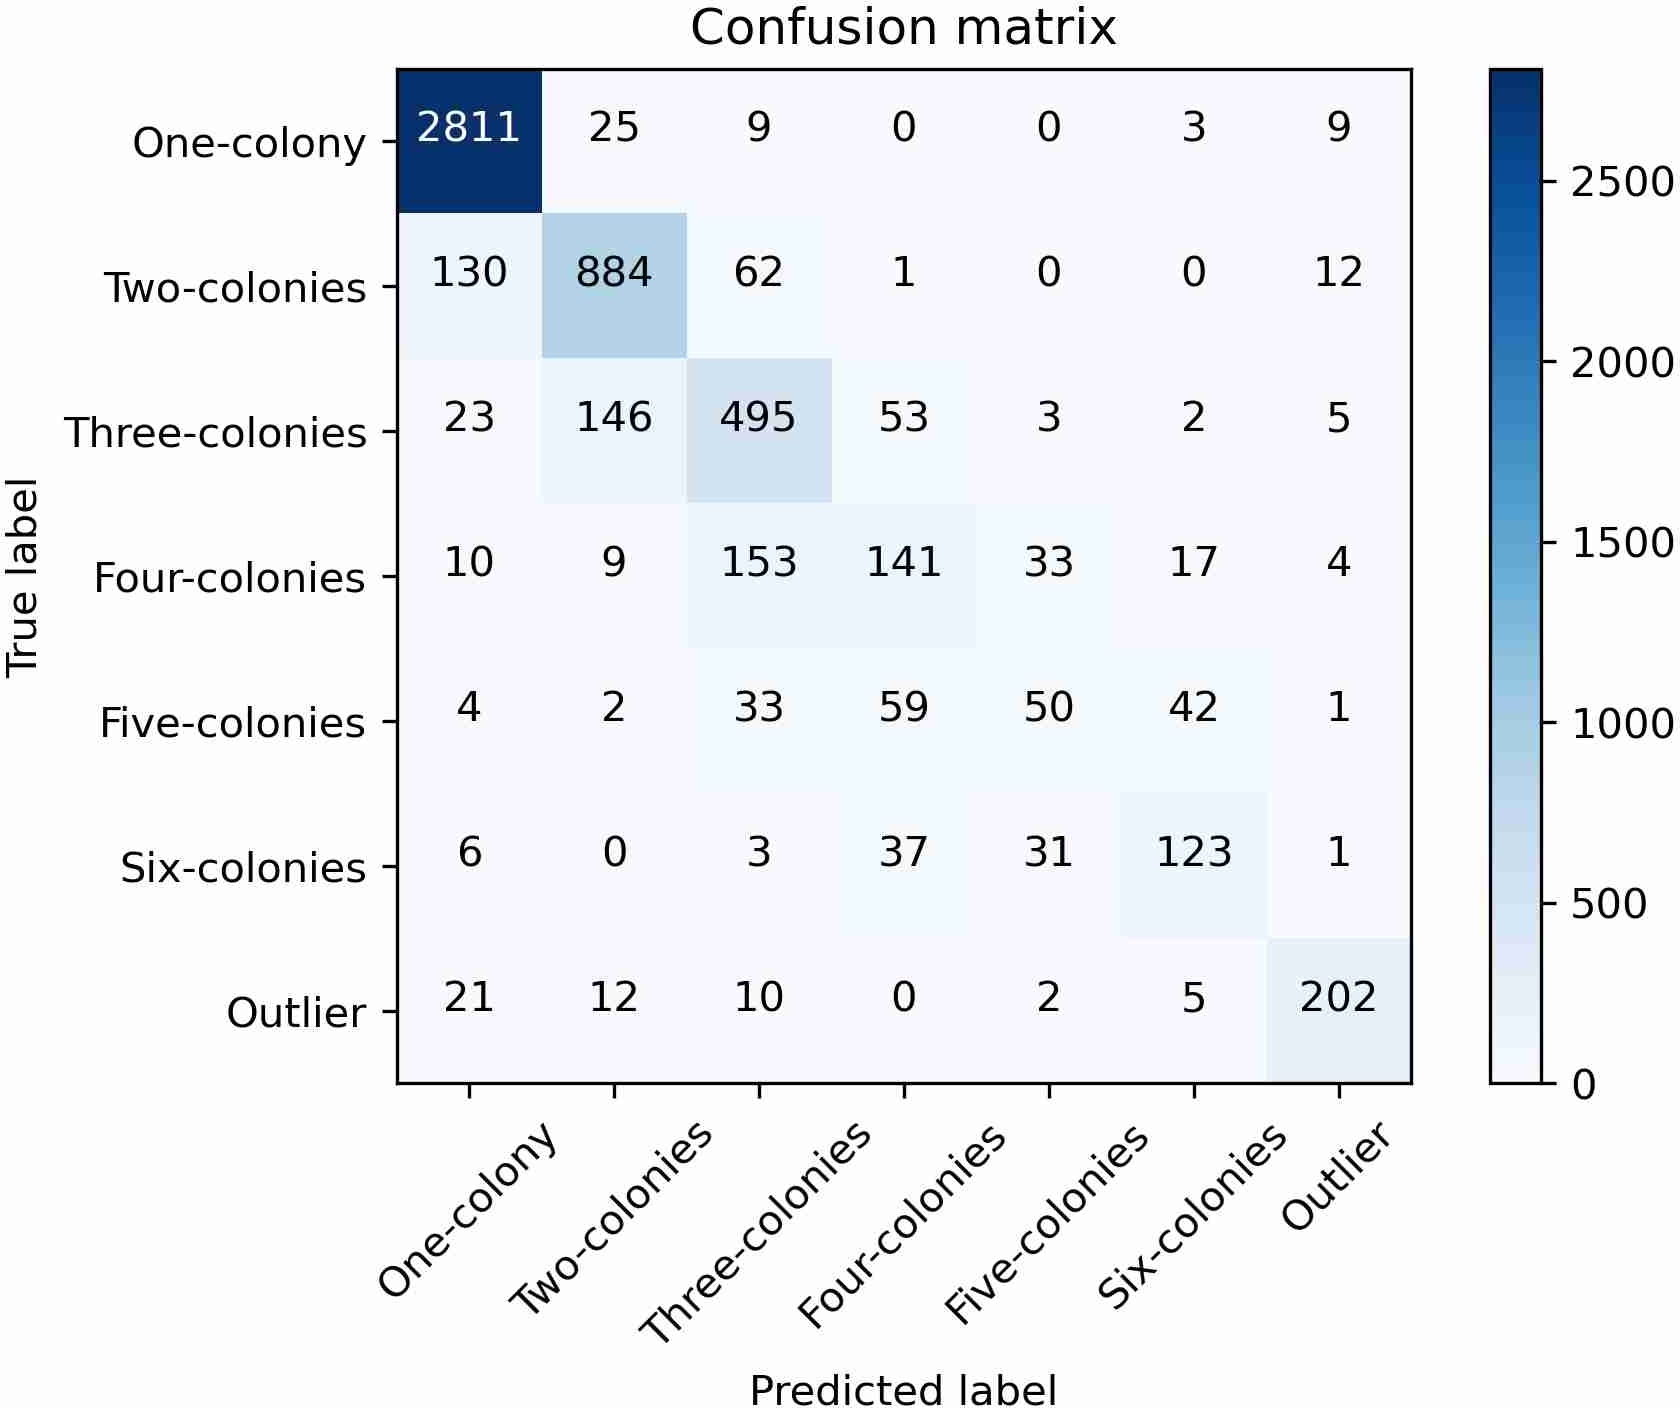
Figure 4: Confusion matrix for validation predictions, revealing that the majority of misclassifications occur between neighboring cardinality classes.
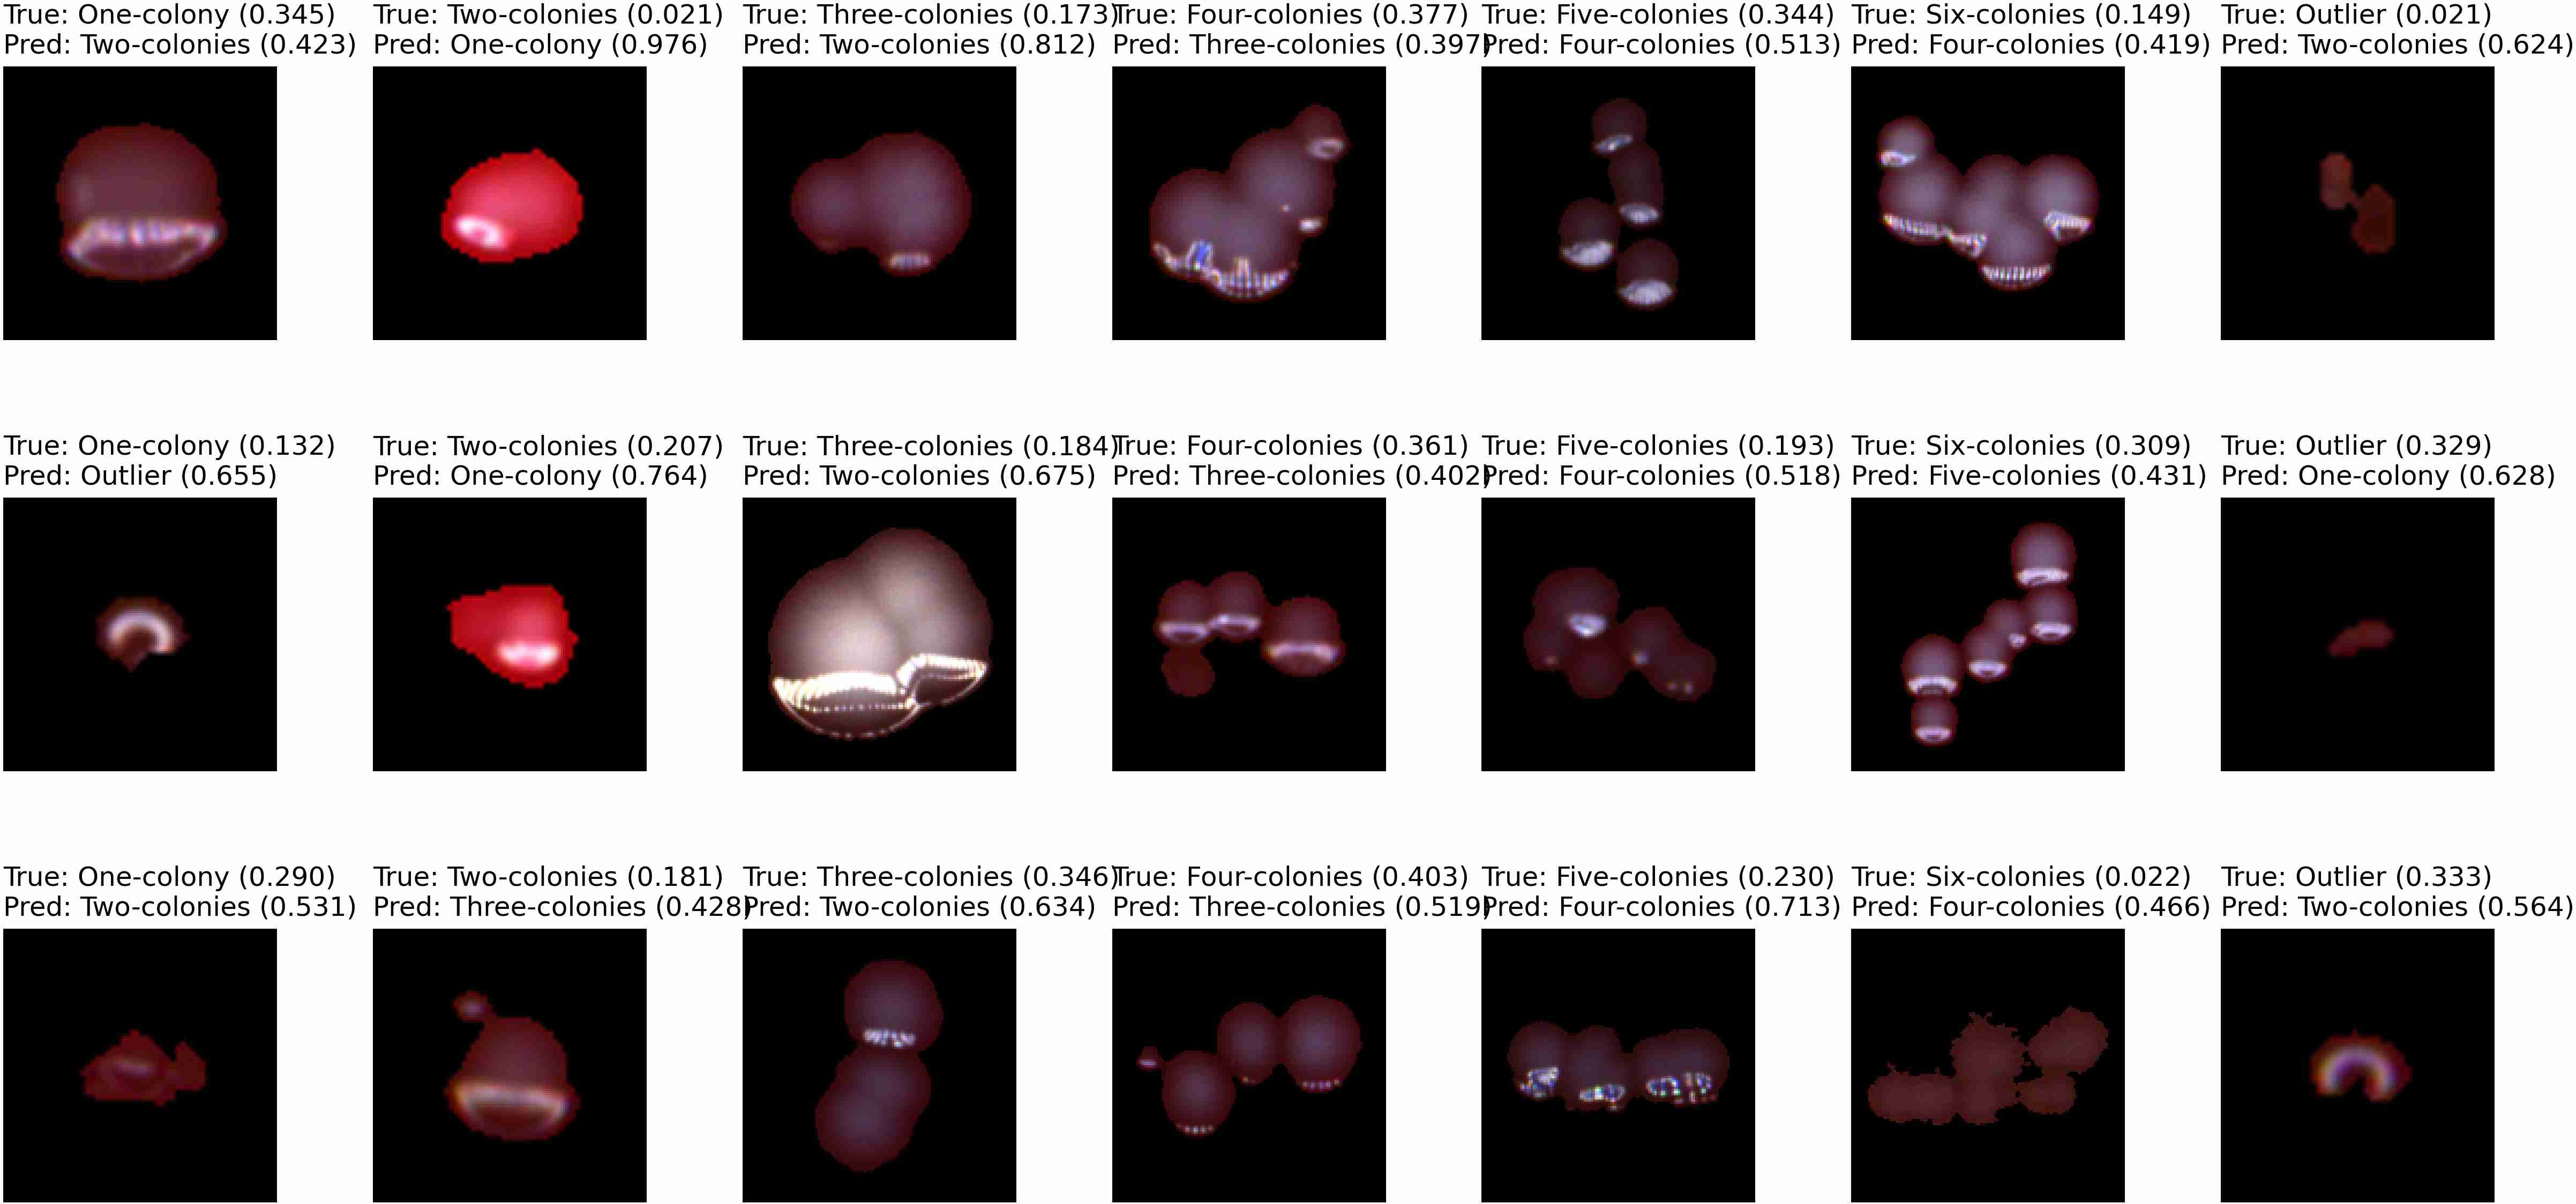
Figure 5: Illustrative misclassifications where segments with high visual similarity (e.g., three-colony clusters) are assigned a lower cardinality.
Explainable AI Analysis of MicrobiaNet
Feature Space Visualization
Applying PCA and t-SNE to the final hidden layer representation exposes a stark phenomenon: while outlier, one-colony, and two-colony classes occupy well-separated manifolds, classes with three to six colonies are mapped to a substantially entangled and overlapping subspace. This clustering reflects the lack of discriminative visual cues available to the network.
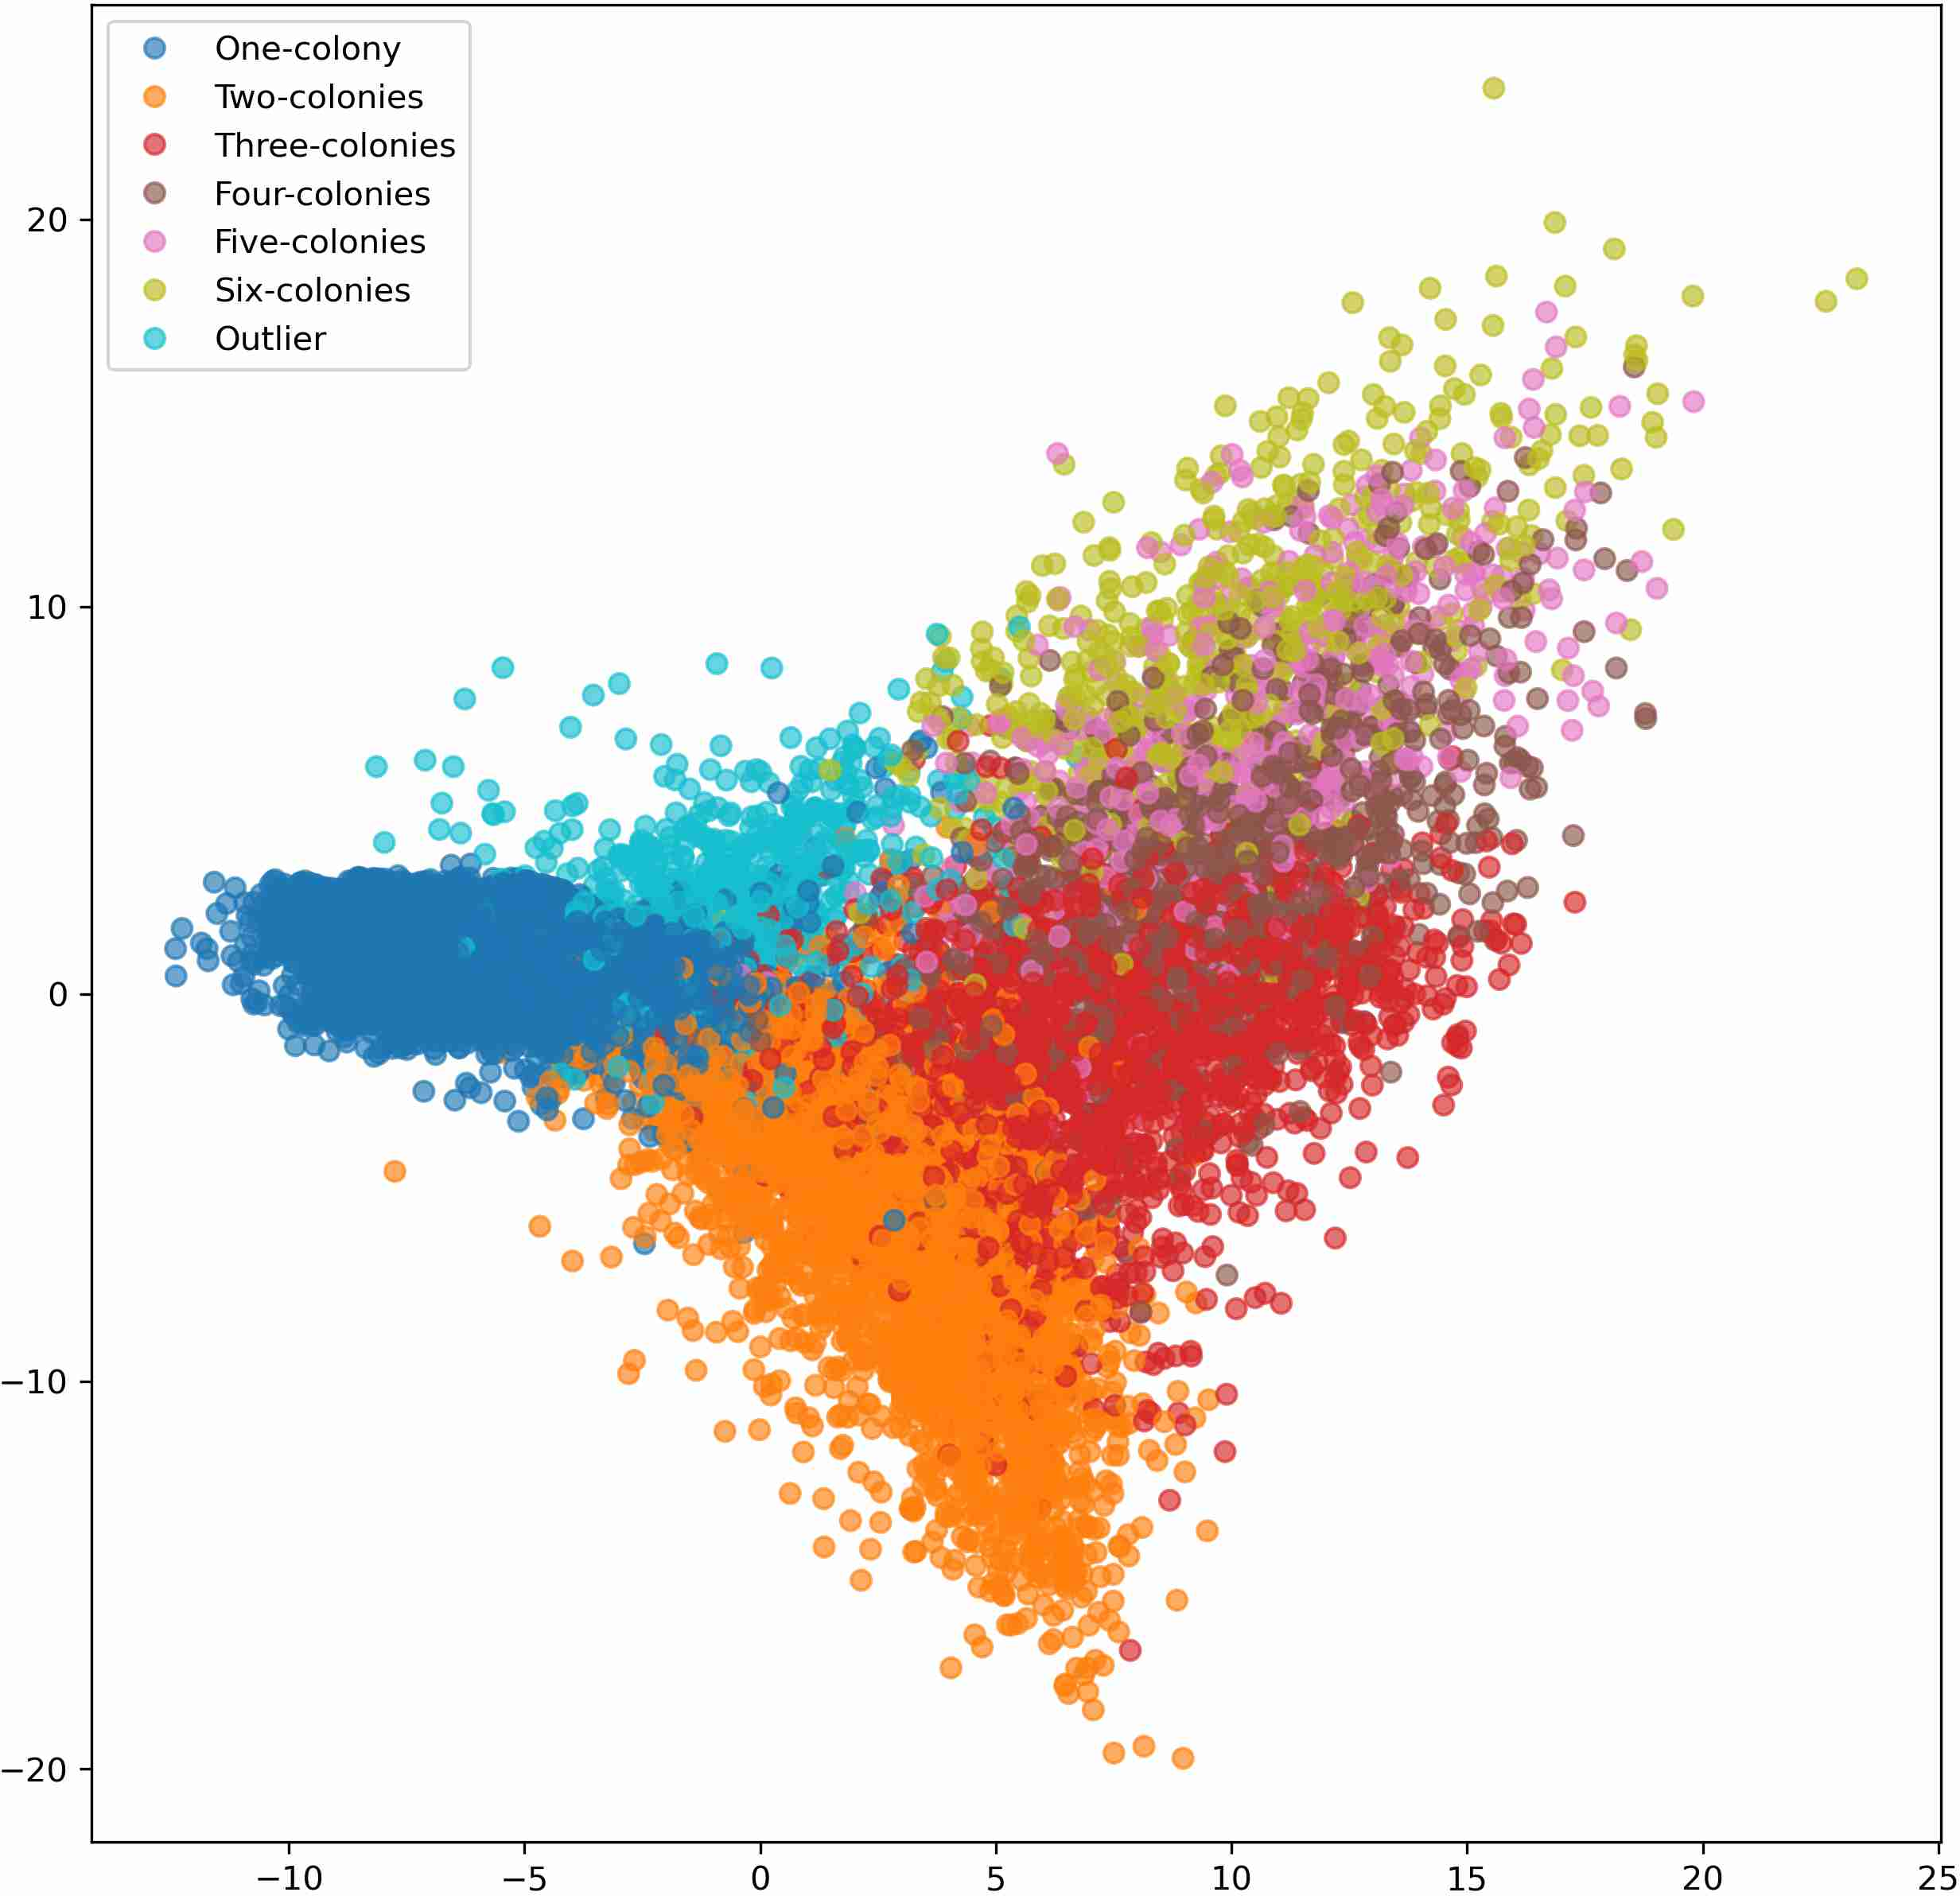
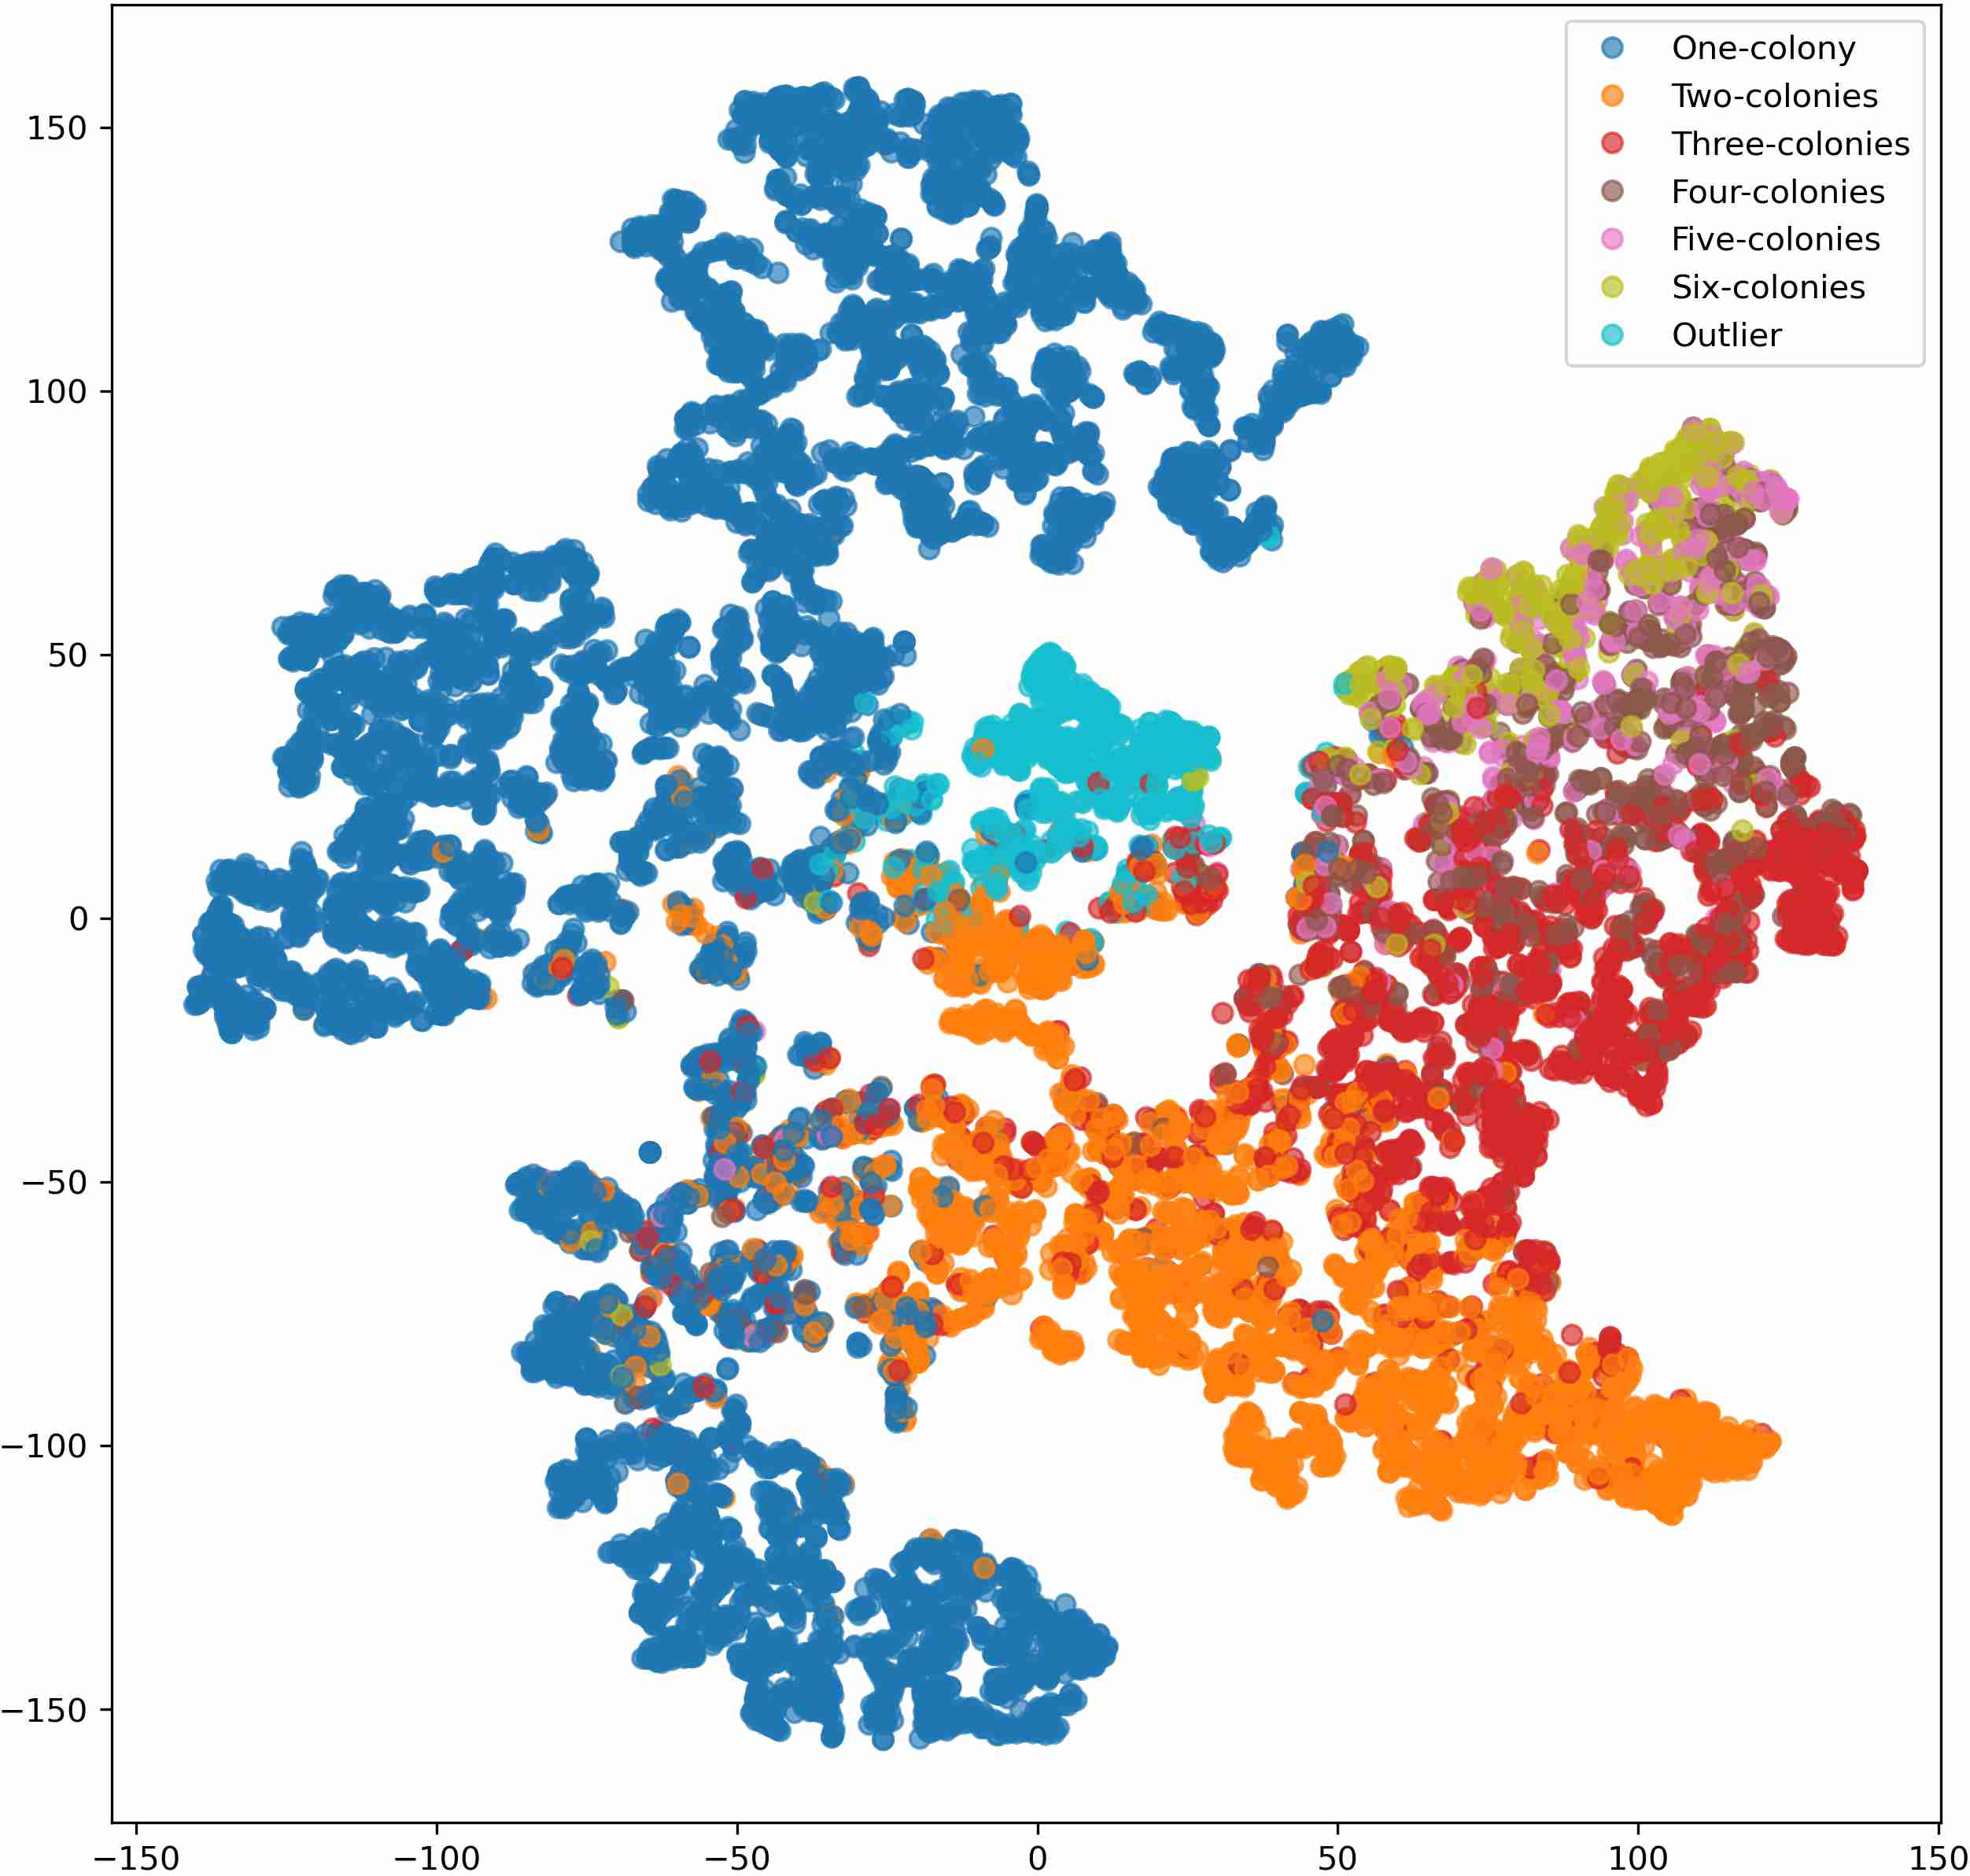
Figure 6: 2D PCA and t-SNE projections of learned representations. The class clusters for three to six colonies are notably indistinct and overlap extensively.
Feature and Activation Map Visualizations
Visualizations of maximally activating feature maps for early and deep convolutional kernels reveal that initial filters predominantly encode simple textures, while deeper kernels occasionally localize to blob-like features corresponding to colonies. However, such visualization rarely produces interpretable colony-type templates, consistent with limited feature contrast in these complex biological images.
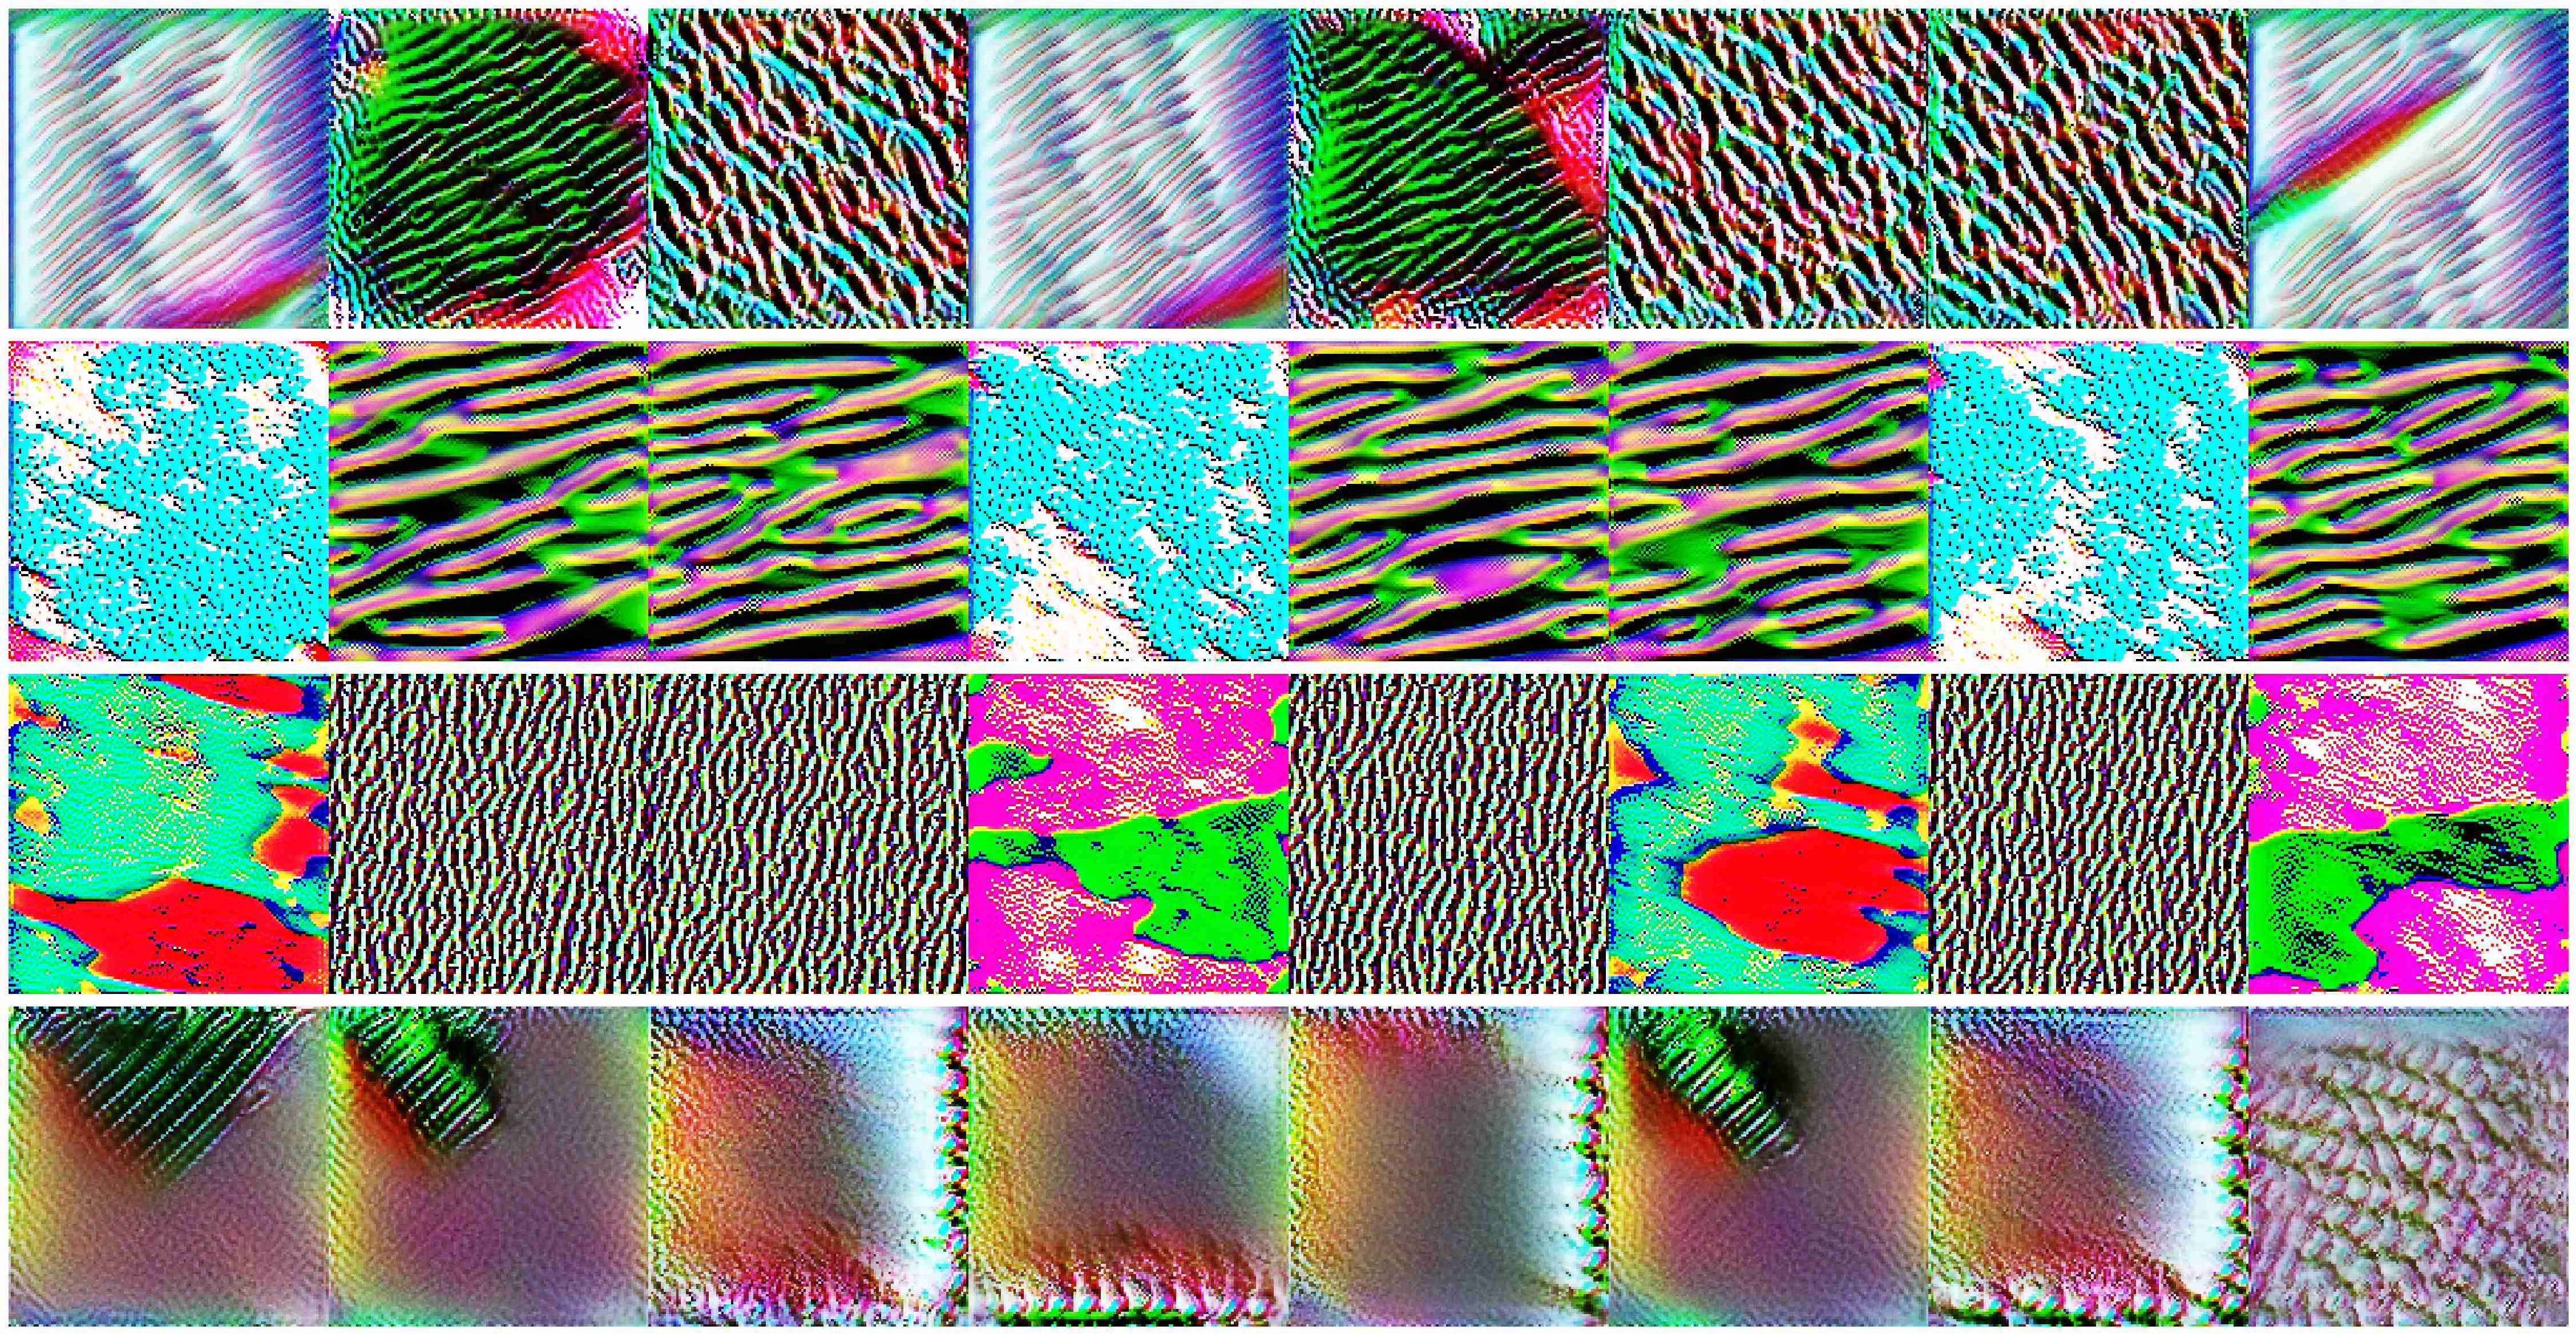
Figure 7: Synthesized feature maps maximizing kernel activations; only late-layer kernels show weak selectivity for colony-like blobs.
Class activation maps (CAM, Grad-CAM, Eigen-CAM, etc.) localize the decisive regions in the input, but the maps are diffuse except for Eigen-CAM, which aligns more accurately with target colonies. Nonetheless, a direct correspondence between spatial focus and class assignment remains elusive.
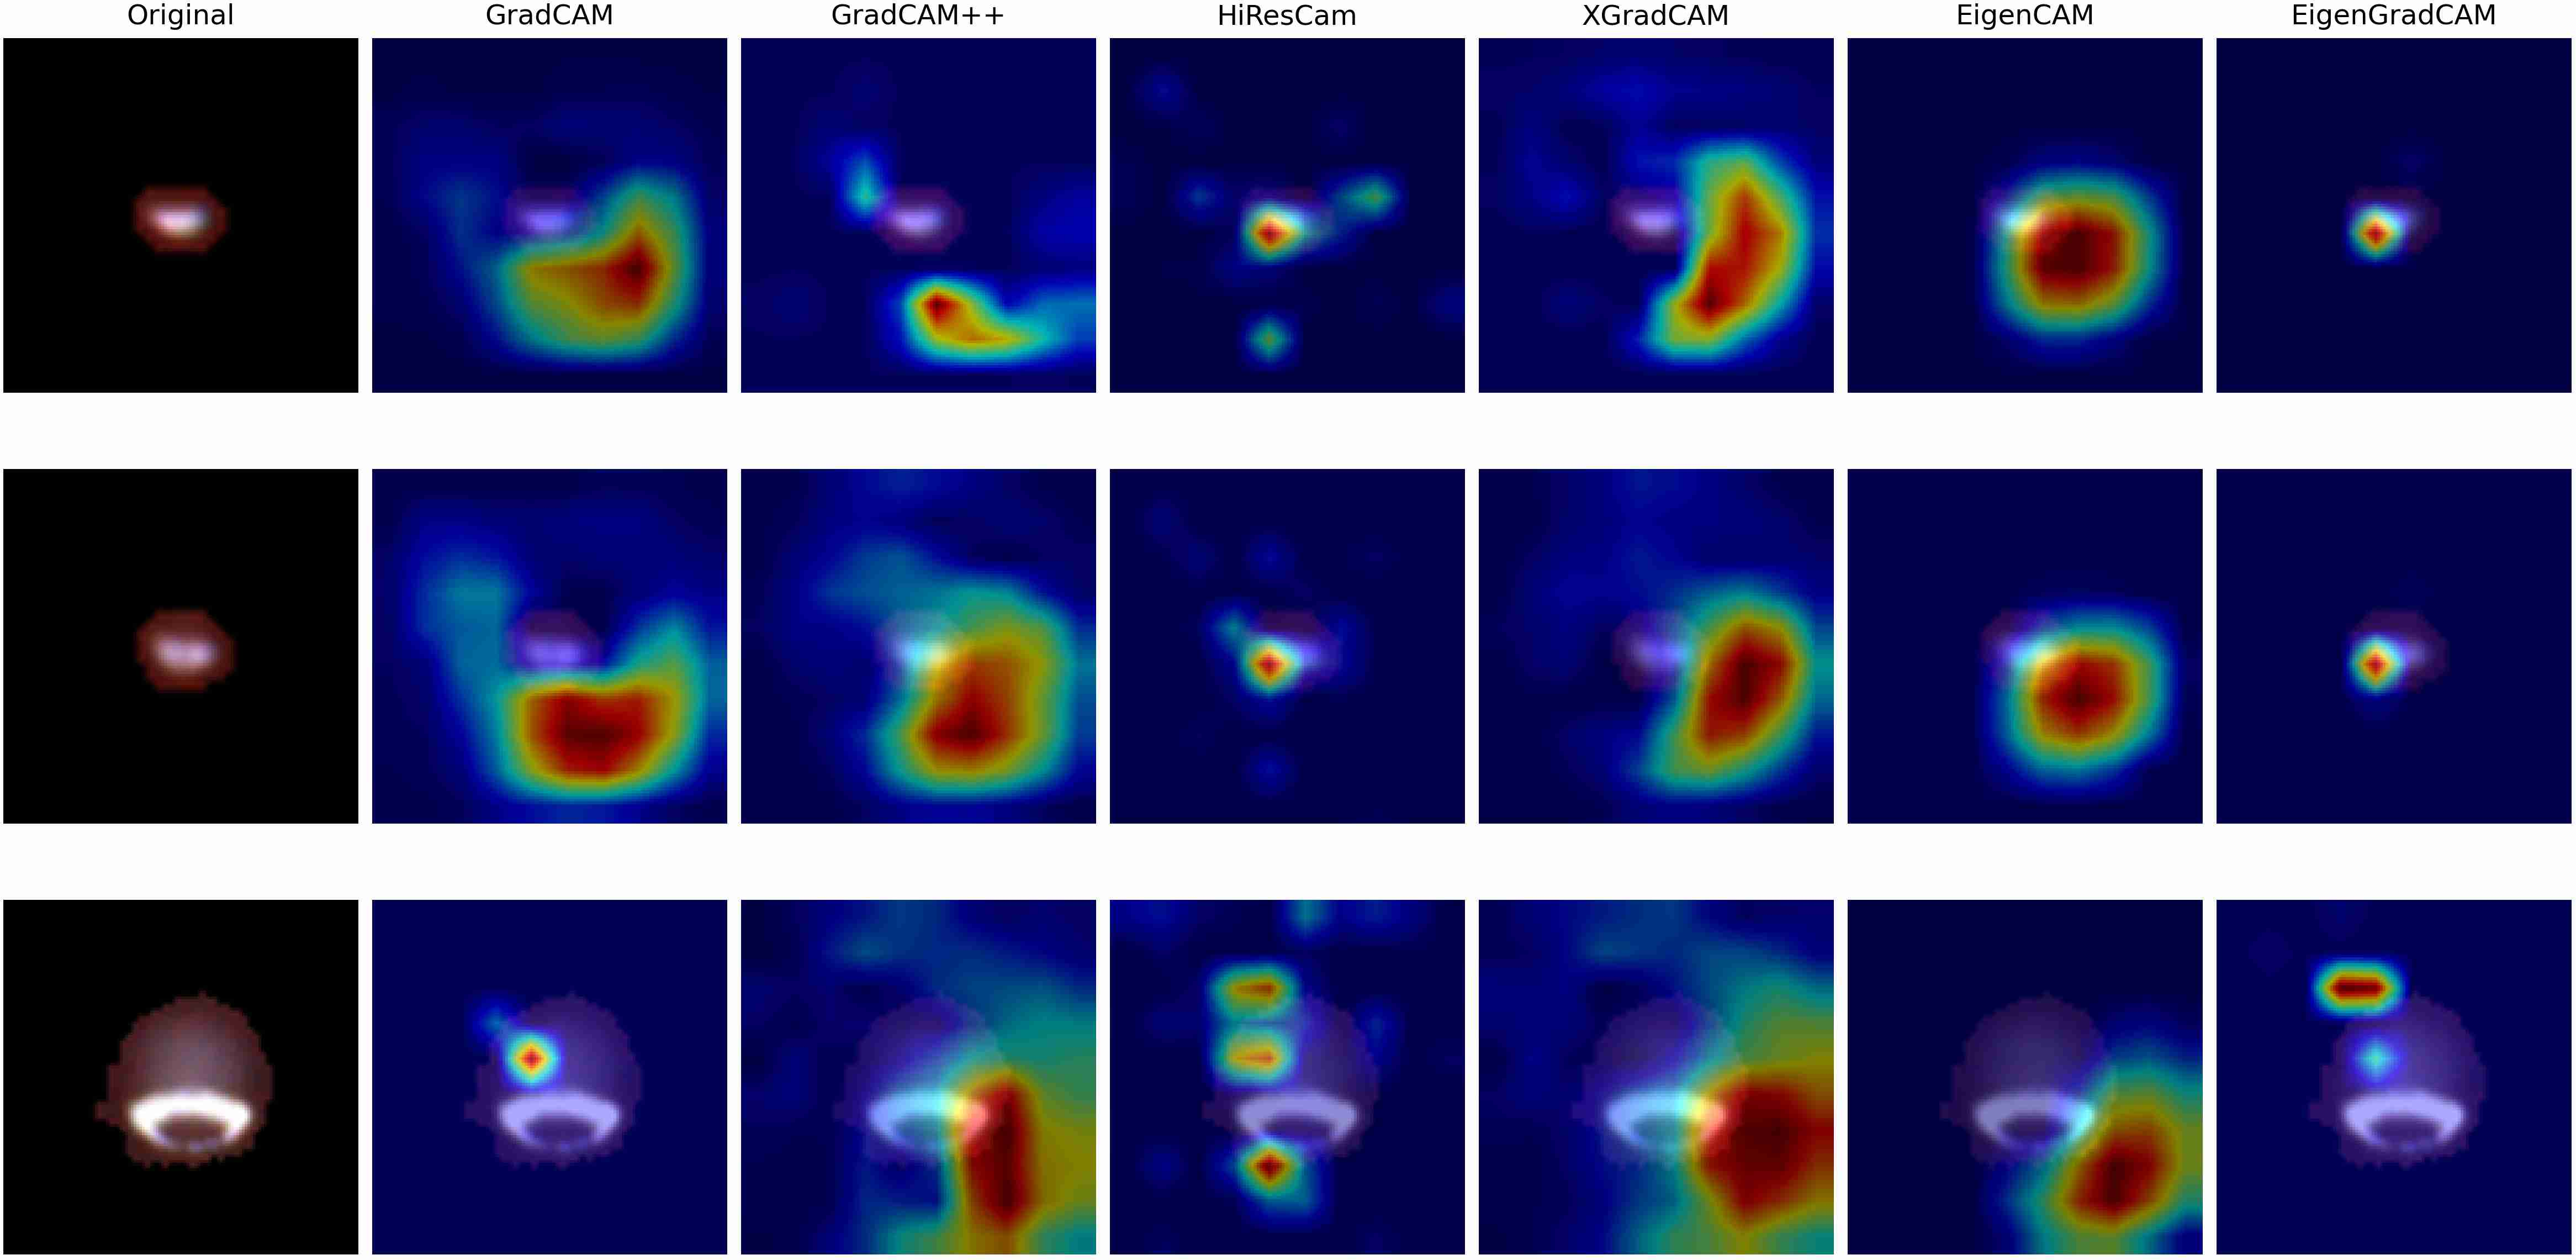
Figure 8: Class activation map for the one-colony class, demonstrating comparatively accurate region localization using Eigen-CAM.
Impact of Class Imbalance
To disambiguate the influence of label imbalance, the study trains MicrobiaNet on a downsampled, balanced dataset (equal representation for all classes). Validation F1 deteriorates by only 0.06, even as training F1 ranges more widely. The principal limitation—high confusion among three to six colony classes—persists, substantiating that class imbalance is not the primary determinant of poor discriminative performance in these cases.
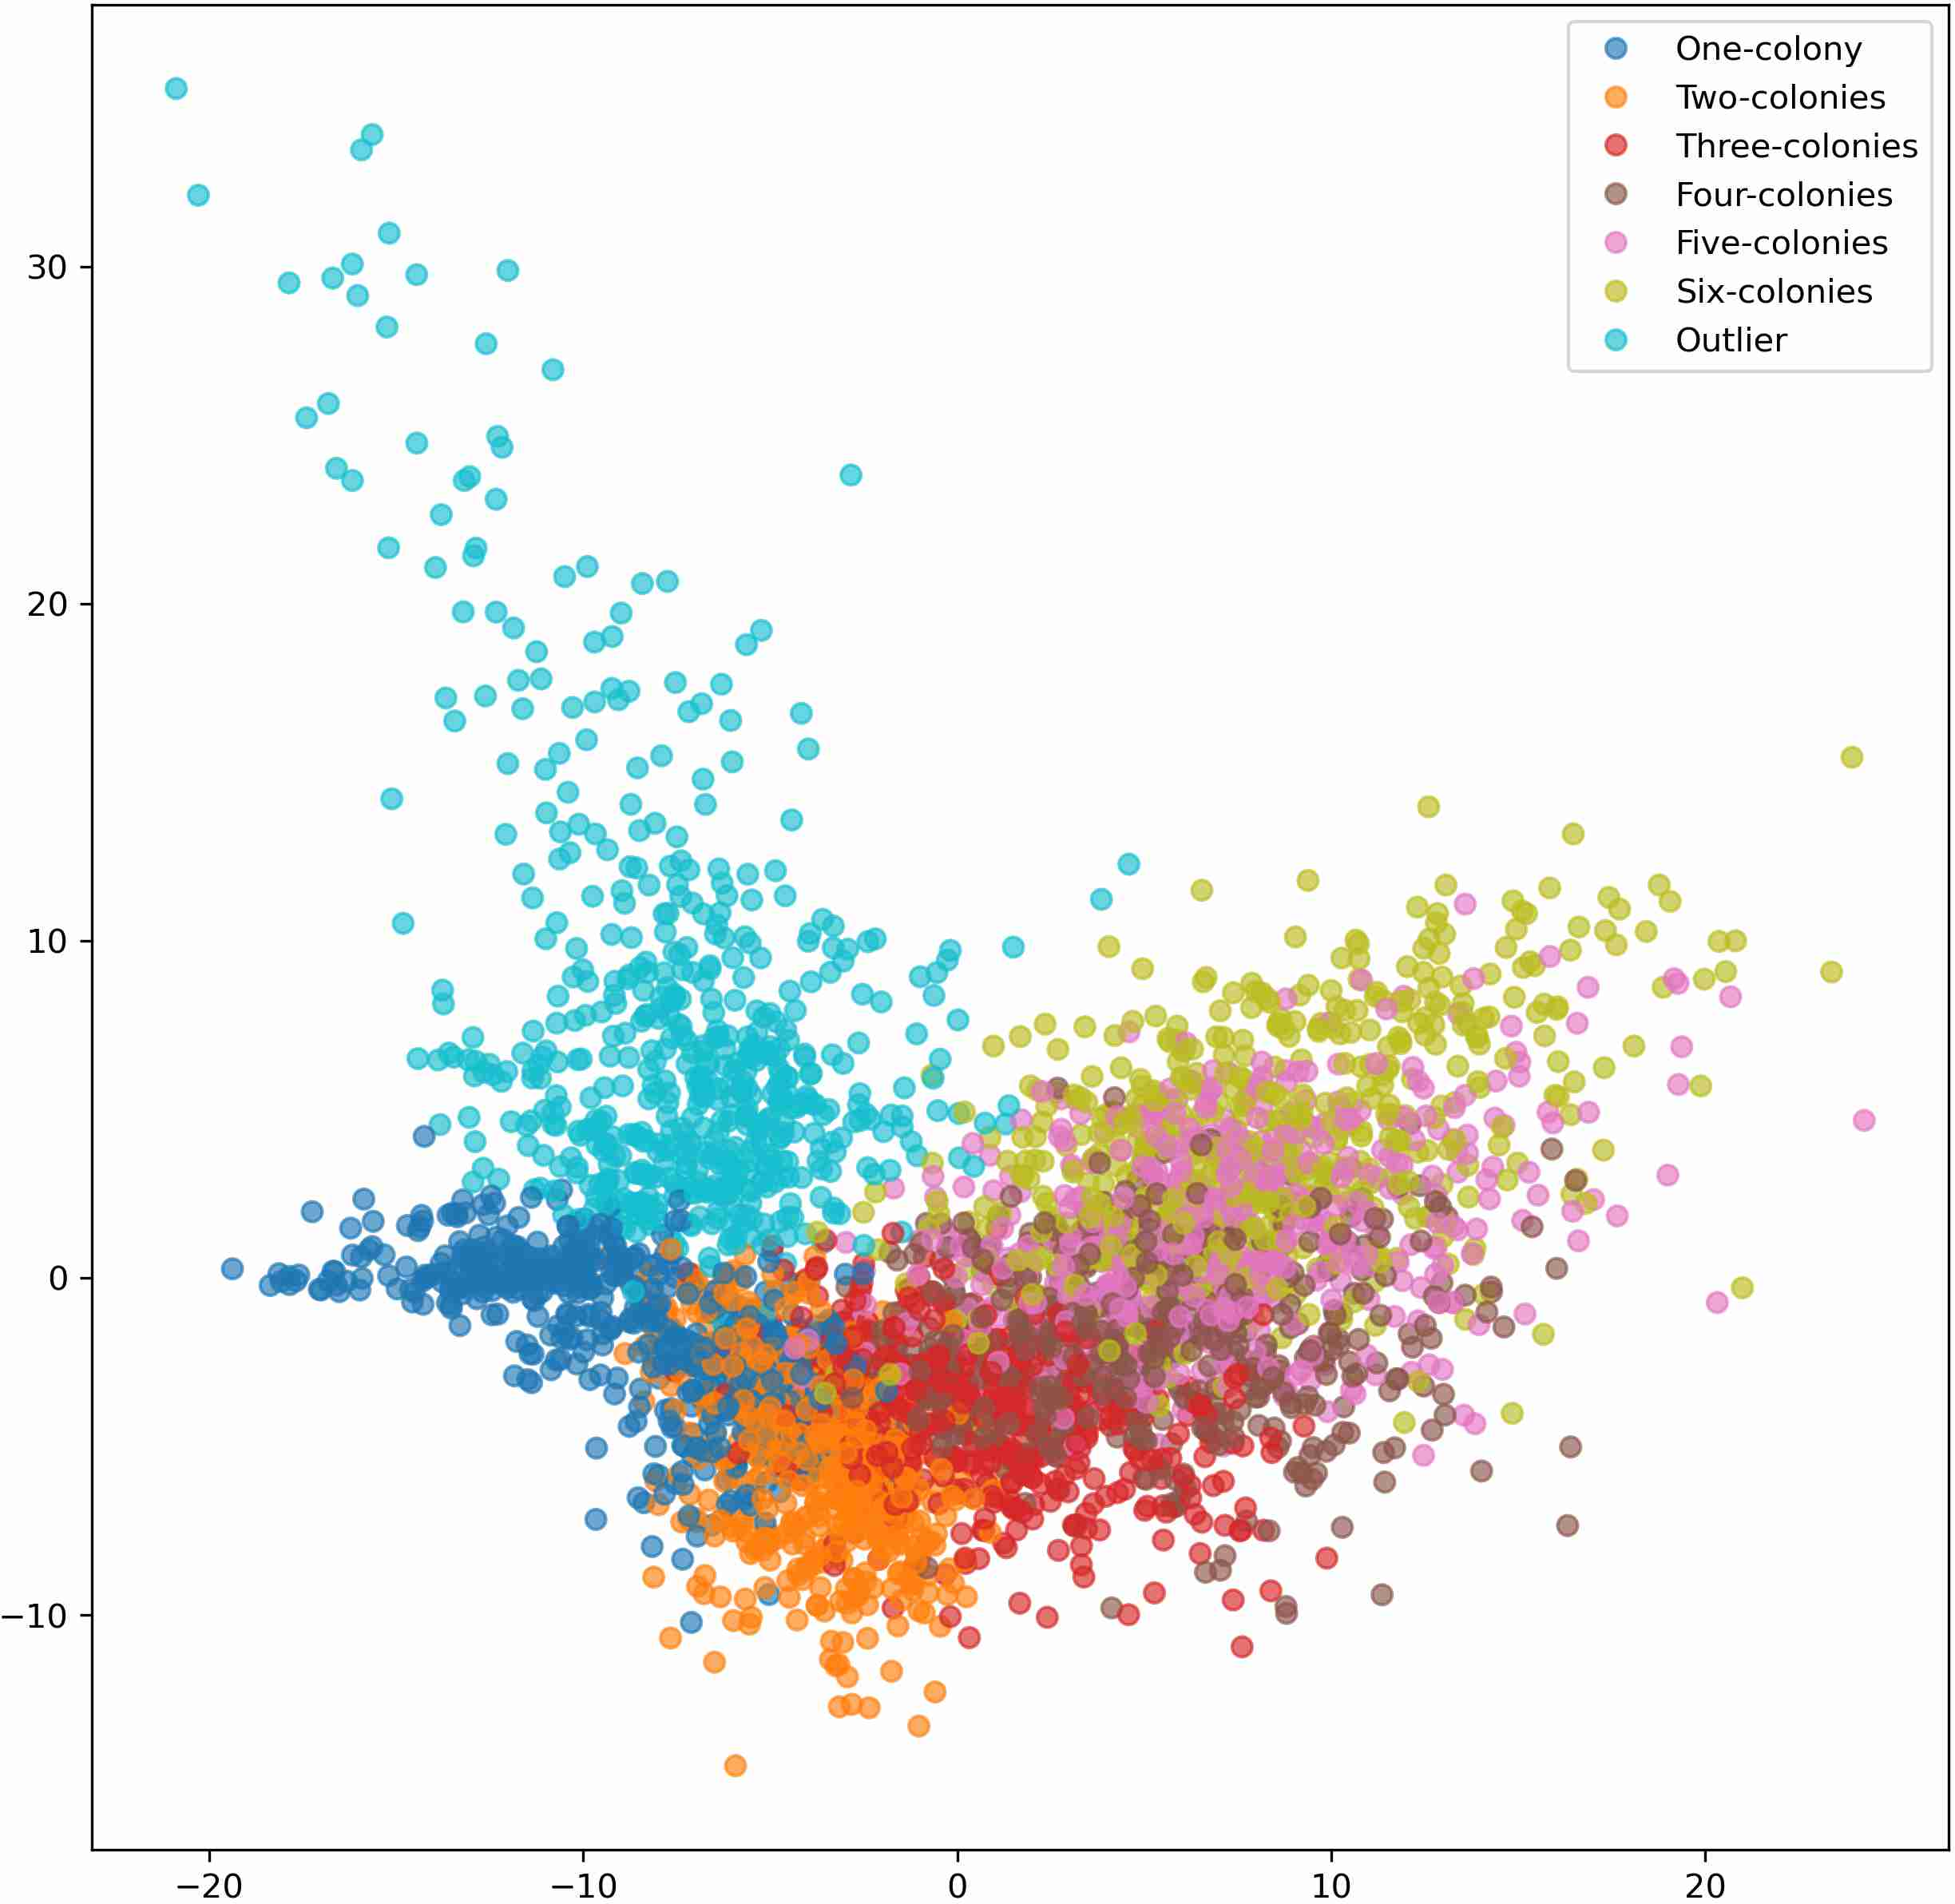
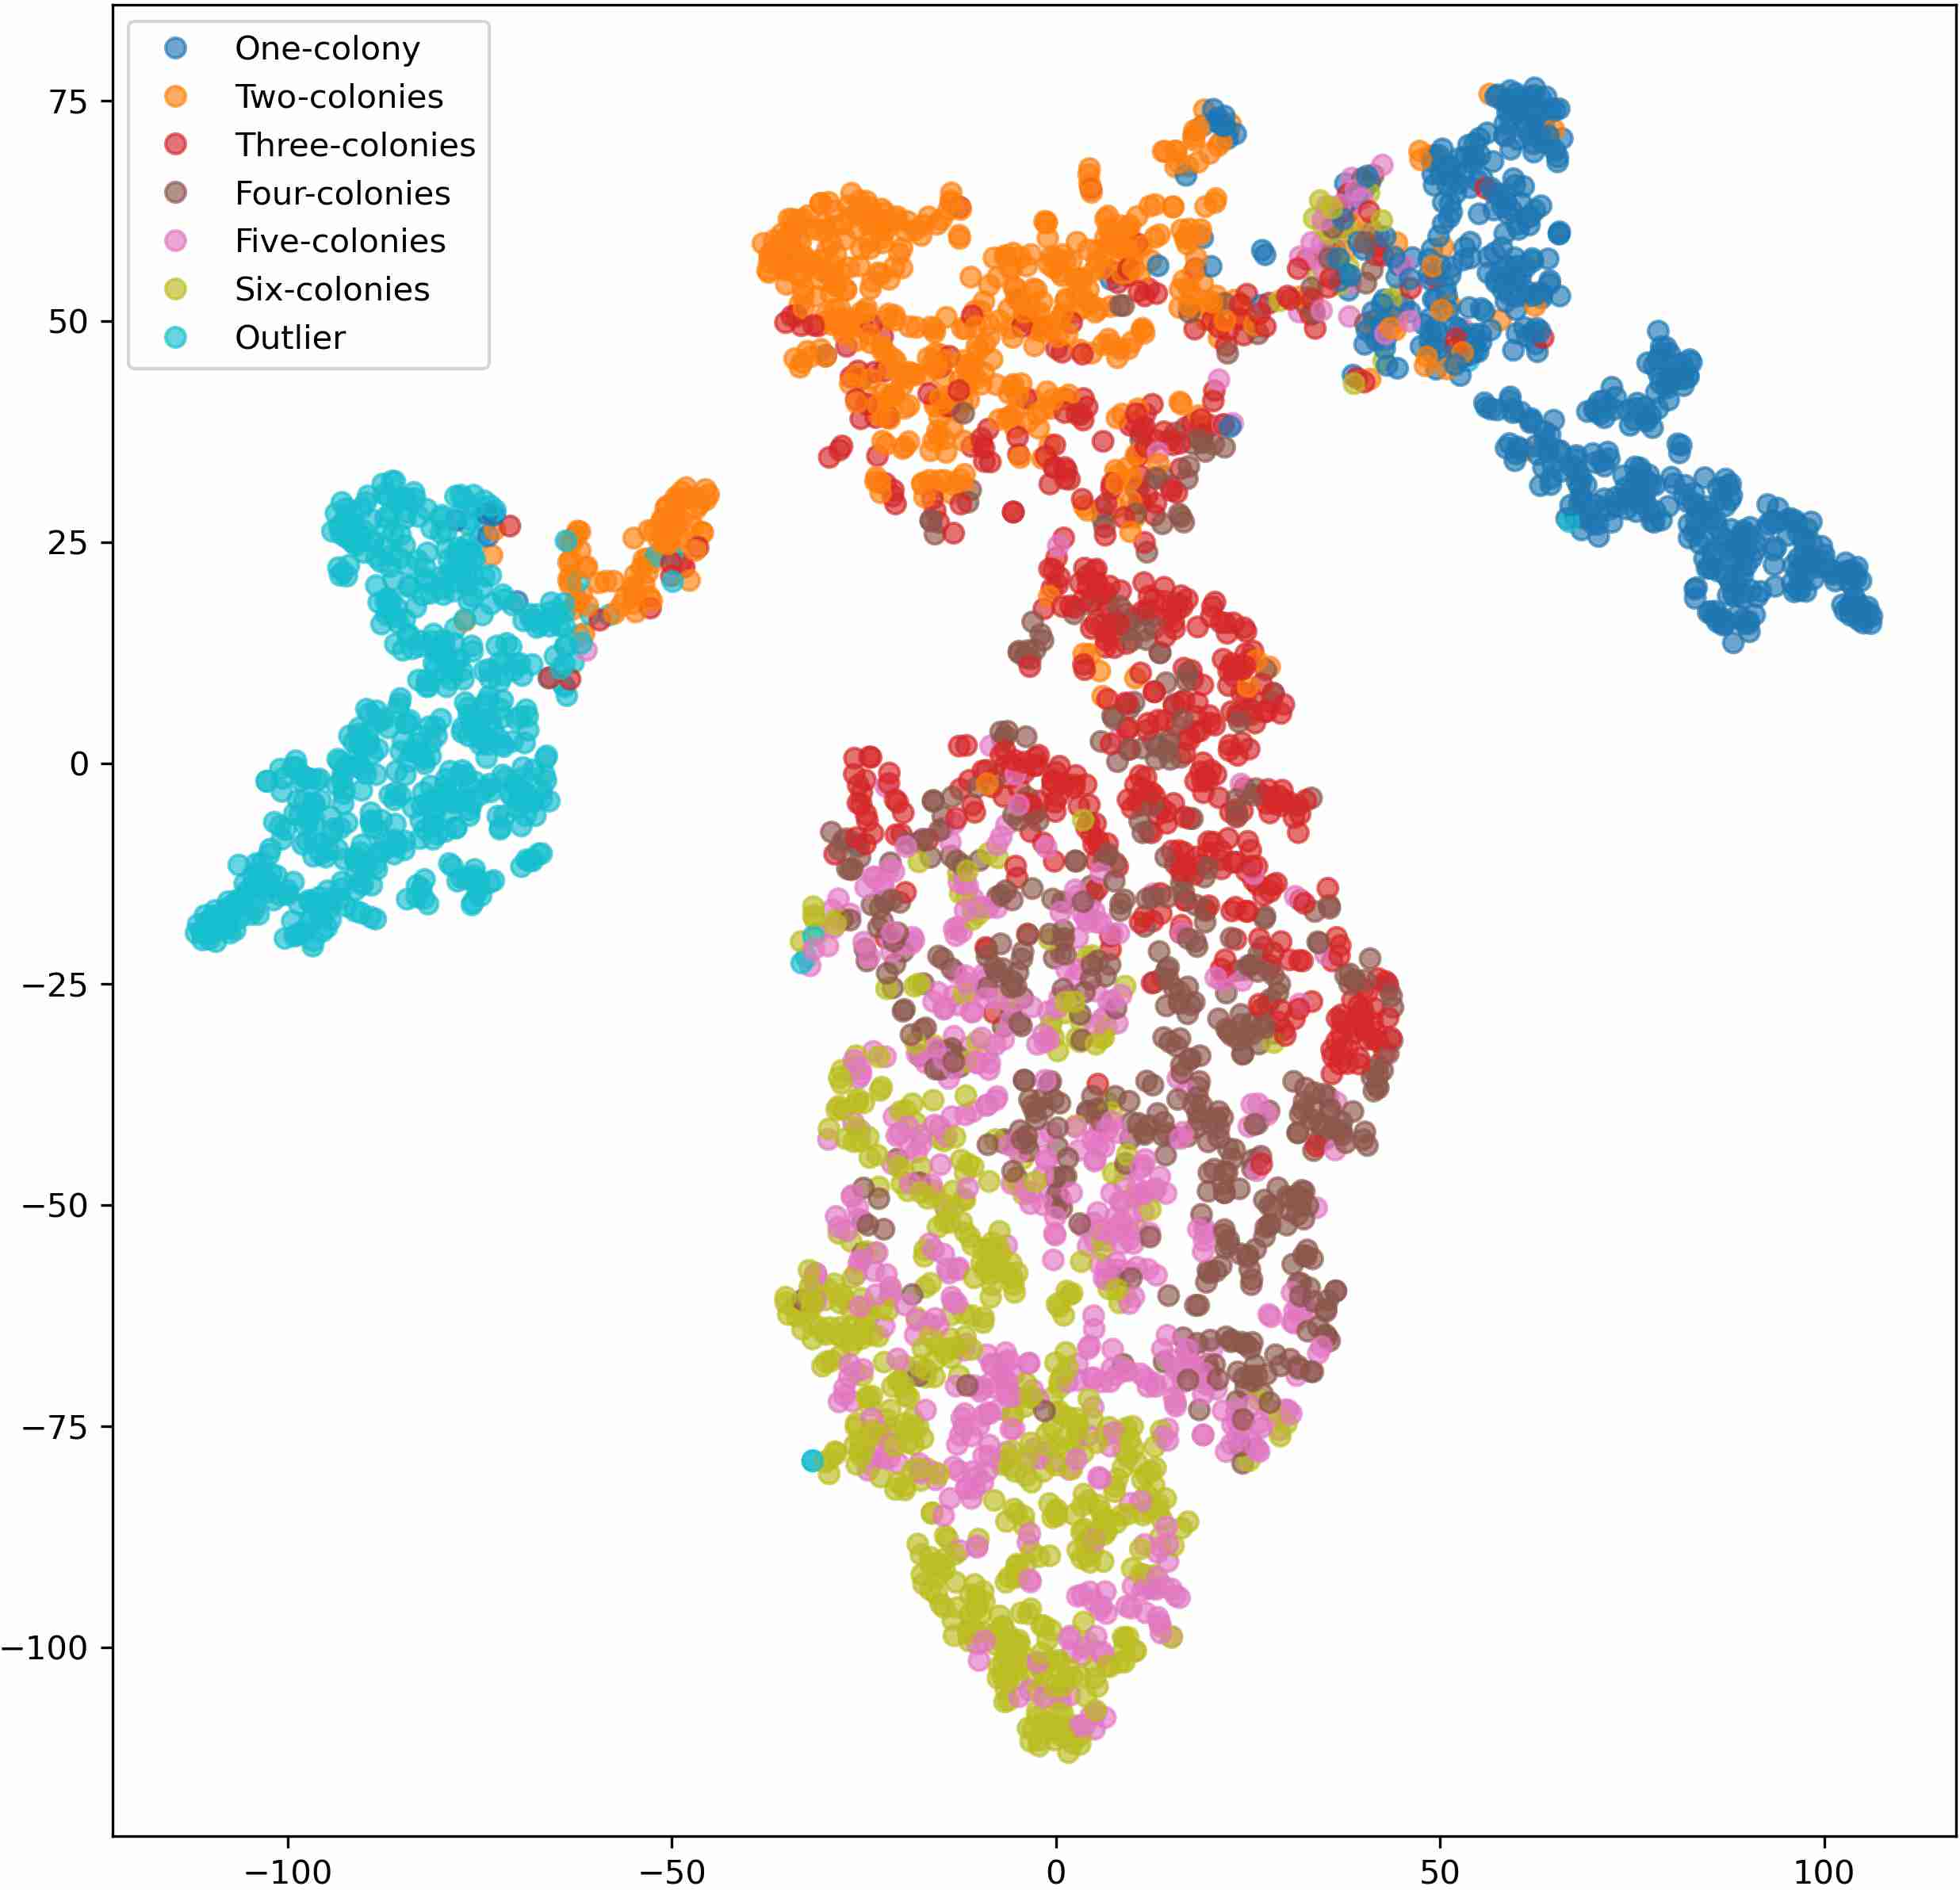
Figure 9: Network output feature projections for the balanced training set: the underlying class entanglement for high-cardinality segments is largely invariant to balancing.
Mitigation by Class Concatenation
Collapsing the four most visually ambiguous classes into a single "More-colonies" category (reducing the task to four classes) increases validation F1 to 0.92. The transformation results in cleaner, more segregated feature clusters, evidencing that the original performance ceiling is imposed by intrinsic visual ambiguity, not by architecture or class frequency biases.
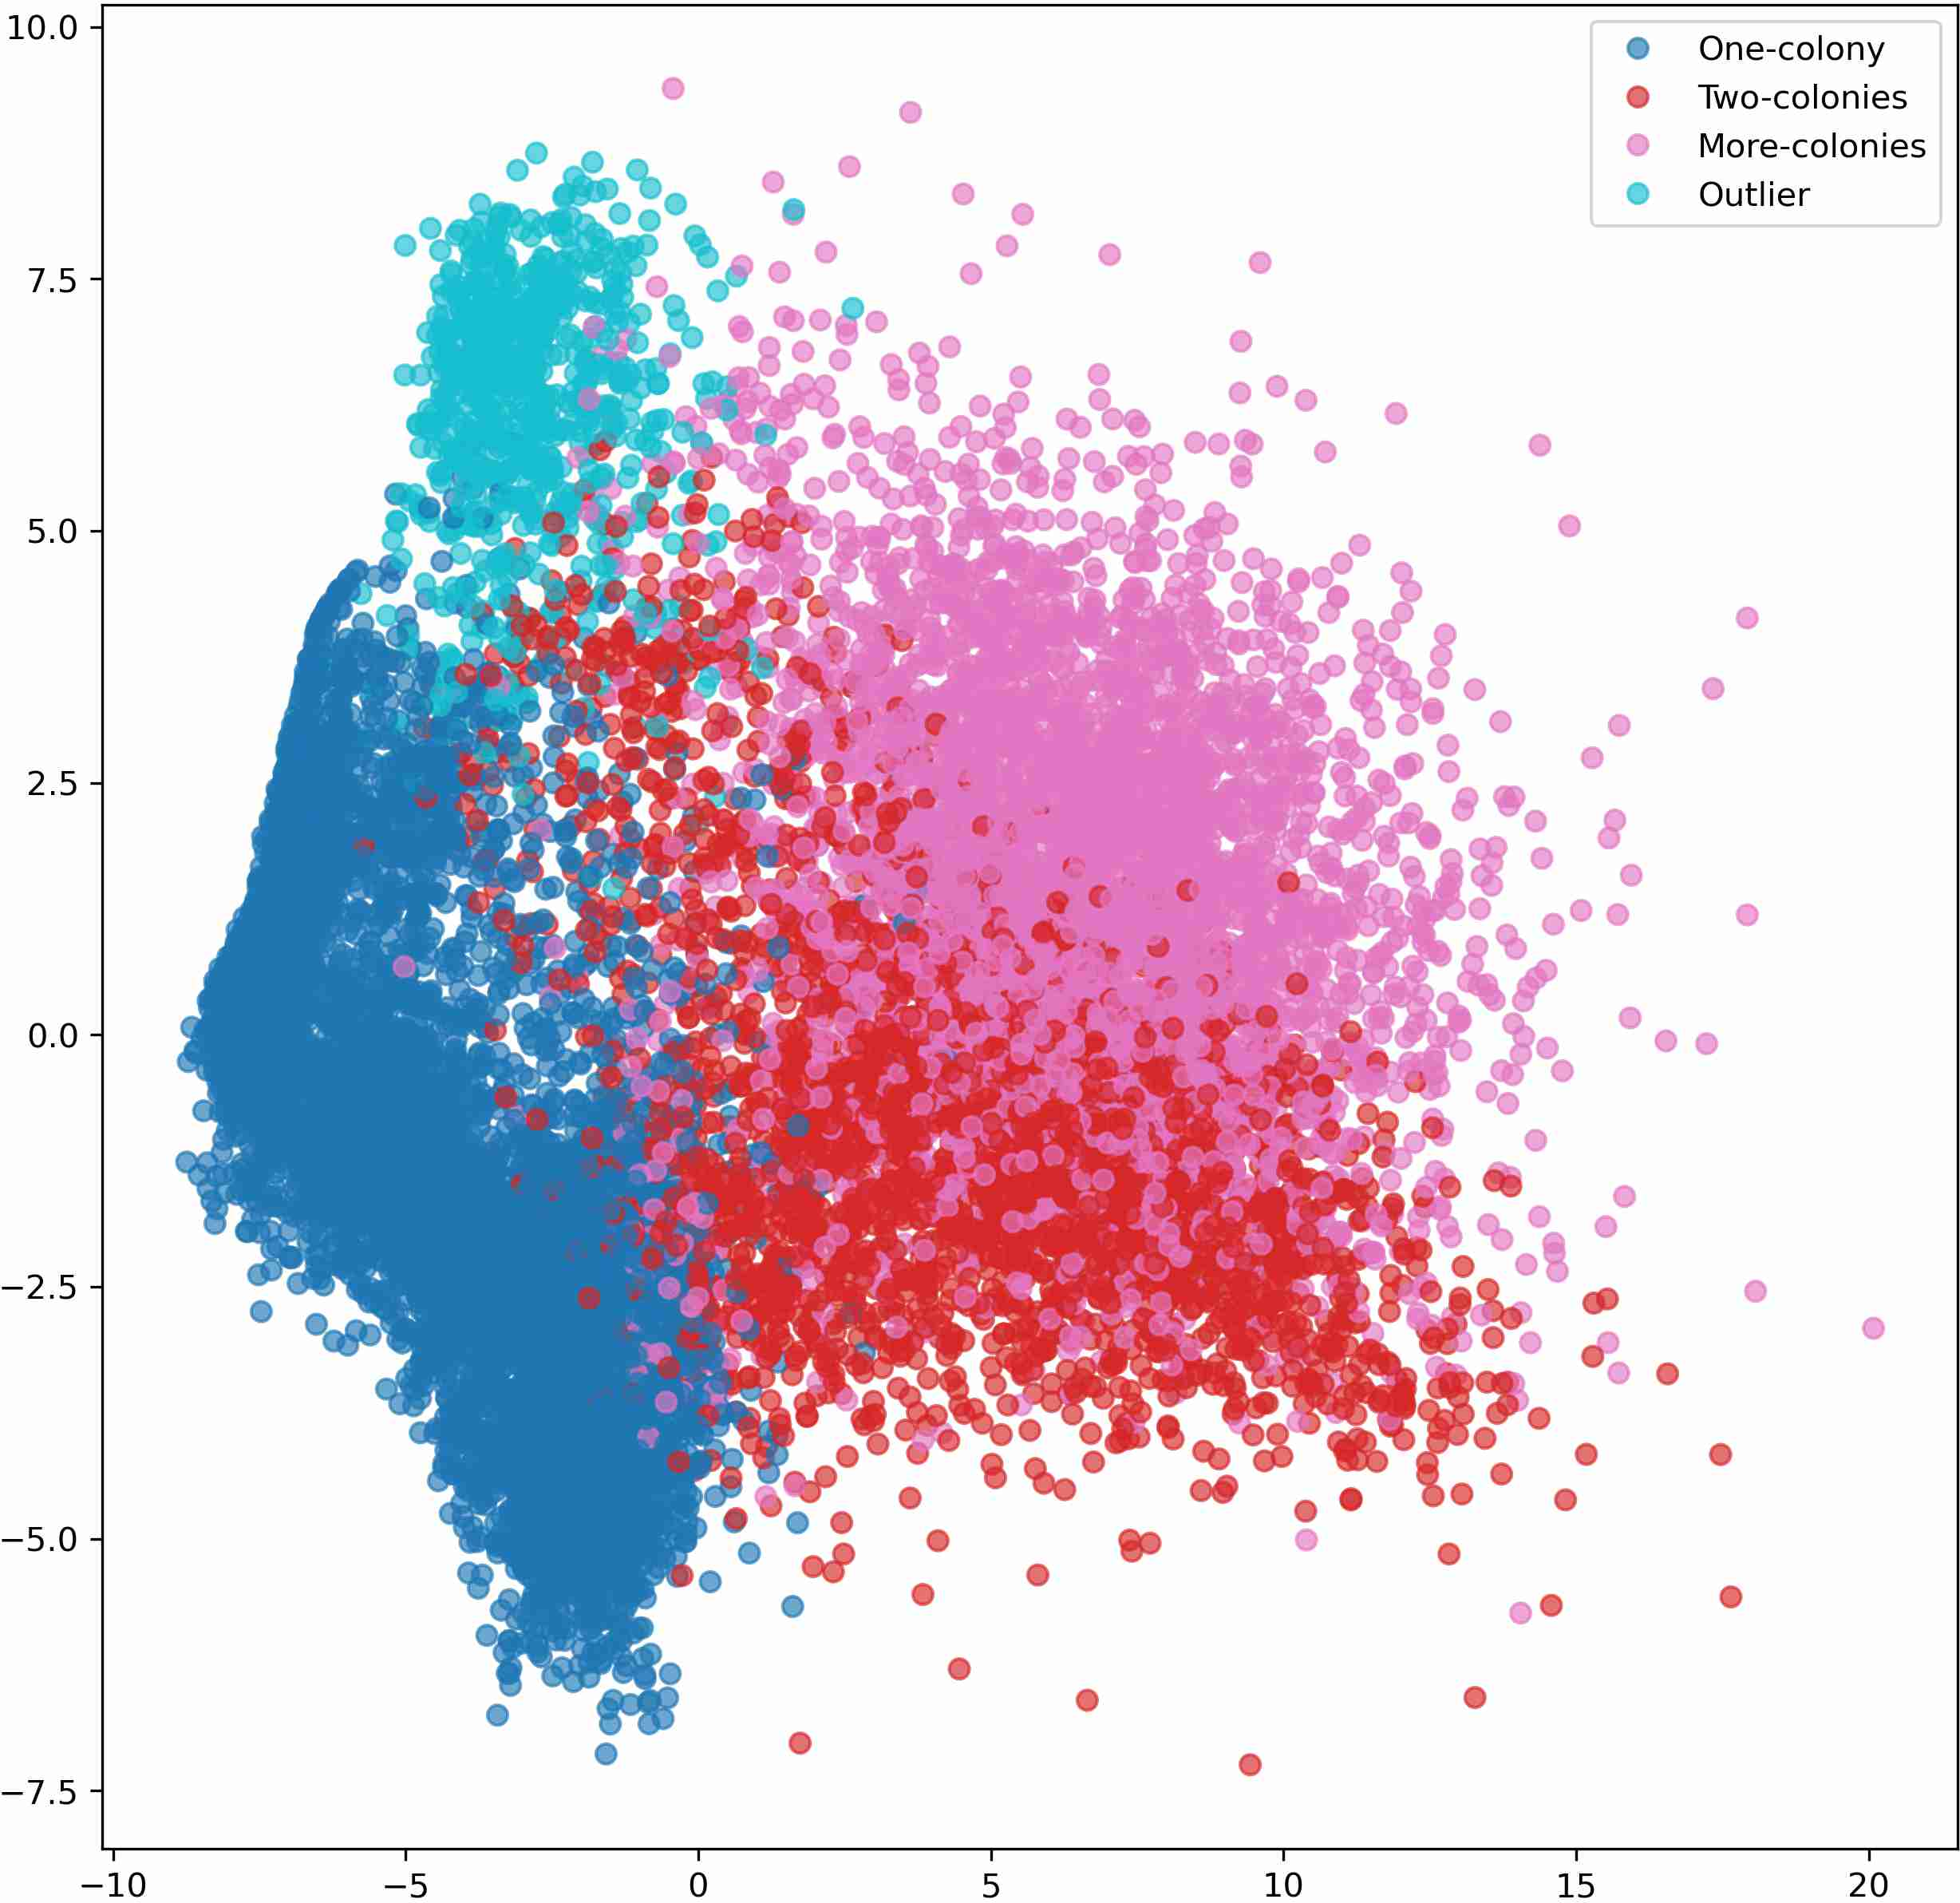
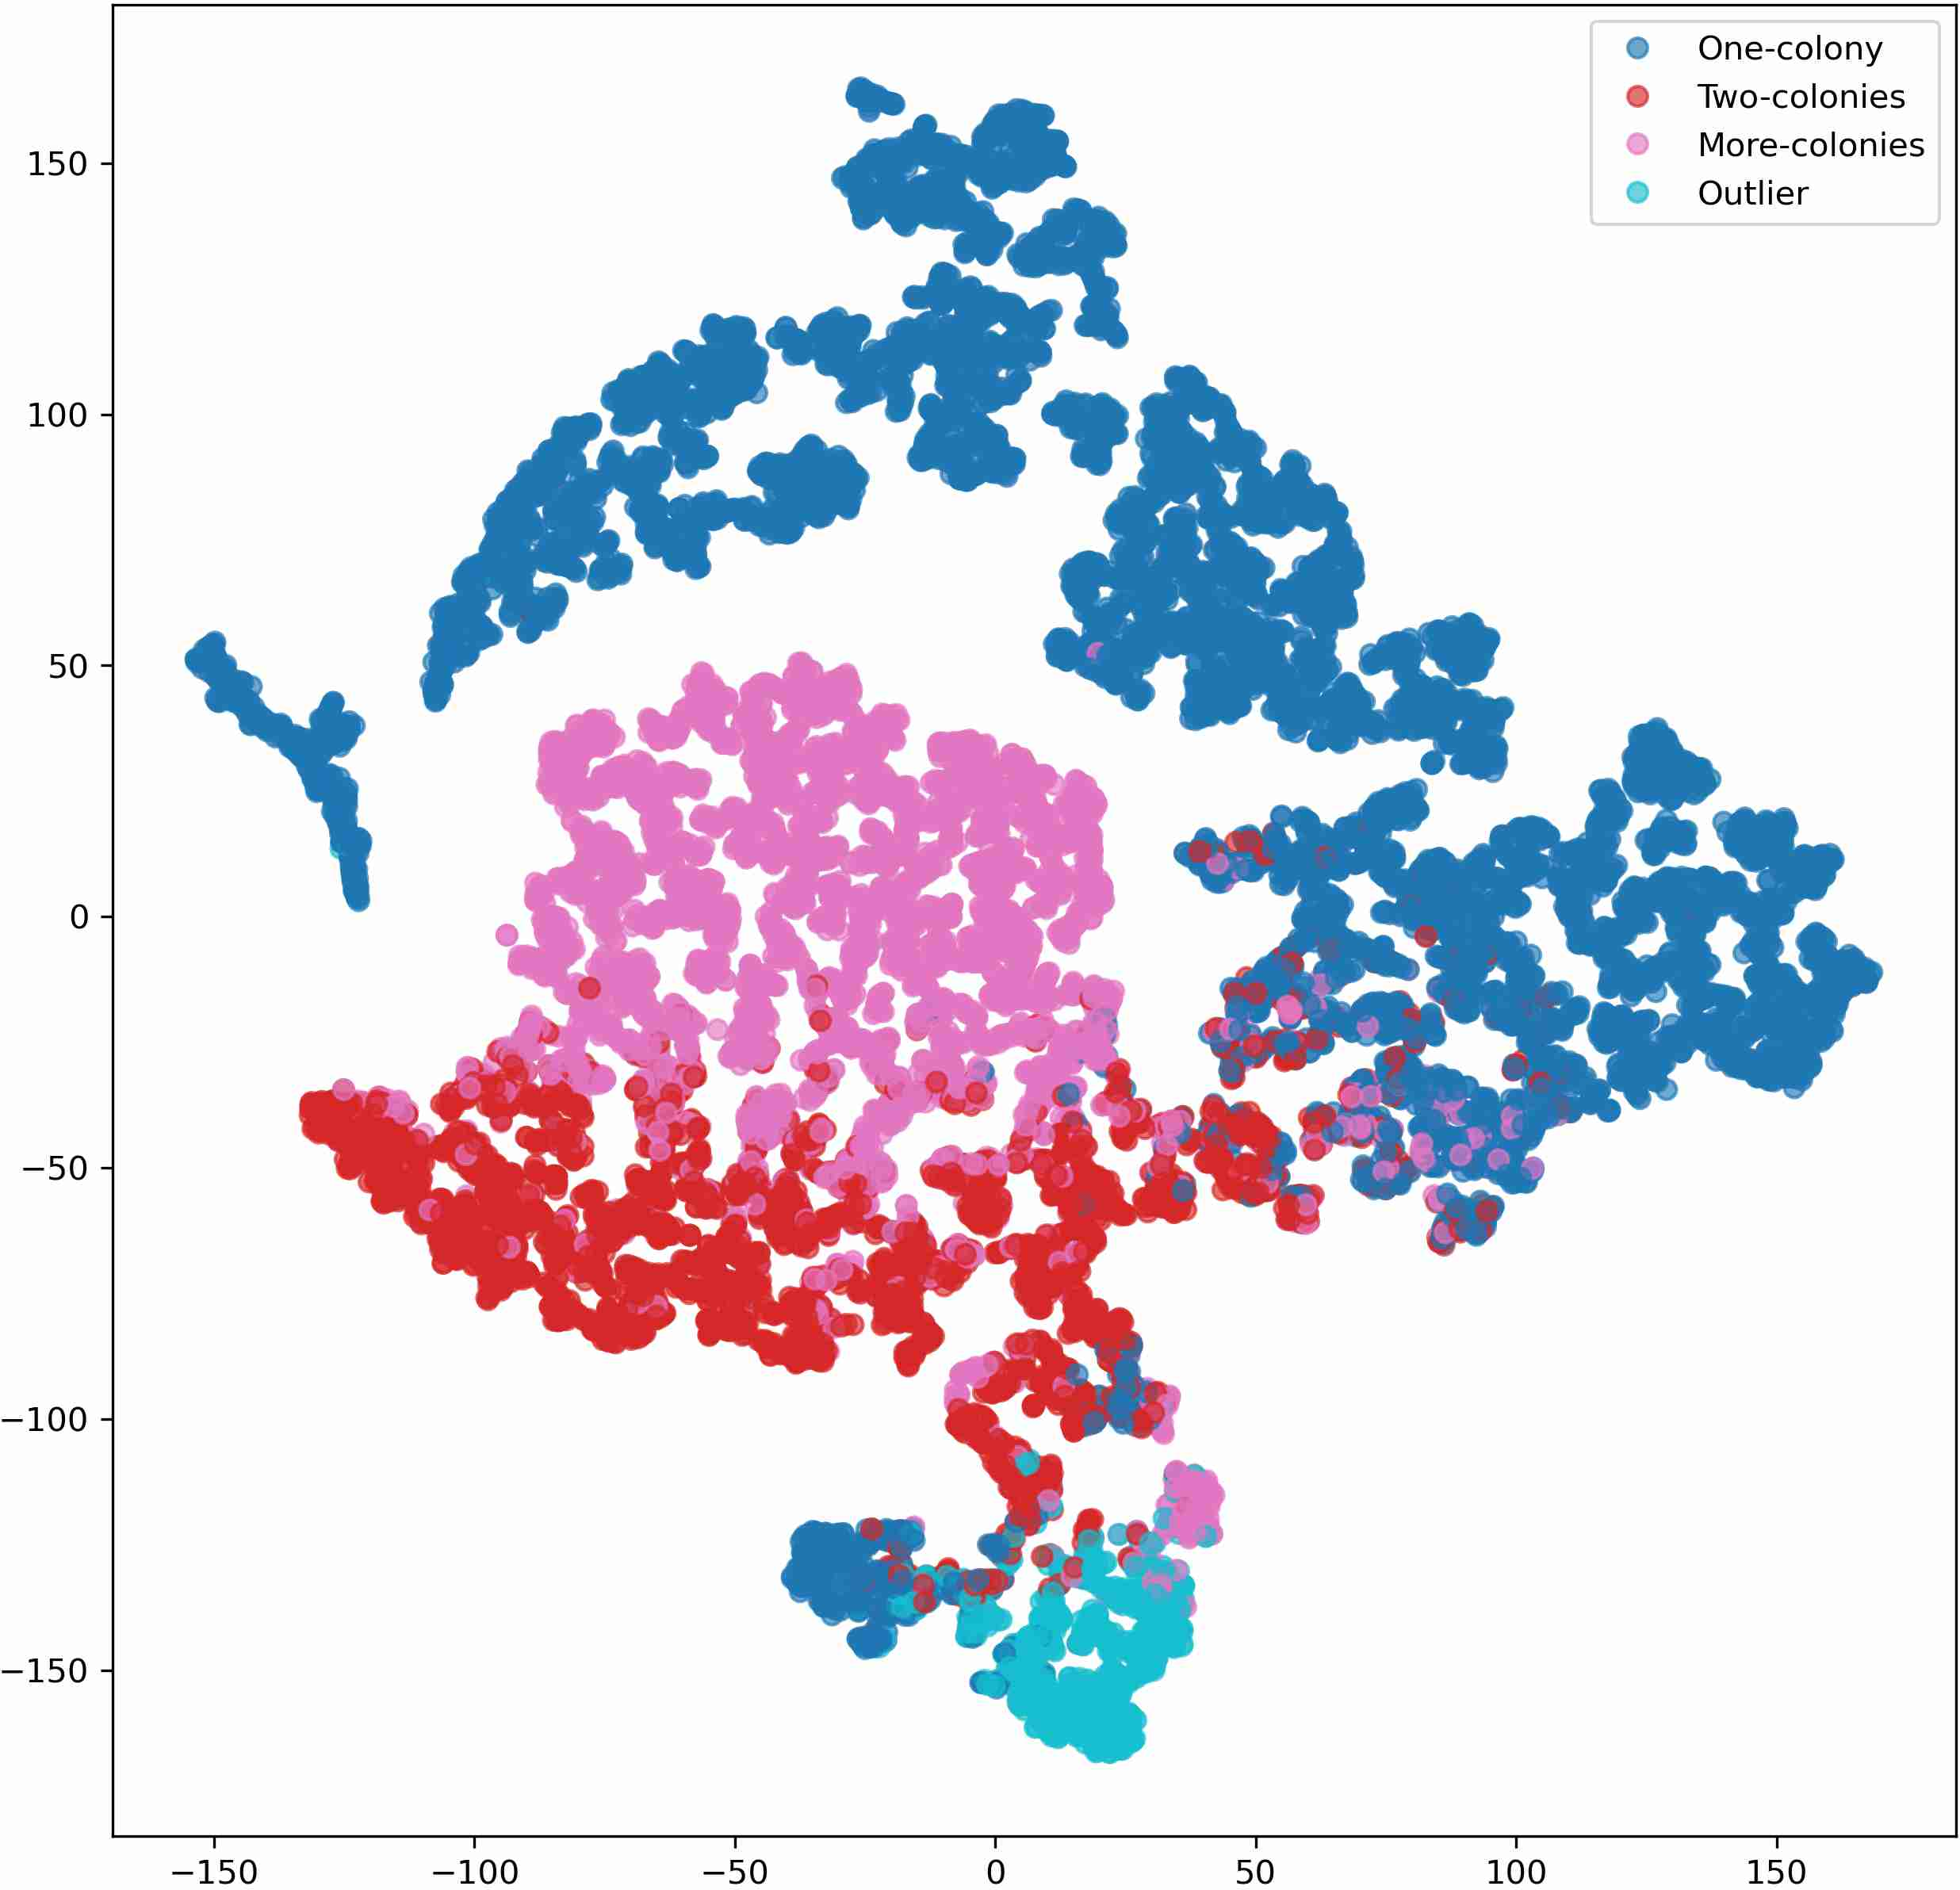
Figure 10: Collapsing visually ambiguous classes leads to significantly improved cluster separation in learned feature space.
Implications for Medical and Biological Imaging
The findings expose the limitations of discriminative CNN classifiers in domains with high intra-class similarity and low inter-class separability, such as bacterial colony analysis. The ineffectiveness of class balancing and advanced data augmentation highlights that fundamental representational ambiguity, not simply data distribution, can bottleneck model performance. This insight challenges common practice and informs the design of future systems for fine-grained count estimation in biological imaging.
From a practical perspective, future work must consider non-discriminative approaches—for example, density map regression methods, which bypass hard discrete labeling in favor of continuous density estimation, may better exploit subtle spatial statistics. Moreover, the demonstrated utility of XAI techniques for model diagnosis (not merely as post hoc rationalization) generalizes to a broad range of medical image analysis contexts where visually ambiguous, imbalanced datasets predominate.
Conclusion
This study provides a rigorous post hoc XAI-driven analysis of cardinality classification for bacterial colony counting with MicrobiaNet (2604.20026). The key finding is that high visual similarity between adjacent cardinality classes constitutes the primary performance-limiting factor; class imbalance is secondary. This conclusion, substantiated by feature-space analyses and class merging experiments, holds significant theoretical and applied consequences for the design and evaluation of CNN-based models in biomedically relevant vision tasks characterized by subtle inter-class differences. Future advances will likely require models explicitly designed to model and exploit nuanced statistical differences, possibly density-based or feature disentanglement approaches.